. 2017 Jul 10;32(1):101-114.e8.
doi: 10.1016/j.ccell.2017.06.002.

Oncogenic Activation of the RNA Binding Protein NELFE and MYC Signaling in Hepatocellular Carcinoma

Affiliations

Oncogenic Activation of the RNA Binding Protein NELFE and MYC Signaling in Hepatocellular Carcinoma

Hien Dang et al. Cancer Cell. .

Abstract

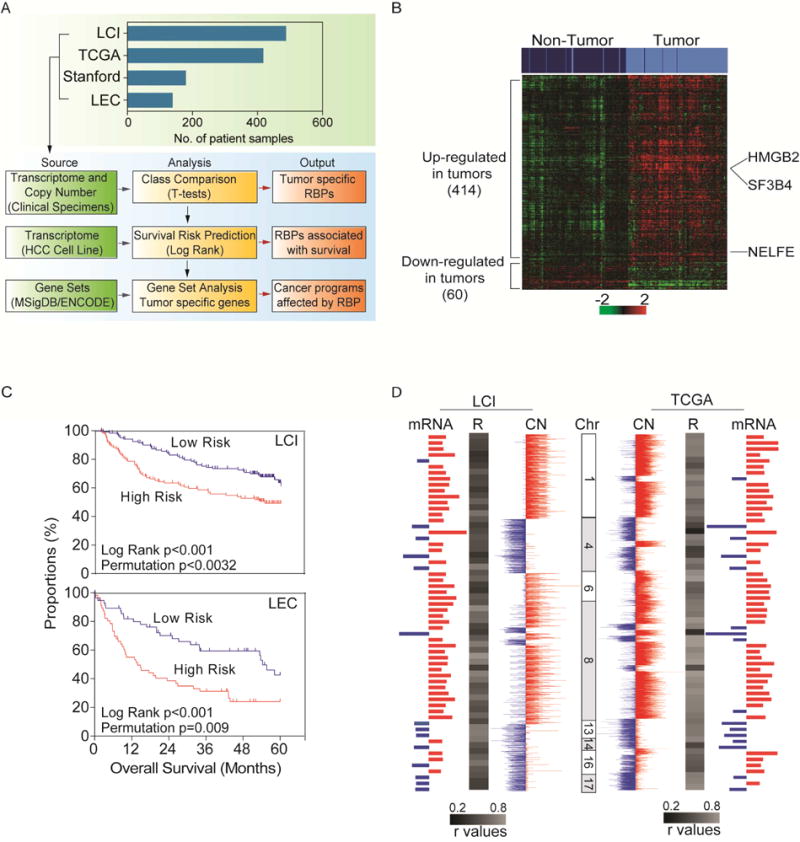
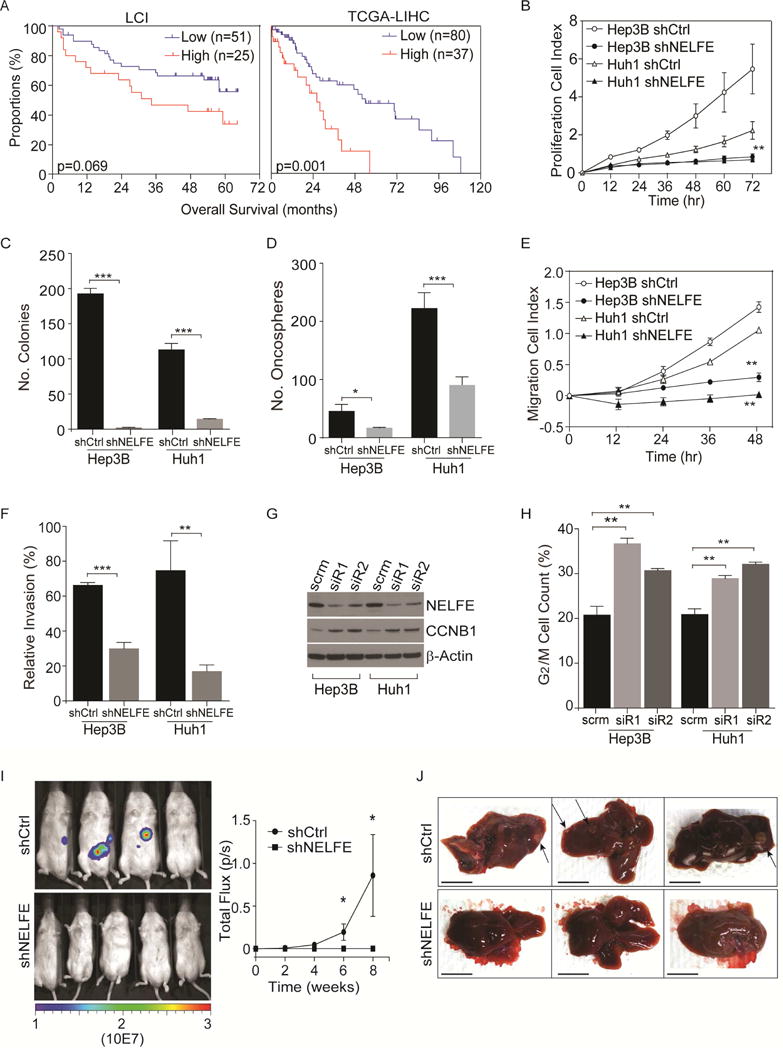
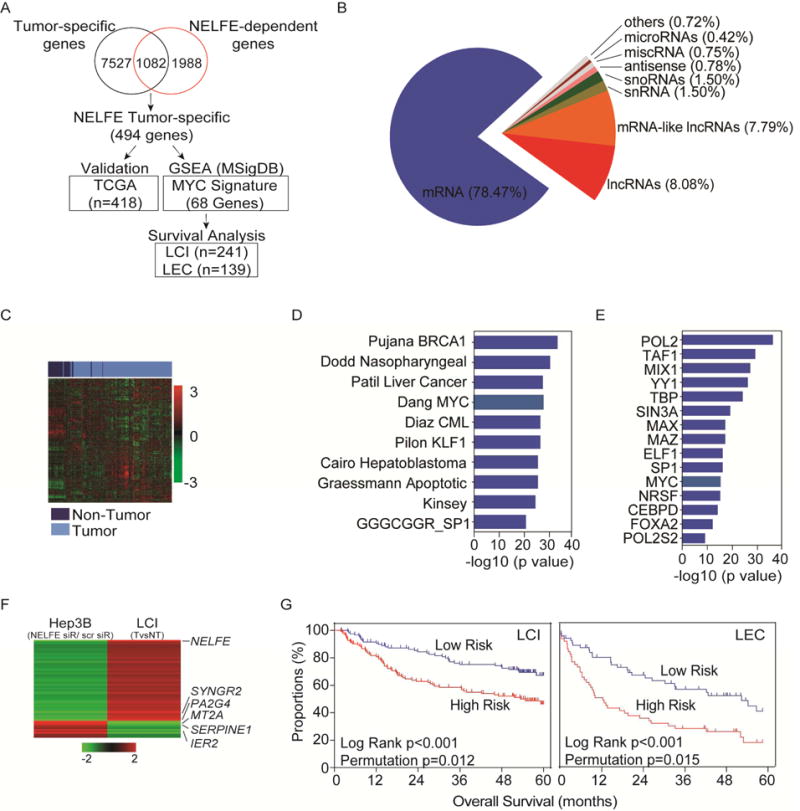
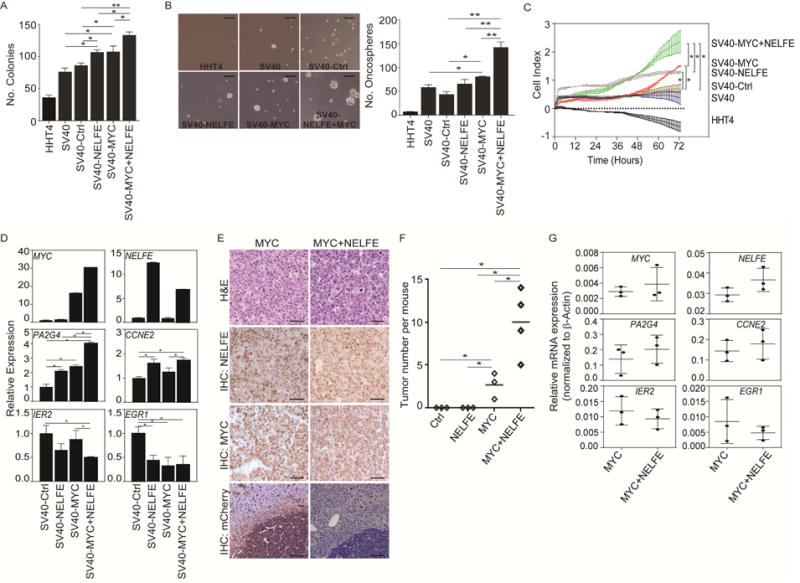
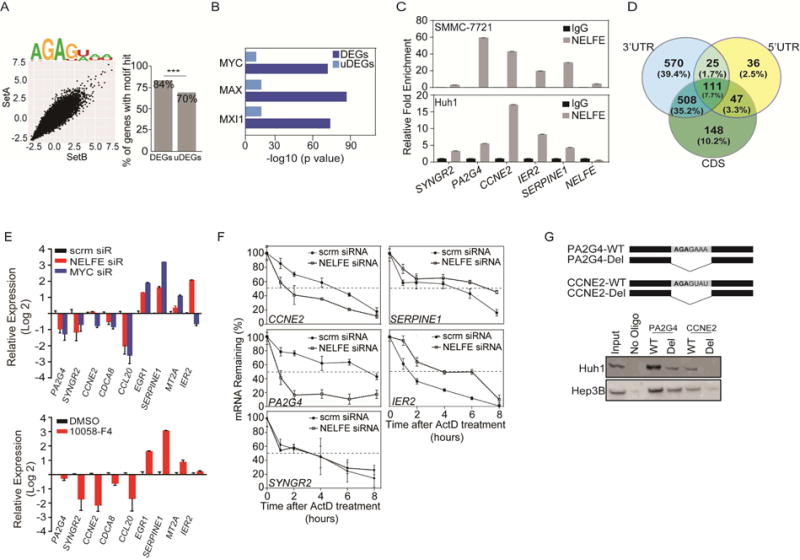
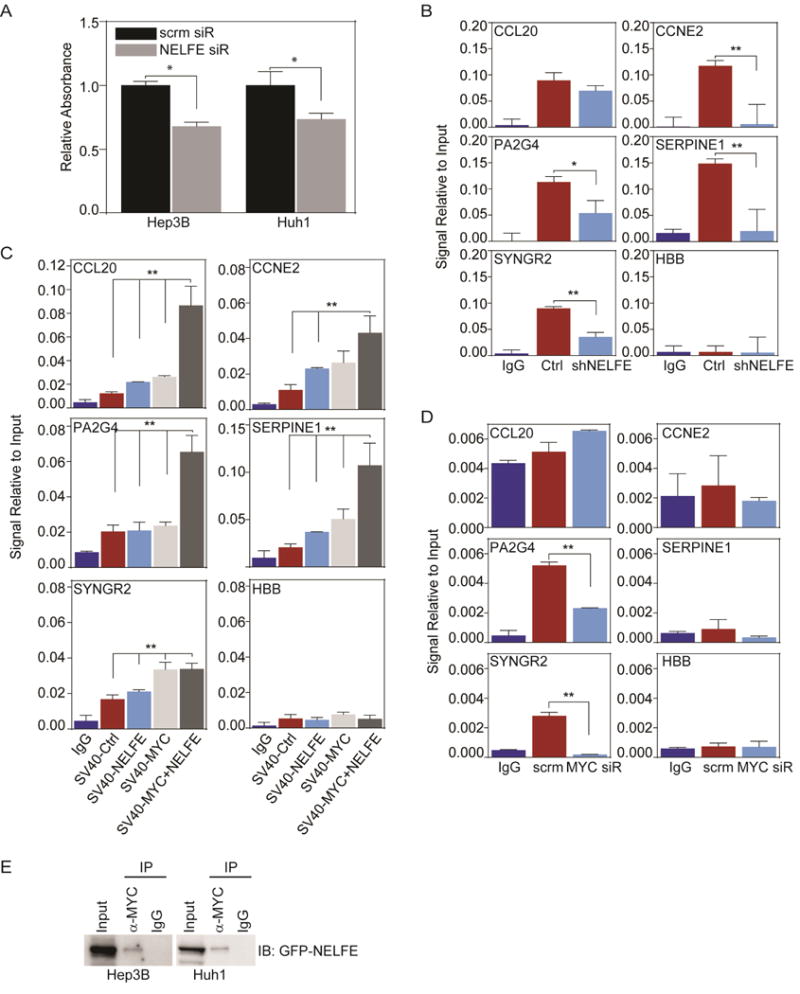
Global transcriptomic imbalance is a ubiquitous feature associated with cancer, including hepatocellular carcinoma (HCC). Analyses of 1,225 clinical HCC samples revealed that a large numbers of RNA binding proteins (RBPs) are dysregulated and that RBP dysregulation is associated with poor prognosis. We further identified that oncogenic activation of a top candidate RBP, negative elongation factor E (NELFE), via somatic copy-number alterations enhanced MYC signaling and promoted HCC progression. Interestingly, NELFE induces a unique tumor transcriptome by selectively regulating MYC-associated genes. Thus, our results revealed NELFE as an oncogenic protein that may contribute to transcriptome imbalance in HCC through the regulation of MYC signaling.

Keywords: MYC; NELFE; RDBP; RNA binding proteins; cancer; hepatocellular carcinoma; oncogene; transcriptome.


Figures

Figure 1
Figure 1
Alterations of RNA binding proteins in hepatocellular carcinoma (HCC). (A) Schematic overview of the study design. Clinical HCC microarray were used to determine differentially expressed RBPs in the LCI datasets (n=488) and validated in the TCGA-LIHC (n=418), Stanford (n=180) and LEC (n=139) datasets using class comparison and survival prediction analysis. (B) Hierarchical clustering and heatmap of LCI datasets of 474 RBPs. Top bars represent sample clustering. Dark blue is non-tumor and light blue is tumor. (C) Kaplan-Meier survival analysis of LCI (High n=120, Low n=121) and LEC (High n=56, Low n=57) datasets based on predictive survival analysis using the 474 RBP gene signatures by gene expression. (D) Integrative analysis of arrayCGH and gene expression microarray of the LCI dataset (on left) and SNParray data and RNASeq TCGA datasets (right). Red represents increase in somatic copy number (SCN) or elevated gene expression in tumors compared to non-tumors. Blue represents loss of SCN or decreased gene expression in tumors compared to non-tumors. See also Figure S1 and Table S1 and S2.
Figure 2
Figure 2
Role of the RNA binding protein NELFE in hepatocellular carcinoma cells. (A) Kaplan-Meier survival analysis of LCI and TCGA-LIHC datasets based on segmentation values of NELFE (high: log2 >0.2, low: log2<0.2). (B–H) Cell proliferation rates measured by xCELLigence (B), colony formation (C), oncosphere formation measured by Algimatrix 3D assay (D), cell migration (E), cell invasion (F), cropped immunoblot (G), and proportions of cells in during G2/M phase measured by 7′AAD staining using flow cytometry (H) of Hep3B and Huh1 HCC cells after shNELFE or shCtrl via lentivirus. Statistical significance for the proliferation rate (B) is measured at time-point 72 hr, results shown in (E–H) were measured at 48 hr. For invasion assay (with matrigel), relative invasion index is calculated by normalizing to cells that have migrated (no matrigel). (I) Bioluminescence of NOD/SCID mice at eight weeks (middle panel). On the right panel, mean signal from shCtrl (n=4) or shNELFE (n=6). (J) Representative livers of three mice in each group. Arrows are pointing at tumor nodules. Scale bars, 1 cm. *p<0.05, **p<0.01, ***p<0.001. All data are mean ± SD. See also Figure S2.
Figure 3
Figure 3
NELFE enhances MYC signaling in HCC. (A) Schematic of overview of microarray analysis to identify correlative genes that are both differentially expressed in clinical samples and in Hep3B cells. (B) Differentially expressed genes were used to identify RNA species affected by NELFE siRNA in Hep3B HCC cells. (C) Hierarchical clustering analysis of the TCGA-LIHC dataset using 494 NELFE-dependent gene list. (D) GSEA analysis of 494 NELFE-dependent genes showing the top 10 most enriched genesets. (E) ENCODE analysis of 494 NELFE-dependent genes showing the top 15 most enriched proteins. 343/494 genes are MYC-related genes within 500 bp from the transcription start site. (F) Heatmap of 68 NELFE-dependent MYC targets (RDMTs) in the LCI datasets and Hep3B siRNA-mediated knockdown of NELFE. Data represents fold change between tumor vs non-tumor for the LCI datasets. For Hep3B, data is fold change between NELFE siRNA vs scrm. (G) Kaplan-Meier curve using the 68 NELFE-dependent MYC-related genes. Predictive survival analysis was performed on the LCI or the LEC datasets with log rank and permutation p values. See also Figure S3 and Table S3.
Figure 4
Figure 4
NELFE enhances MYC tumorigenicity. (A) Bar graph of colony formation assay of HHT4 cells or HHT4 cells ectopically expressing the indicated proteins at day 10. (B) Representatie image and quantifiation of oncosphere formation assay at day 7 measured by Algimatrix 3D assay. Scale bar, 200 μM. (C) Proliferation rates of different cell lines up to 72 hr. (D) RT-PCR analysis of relative mRNA expression of MYC-related genes. (E) Hematoxylin and eosin and immunohistochemical staining of indicated tumors. Scale bars, 40 μM. (F) Number of tumor nodules four weeks aftr the injection of indicated cells. Short horizontal lines represent the mean. (G) RT-PCR analysis of relative mRNA expression of MYC-related genes in MYC or MYC+NELFE tumor tissues. Data were first normalized to β–actin to get dCt. Relative mRNA was then calculated using 2dCt. *p<0.05, **p<0.01. All data are mean ± SD. See also Figure S4.
Figure 5
Figure 5
NELFE preferentially interacts with MYC-related genes. (A) 7-mer Z scores and motifs for the two probe sets for NELFE (left). Differentially (DEGs) and undifferentially (uDEGs) expressed genes were scanned for NELFE motifs (right) (***p=3.7×10−49). (B) ChIP-Seq ENCODE analysis of 1,836 DEGs that were predicted as NELFE associated genes from (A). Showing only the MYC and its family members. (C) RNA immunoprecipitation followed by RT-PCR analysis of MYC-related and NELFE associated genes (CCL20, PA2G4, CCNE2, IER2 and SERPINE1) and MYC-related genes that is not an NELFE predicted gene (SYNGR2). (D) Venn diagram of 1,445 genes whose NELFE RNA consensus sequence was found in the 3′UTR, 5′UTR or CDS. (E) RT-PCR of Huh1 cells after 72 hr of specified siRNA (top) or 16 hr of 10058-F4 treatment (bottom). (F) RT-PCR of MYC-related genes in Huh1 cells after NELFE siRNA followed by Actinomycin D treatment (10 μg/ml) over time. Dotted lines are at 50% mRNA remaining. (G) Synthetic RNA oligos with the indicated NELFE consensus sequences for PA2G4 or CCNE2 (Top) were examined via RNA pull down and blotted for NELFE (Bottom: cropped immunoblot). All data are mean ± SD. See also Figure S5 and Table S4.
Figure 6
Figure 6
NELFE affects MYC-related genes by modulating MYC binding. (A) MYC transam assay on HCC cells treated with 48 hr of NELFE siRNA compared to scrm (*p<0.01). (B) ChIP-PCR of MYC-related genes of HCC cells after shNELFE compared shCtrl. Data is relative to 2% input. (C) ChIP-PCR of MYC-related genes of HHT4-SV40 cells overexpressed with Ctrl, NELFE, MYC or MYC+NELFE. Anti-MYC was used for IP. (D) ChIP-PCR of MYC-related genes in Hep3B cells after 48 hr of MYC siRNA or scrm. Anti-NELFE was used for IP. (E) Represented immunoblot of co-IP assay in HCC cells. MYC or Rabbit IgG was used for IP. All data are mean ± SD. See also Figure S6.

References

    1. Adelman K, Lis JT. Promoter-proximal pausing of RNA polymerase II: emerging roles in metazoans. Nature reviews Genetics. 2012;13:720–731. - PMC - PubMed
    1. Auerbach RK, Chen B, Butte AJ. Relating genes to function: identifying enriched transcription factors using the ENCODE ChIP-Seq significance tool. Bioinformatics. 2013;29:1922–1924. - PMC - PubMed
    1. Beer S, Zetterberg A, Ihrie RA, McTaggart RA, Yang Q, Bradon N, Arvanitis C, Attardi LD, Feng S, Ruebner B, et al. Developmental context determines latency of MYC-induced tumorigenesis. PLoS Biol. 2004;2:e332. - PMC - PubMed
    1. Boyault S, Rickman DS, de Reynies A, Balabaud C, Rebouissou S, Jeannot E, Herault A, Saric J, Belghiti J, Franco D, et al. Transcriptome classification of HCC is related to gene alterations and to new therapeutic targets. Hepatology. 2007;45:42–52. - PubMed
    1. Busa R, Paronetto MP, Farini D, Pierantozzi E, Botti F, Angelini DF, Attisani F, Vespasiani G, Sette C. The RNA-binding protein Sam68 contributes to proliferation and survival of human prostate cancer cells. Oncogene. 2007;26:4372–4382. - PubMed

Publication types

MeSH terms

Substances