. 2017 Jul 10;32(1):42-56.e6.
doi: 10.1016/j.ccell.2017.06.003.

Tumor Evolution of Glioma-Intrinsic Gene Expression Subtypes Associates with Immunological Changes in the Microenvironment

Affiliations

Tumor Evolution of Glioma-Intrinsic Gene Expression Subtypes Associates with Immunological Changes in the Microenvironment

Qianghu Wang et al. Cancer Cell. .

Erratum in

  • Tumor Evolution of Glioma-Intrinsic Gene Expression Subtypes Associates with Immunological Changes in the Microenvironment.
    Wang Q, Hu B, Hu X, Kim H, Squatrito M, Scarpace L, deCarvalho AC, Lyu S, Li P, Li Y, Barthel F, Cho HJ, Lin YH, Satani N, Martinez-Ledesma E, Zheng S, Chang E, Gabriel Sauvé CE, Olar A, Lan ZD, Finocchiaro G, Phillips JJ, Berger MS, Gabrusiewicz KR, Wang G, Eskilsson E, Hu J, Mikkelsen T, DePinho RA, Muller F, Heimberger AB, Sulman EP, Nam DH, Verhaak RGW. Wang Q, et al. Cancer Cell. 2018 Jan 8;33(1):152. doi: 10.1016/j.ccell.2017.12.012. Cancer Cell. 2018. PMID: 29316430 Free PMC article. No abstract available.

Abstract

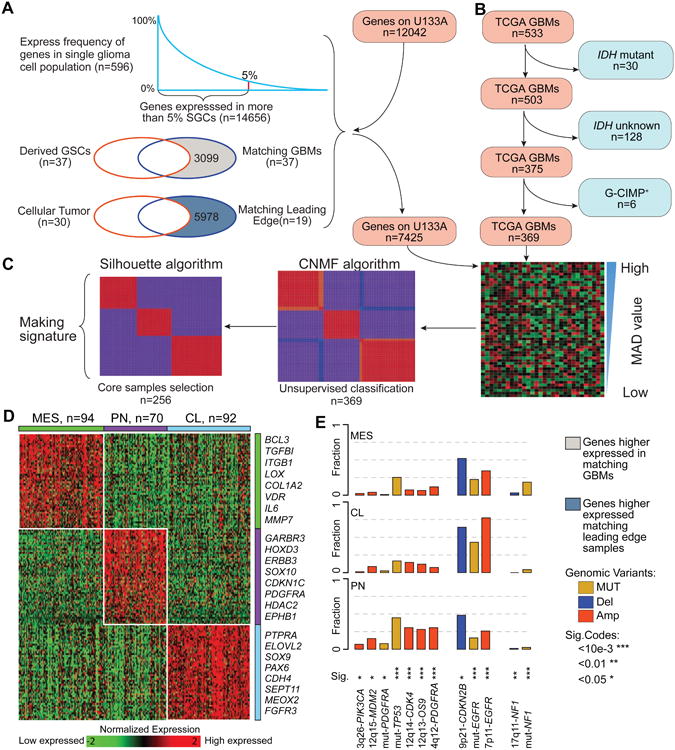
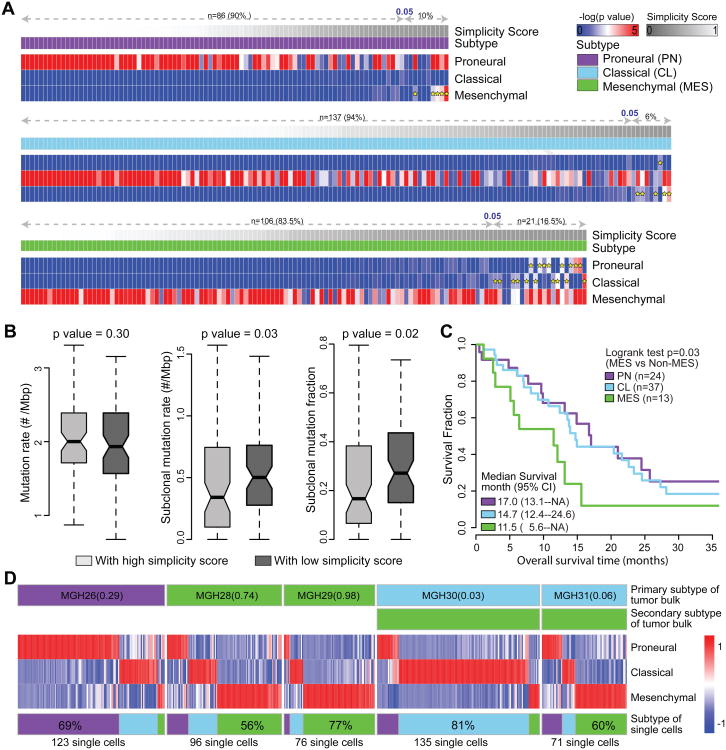
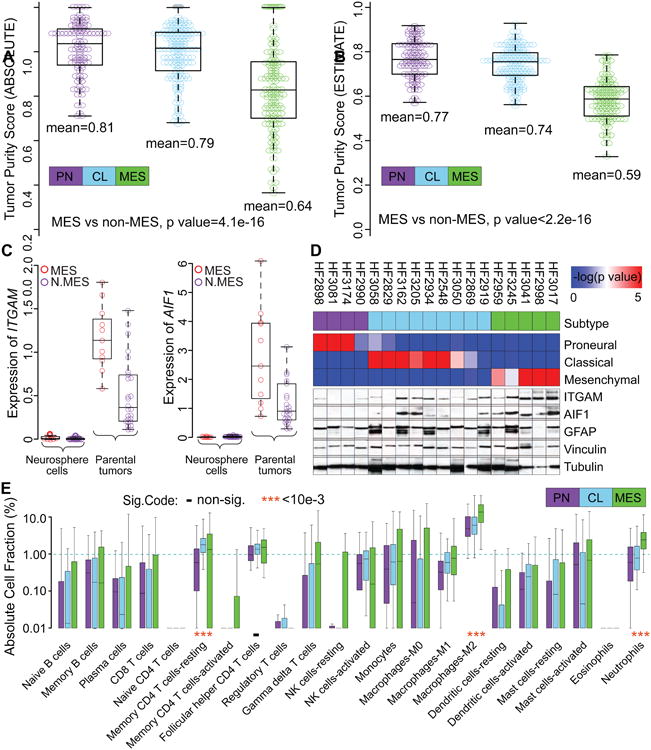
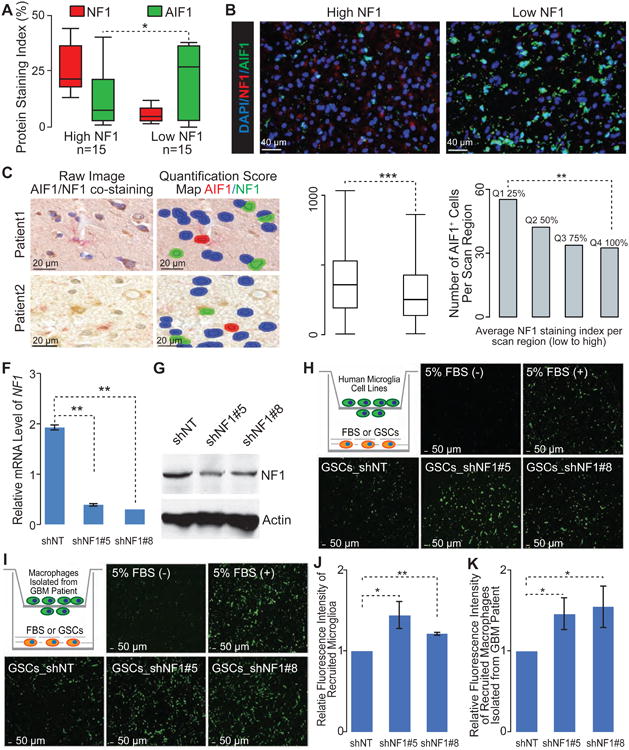
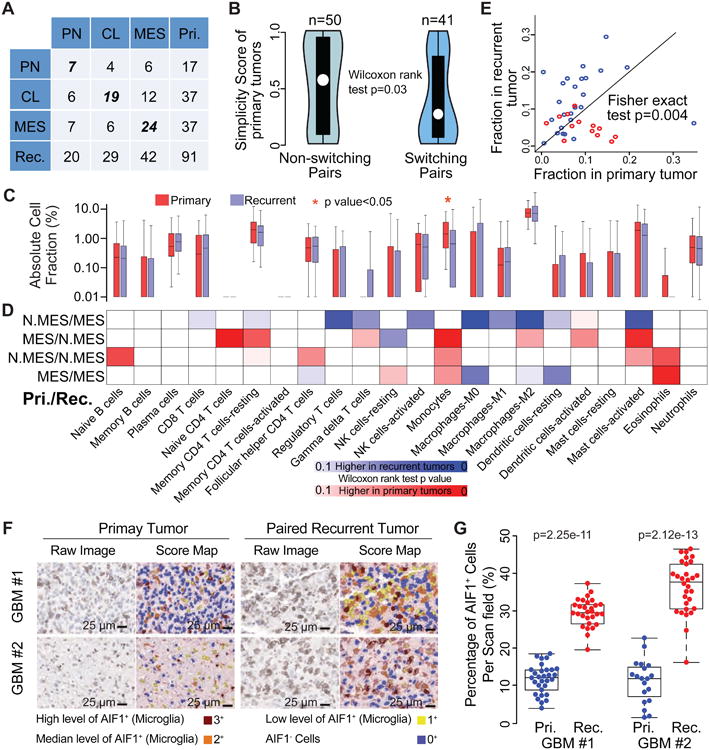
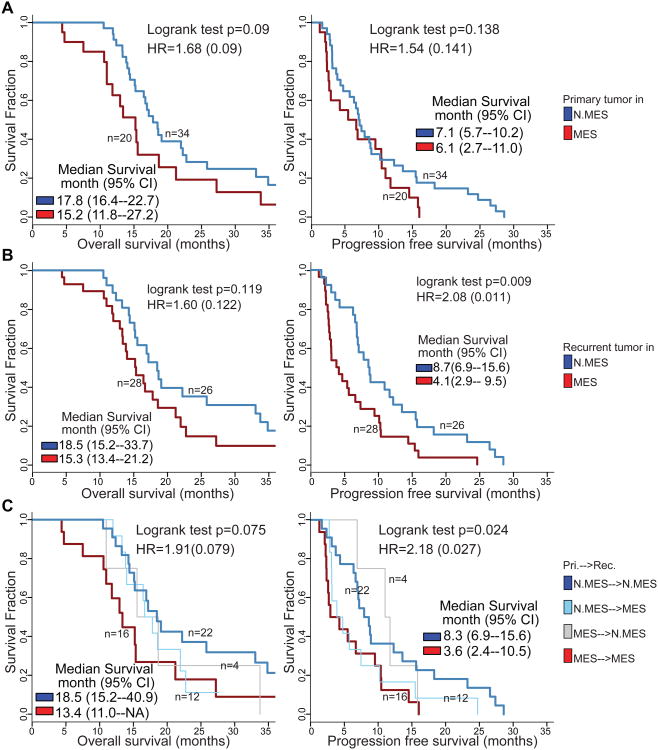
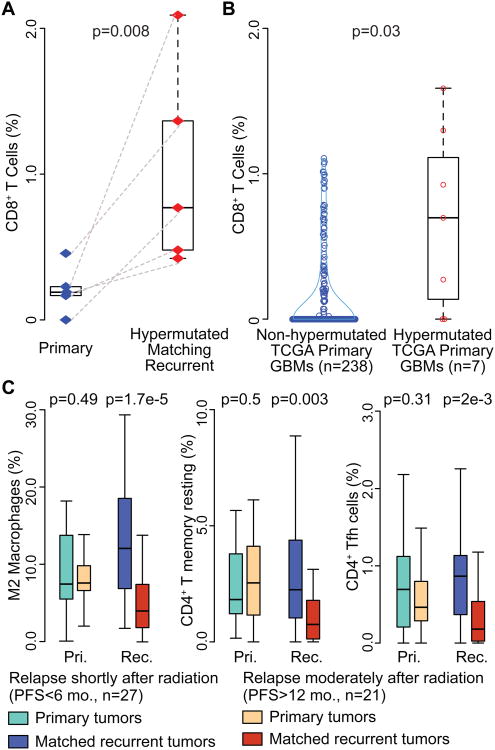
We leveraged IDH wild-type glioblastomas, derivative neurospheres, and single-cell gene expression profiles to define three tumor-intrinsic transcriptional subtypes designated as proneural, mesenchymal, and classical. Transcriptomic subtype multiplicity correlated with increased intratumoral heterogeneity and presence of tumor microenvironment. In silico cell sorting identified macrophages/microglia, CD4+ T lymphocytes, and neutrophils in the glioma microenvironment. NF1 deficiency resulted in increased tumor-associated macrophages/microglia infiltration. Longitudinal transcriptome analysis showed that expression subtype is retained in 55% of cases. Gene signature-based tumor microenvironment inference revealed a decrease in invading monocytes and a subtype-dependent increase in macrophages/microglia cells upon disease recurrence. Hypermutation at diagnosis or at recurrence associated with CD8+ T cell enrichment. Frequency of M2 macrophages detection associated with short-term relapse after radiation therapy.

Keywords: disease recurrence; glioblastoma; immune cells; macrophages/microglia; mesenchymal subtype; proneural to mesenchymal transition; tumor evolution; tumor microenvironment.


Figures

Figure 1
Figure 1. Molecular classification of IDH-WT GBMs
(A) Filtering tumor associated microenvironment genes. (B) Defining an IDH-WT GBM cohort in TCGA. (C) Overview of NMF clustering procedures. (D) Heatmap of 50-gene signatures by gene expression subtype. Representative genes are shown for each subtype. (E) Frequency of subtype related somatic genomic alterations. Chi-square test was used to calculate the distribution difference among three subtypes per genomic variant. See also Figure S1, Tables S1 and S2, and Method S1.
Figure 2
Figure 2. Multi activation of transcriptional subtypes associated with intratumoral heterogeneity
(A) The expression profiles of 369 IDH-WT GBMs were analyzed using Affymetrix U133A. The -log(empirical p value) of raw ssGSEA enrichment scores at each signature are shown as heatmaps, with dark blue representing no activation and bright red as highly activated. Yellow star indicates the secondary activated subtype (empirical p value < 0.05). For each panel, the first row shows simplicity score, and the second row indicates transcriptional subtype. (B) Comparison of mutation rate, subclonal mutation rate and subclonal mutation fraction between IDH-WT GBMs with high and low simplicity scores. p values were calculated using Wilcoxon rank test and shown at the top of each panel. Boxplots represent 25th and 75th percentiles, with midlines indicating the median values and points within the boxes indicating the mean values. Whiskers extend to the lowest/highest values of the data sample exculding outliers. The notch displays the 95% confidence interval around the median. (C) Kaplan-Meier survival curve by subtype. (D) Transcriptome classification of five bulk tumor samples and 501 single GBM cells derived from them. The top two row of each panel show the dominant and secondary subtype of the GBM tumor bulk. The heatmap of each panel shows the empirical -log(p value) of the ssGSEA scores of the derived single GBM cells on each of the three subtype signatures. The bottom row shows the subtype distribution of derived single GBM cells within the same GBM tumor of origin. See also Figure S2 and Tables S3 and S4.
Figure 3
Figure 3. Transcriptional subtypes differentially activate the immune microenvironment
(A, B) Tumor purity of 364 and 369 TCGA IDH-WT GBM samples was determined by ABSOLUTE (A) and ESTIMATE (B), respectively. The difference in tumor purity between subtypes was evaluated using a two-sample Student t-test. (C) Comparison of ITGAM and AIF1 gene expression levels between GBM and derived neurosphere models. N.MES indicates non-mesenchymal cases. (D) The upper panel shows ssGSEA enrichment scores and associated expression subtype classifications. Bottom panels display protein expression of the microglial markers ITGAM and AIF1, astrocyte marker glial fibrillary acidic protein (GFAP) and the loading control tubulin and vinculin. (E) Comparison of immune cell fractions among subtypes. Immune cell fractions were estimated using CIBERSORT and corrected using ABSOLUTE purity scores per sample. The distribution of immune cell fractions of 86 PN, 136 CL and 104 MES IDH-WT GBMs with simplicity score>0.05 were shown by purple, skyblue and green boxplots, respectively. Median value difference of cell fraction among subtypes was evaluated using Mood's test. Boxplots represent 25th and 75th percentiles, with midlines indicating the median values and points within the boxes indicating the mean values. Whiskers extend to the lowest/highest values of the data sample excluding outliers (A-C, E). See also Figure S3 and Table S5.
Figure 4
Figure 4. Decreased NF1 expression enhances the recruitment of macrophages/microglia in GBM
(A) Quantification of NF1 and AIF1 staining by Immunofluorescence (IF) in 6 GBMs from TCGA (IDH-WT). At least 3 regions from each tumor were analyzed (n=30 regions). (B) Representative IF images show NF1 and AIF1 staining TCGA IDH-WT GBMs. (C) Representative images with IHC double-staining and cell segmentation obtained from Caliper InForm analysis software show the close proximity of AIF1+ cells (red) and NF1- cells (blue) compared with NF1+ cells (green) in tumor sections from two GBM patients. (D) Boxplot of distances from AIF1+ cells to the nearest NF1- and NF1+ cells, respectively (4022 AIF1+ cells from 30 GBMs). (E) The appearance of AIF1+ cells within tumor sections with the various level of NF1 expression from 30 GBMs. (F) qRT-PCR for NF1 mRNA levels in patient-derived GSCs (TS603) by the indicated short hairpins (shNT, non-targeting short hairpin as control). Error bars represent SD of mean, n=3. (G) Immunoblot analysis of NF1 protein level in TS603 with short hairpins knocking down. (H, I) Representative IF images show the recruited human microglia (H) or GBM patient derived macrophages (I) by TS603 with NF1 knocking down in transwell assay. Cartoon depicting the experimental approach. (J, K) Quantification of recruited human microglia (J) or GBM patient derived macrophages (K) by TS603 with NF1 knocking down in transwell assay. Error bars represent SD of means from three independent experiments (J) or three biological replications (K). *, **, *** indicated the Student t-test / Wilcoxon rank test p value <0.05, 0.01, and 0.001, respectively, by paired student t test. Boxplots represent 25th and 75th percentiles, with midlines indicating the median values and points within the boxes indicating the mean values. Whiskers extend to the lowest/highest values of the data sample excluding outliers (A, D). See also Figure S4.
Figure 5
Figure 5. Microenvironment transition between 91 primary and paired recurrent IDH-WT GBM
(A) Rows and columns of the cross table represents subtype distribution frequency of primary and paired recurrent tumors, respectively. (B) Violin plots show the distribution of simplicity scores of pairs without (left) and with (right) subtype transition. (C) Red and blue boxplots represent the immune cell fraction distribution of each immune cell type. Immune cell fraction was calculated using CIBERSORT and adjusted using ESTIMATE purity scores. Difference between cell fraction of primary and paired recurrent tumors was calculated using Wilcoxon rank test. (D) The blue-to-red heatmap represents immune cell fraction changes upon tumor recurrence per subtype transitions which were list on the left of the heatmap. Fisher exact test was used to evaluate the distribution difference between patients with higher/lower immune cell fractions at tumor recurrence per subtype transition. N.MES indicates non-mesenchymal case. (E) Each dot represents a pair of primary and recurrent GBM with axes indicating M2 macrophage cell fraction. (F) Representative images of AIF1 IHC staining and corresponding score map obtained by InForm image analysis in two matched pairs of primary and recurrent GBM. Scale bar, 25 μm. (G) Unbiased quantification of AIF1+ percentage in primary and recurrent GBMs, statistical testing was performed using Wilcoxon rank test. Boxplots represent 25th and 75th percentiles, with midlines indicating the median values and points within the boxes indicating the mean values. Whiskers extend to the lowest/highest values of the data sample exculding outliers (B, C, G). See also Figure S5 and Table S6.
Figure 6
Figure 6. Survival analysis of paired IDH-WT GBM
(A) OS and PFS analyses between samples with different primary subtype. (B) Difference of survival time after secondary surgery between patients with non-MES and MES in primary tumors (left) and in recurrent tumors (right). (C) OS and PFS analyses between samples with difference recurrent subtype. See also Figure S5.
Figure 7
Figure 7. Immune cell frequency comparison
(A) Blue and red diamond indicate individual primary and recurrent tumors. Dash line connects paired primary and recurrent tumors. (B) Blue and red circle indicate non-hypermutated and hypermutated primary samples. (C) Sky blue/dark blue and orange/red boxplots indicate short- and long- term relapsed tumors, respectively. y-axis stands for immune cell fraction. Wilcoxon rank tests were used to examine the significance of the differences between groups, and p values were shown at top of each panel. Boxplots represent 25th and 75th percentiles, with midlines indicating the median values and points within the boxes indicating the mean values. Whiskers extend to the lowest/highest values of the data sample exculding outliers (A-C). See also Figure S6 and Table S7.

Similar articles

Cited by

References

    1. Alexandrov LB, Nik-Zainal S, Wedge DC, Aparicio SA, Behjati S, Biankin AV, Bignell GR, Bolli N, Borg A, Borresen-Dale AL, et al. Signatures of mutational processes in human cancer. Nature. 2013;500:415–421. - PMC - PubMed
    1. Aran D, Sirota M, Butte AJ. Systematic pan-cancer analysis of tumour purity. Nat Commun. 2015;6:8971. - PMC - PubMed
    1. Bao S, Wu Q, McLendon RE, Hao Y, Shi Q, Hjelmeland AB, Dewhirst MW, Bigner DD, Rich JN. Glioma stem cells promote radioresistance by preferential activation of the DNA damage response. Nature. 2006;444:756–760. - PubMed
    1. Barbie DA, Tamayo P, Boehm JS, Kim SY, Moody SE, Dunn IF, Schinzel AC, Sandy P, Meylan E, Scholl C, et al. Systematic RNA interference reveals that oncogenic KRAS-driven cancers require TBK1. Nature. 2009;462:108–112. - PMC - PubMed
    1. Baysan M, Bozdag S, Cam MC, Kotliarova S, Ahn S, Walling J, Killian JK, Stevenson H, Meltzer P, Fine HA. G-cimp status prediction of glioblastoma samples using mRNA expression data. PloS one. 2012;7:e47839. - PMC - PubMed

Publication types