. 2017 Jul 10;32(1):71-87.e7.
doi: 10.1016/j.ccell.2017.06.004.

MUC1 and HIF-1alpha Signaling Crosstalk Induces Anabolic Glucose Metabolism to Impart Gemcitabine Resistance to Pancreatic Cancer

Affiliations

MUC1 and HIF-1alpha Signaling Crosstalk Induces Anabolic Glucose Metabolism to Impart Gemcitabine Resistance to Pancreatic Cancer

Surendra K Shukla et al. Cancer Cell. .

Erratum in

  • MUC1 and HIF-1alpha Signaling Crosstalk Induces Anabolic Glucose Metabolism to Impart Gemcitabine Resistance to Pancreatic Cancer.
    Shukla SK, Purohit V, Mehla K, Gunda V, Chaika NV, Vernucci E, King RJ, Abrego J, Goode GD, Dasgupta A, Illies AL, Gebregiworgis T, Dai B, Augustine JJ, Murthy D, Attri KS, Mashadova O, Grandgenett PM, Powers R, Ly QP, Lazenby AJ, Grem JL, Yu F, Matés JM, Asara JM, Kim JW, Hankins JH, Weekes C, Hollingsworth MA, Serkova NJ, Sasson AR, Fleming JB, Oliveto JM, Lyssiotis CA, Cantley LC, Berim L, Singh PK. Shukla SK, et al. Cancer Cell. 2017 Sep 11;32(3):392. doi: 10.1016/j.ccell.2017.08.008. Cancer Cell. 2017. PMID: 28898700 No abstract available.

Abstract

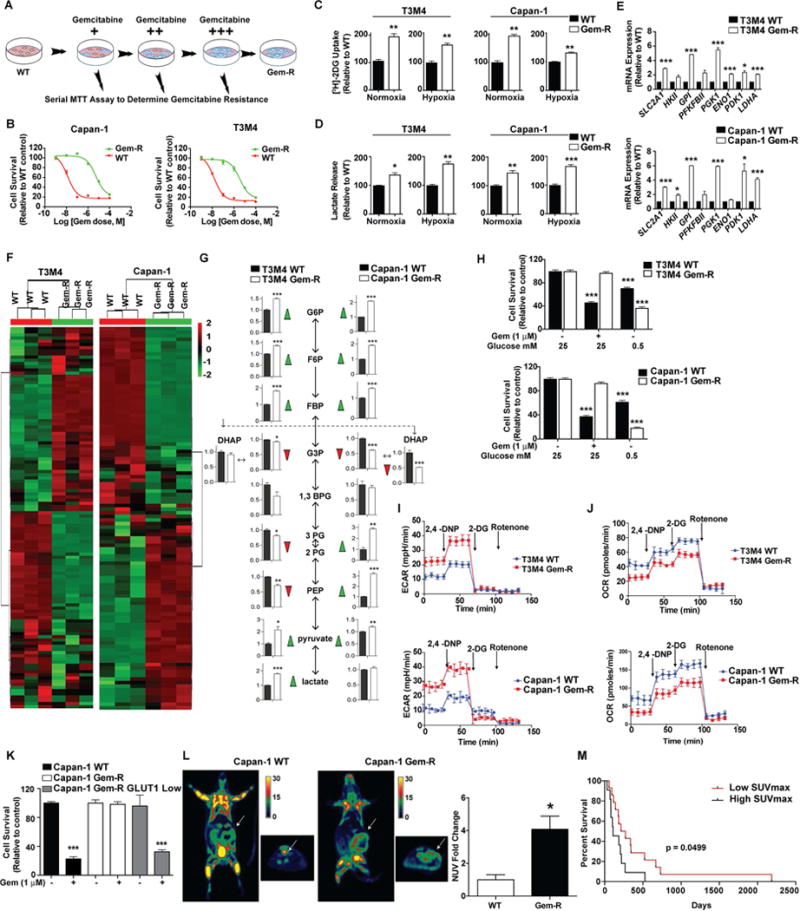
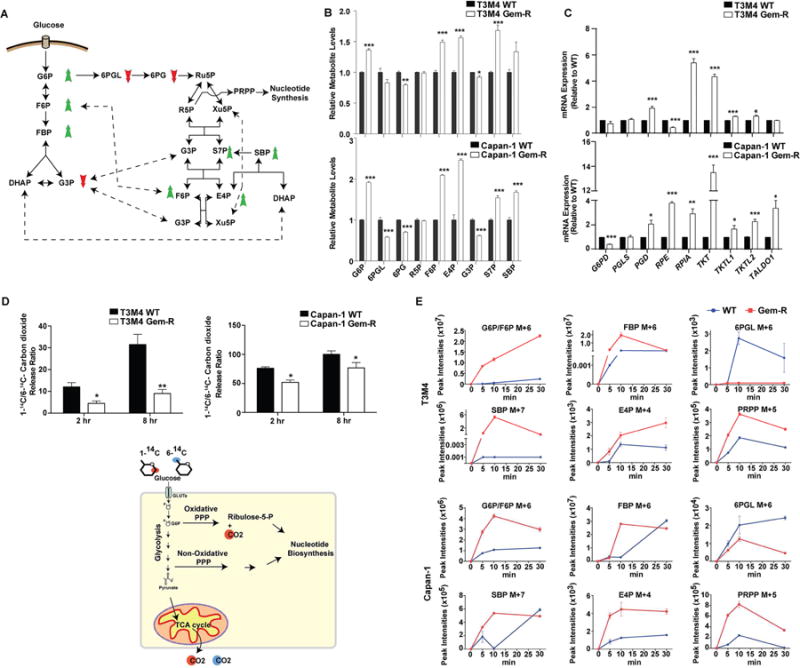
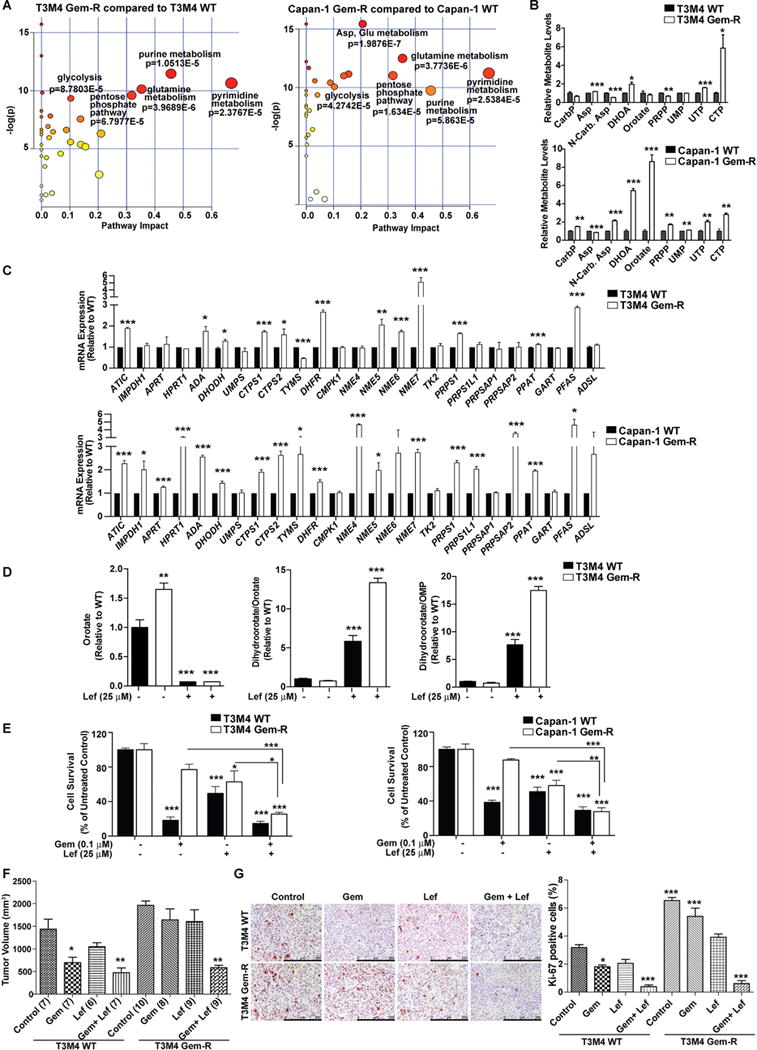
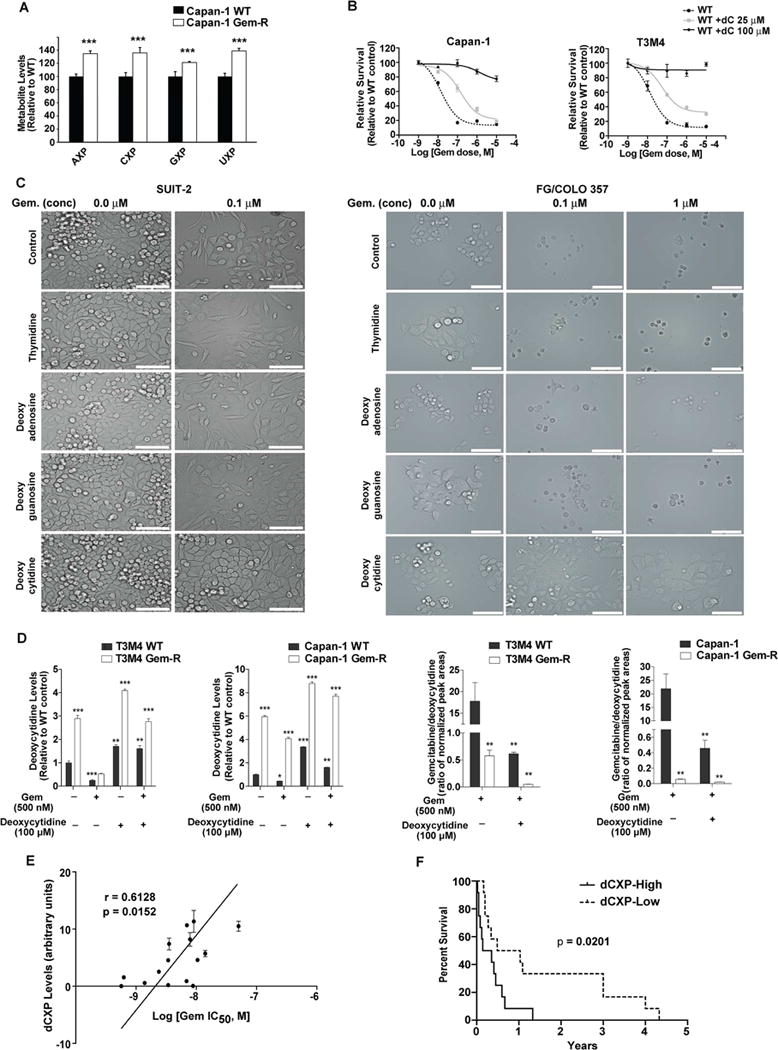
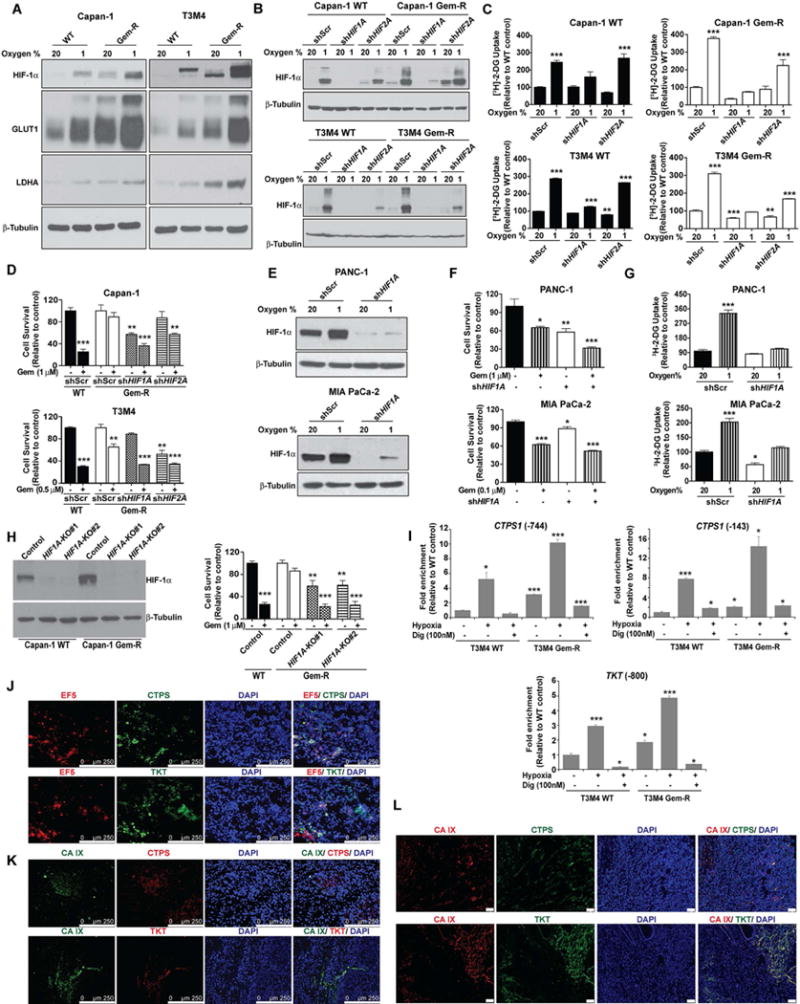
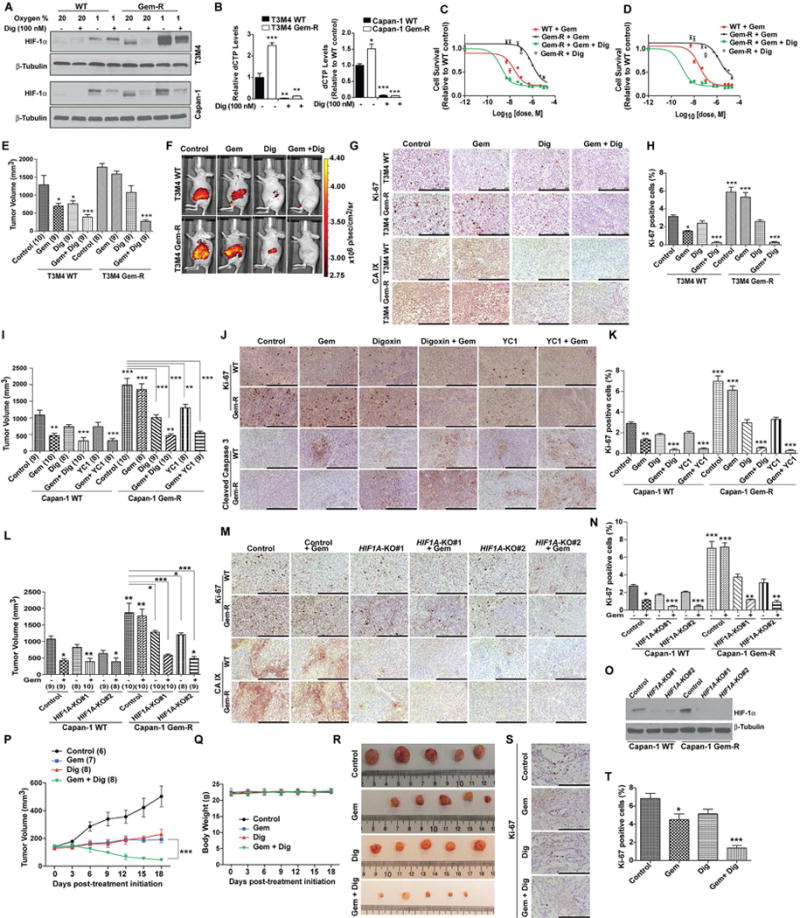
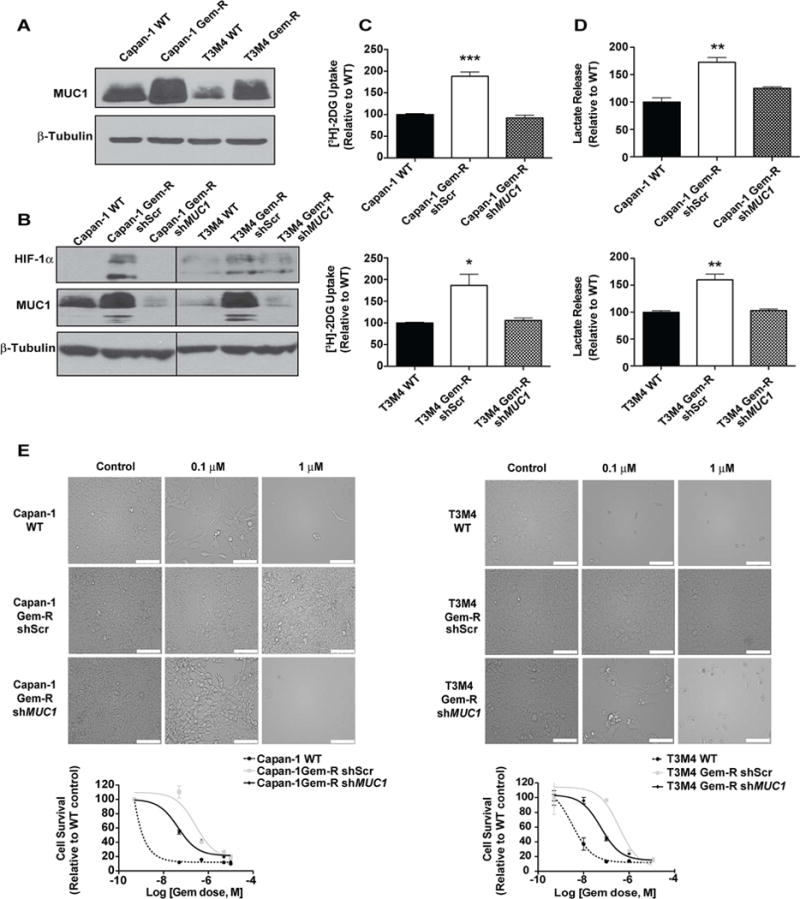
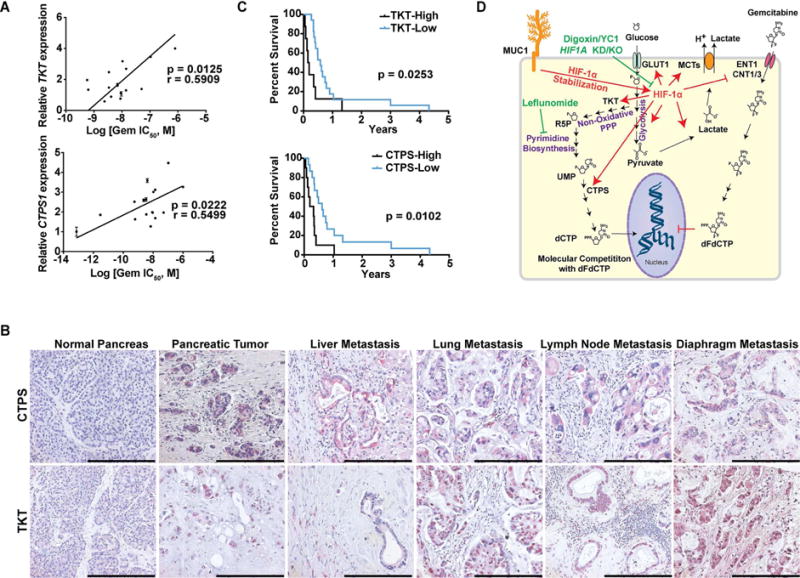
Poor response to cancer therapy due to resistance remains a clinical challenge. The present study establishes a widely prevalent mechanism of resistance to gemcitabine in pancreatic cancer, whereby increased glycolytic flux leads to glucose addiction in cancer cells and a corresponding increase in pyrimidine biosynthesis to enhance the intrinsic levels of deoxycytidine triphosphate (dCTP). Increased levels of dCTP diminish the effective levels of gemcitabine through molecular competition. We also demonstrate that MUC1-regulated stabilization of hypoxia inducible factor-1α (HIF-1α) mediates such metabolic reprogramming. Targeting HIF-1α or de novo pyrimidine biosynthesis, in combination with gemcitabine, strongly diminishes tumor burden. Finally, reduced expression of TKT and CTPS, which regulate flux into pyrimidine biosynthesis, correlates with better prognosis in pancreatic cancer patients on fluoropyrimidine analogs.

Keywords: HIF-1α; MUC1; cancer metabolism; chemotherapy resistance; gemcitabine; mucin; non-oxidative pentose phosphate pathway; nucleotide synthesis; pancreatic cancer; pyrimidine biosynthesis.


Conflict of interest statement

COMPETING INTERESTS: The authors have declared that no competing interests exist.

Figures

Figure 1
Figure 1. Increased glucose metabolism fuels gemcitabine resistance in Gem-R pancreatic cells
(A) Acquired gemcitabine resistant (Gem-R) Capan-1, and T3M4 pancreatic cancer cells were generated by exposing the corresponding wild-types (WT) to an increasing concentration of gemcitabine over 6 months. The resistance status was confirmed by performing MTT assays at each step. Red and blue colors of cells in the illustration denote sensitivity (or cell death) and resistance (or cell survival), respectively, based of response to gemcitabine treatment for 72 hr. (B) Relative sensitivity of WT as compared to the Gem-R pancreatic cancer cells as determined by MTT cytotoxicity assays. Cells were treated with increasing concentration of gemcitabine and MTT assays were performed 72 hr after treatment. (C) Relative glucose uptake in Gem-R and WT cells cultured under normoxia or hypoxia (1% oxygen). Counts for each group were normalized to the cell count in the respective group and plotted as a percent of WT control. (D) Relative lactate release from Gem-R vs. WT cells as determined by colorimetric analysis. Raw values were normalized to cell counts and plotted as percent of WT control. (E) qPCR analysis for glycolytic genes in Gem-R cells relative to WT cells. (F) Unsupervised hierarchical clustering of significantly deregulated metabolites between cells lines, in Capan-1 WT and Gem-R cells. (G) Major metabolites altered in the glycolytic pathway in Gem-R cells as compared to the WT cells. (H) Effect of glucose deprivation on the growth of WT and Gem-R cells. Cells were cultured in normal and low glucose (0.5 mM) conditions for 36 hr with or without gemcitabine followed by MTT assays. Relative survival is plotted as percent of WT or Gem-R cells cultured in normal glucose. (I–J) WT and Gem-R cells were seeded in 24-well plates and exposed to 2,4-DNP, 2-DG and rotenone to measure ECAR (I) and OCR (J). (K) Relative gemcitabine sensitivity of Capan-1 Gem-R cells FACS-sorted for low GLUT1 expression, as compared to unsorted WT and Gem-R controls as determined by MTT assay values. Cell were treated with gemcitabine for 72 hr. (L) Representative coronal (left) and axial (right) images of [18F]FDG uptake by PET imaging in WT and Gem-R orthotopic implantation models (n=6 mice per group). Normalized uptake values (NUV) fold change for xenografts examined by FDG-PET are presented in the graph on the right. Uptake values were normalized with tumor volume. (M) Kaplan-Meier progression-free survival analysis of PDAC patients on gemcitabine/5-FU chemotherapy with high (SUVmax ≥ 6; n=14) or low (SUVmax < 6; n=11) [18F]FDG-PET signal. For all in vitro studies n=3. Data are represented as mean ± SEM. The bar charts in panels C, D, E, G, and L were compared by Student’s t-test. Data in panels H and K were compared by one-way ANOVA followed by Tukey’s post hoc test. Survival in panel M was compared by Log-rank (Mantel-Cox) test. *p < 0.05, **p < 0.01, and ***p < 0.001 as compared to WT. See also Figure S1 and Table S1.
Figure 2
Figure 2. Increased flux of glucose carbon through the non-oxidative pentose phosphate pathway in Gem-R pancreatic cells
(A) Summary of altered metabolites in Gem-R vs. WT cells. An increase in metabolite levels is indicated with a green upward arrow and a reduction is indicated with a red downward arrow. (B) The PPP metabolite levels in Gem-R relative to WT cells based on targeted LC-MS/MS metabolomics. (C) Relative expression of the PPP genes in Gem-R vs. WT cells determined by qPCR analysis. (D) Radiolabeled CO2 released from 1-14C or 6-14C glucose labeling in Gem-R vs. WT cells. Raw scintillation counts were plotted as a ratio of 1-14C/6-14C-labeled carbon dioxide released at the indicated time points. Below is a schematic illustration of labeled carbon dioxide release generated from 14C-labeled glucose at C1 or C6 positions. (E) Kinetics of incorporation of 13C label from U-13C glucose into PPP metabolites in WT and Gem-R cells, as identified by LC-MS/MS analysis. M+X represents the number of 13C labeled carbon atoms in each metabolite, presented in arbitrary peak intensity units. For all in vitro studies n=3 per sample. Data are represented as mean ± SEM. The bar charts in panels B and C were compared by Student’s t-test. *p < 0.05, **p < 0.01, and ***p < 0.001. G6P: Glucose 6-phosphate; F6P: Fructose 6-phosphate; FBP: Fructose 1,6-bisphosphate; DHAP: dihydroxyacetone phosphate; G3P: glyceraldehyde 3-phosphate; 6PGL: 6-Phosphogluconolactone; 6PG: 6-Phosphogluconate; Ru5P: Ribulose 5-phosphate; R5P: Ribose 5-phosphate; Xu5P: Xylulose 5-phosphate; PRPP: Phosphoribosyl pyrophosphate; S7P: Sedoheptulose 7-phosphate; SBP: Sedoheptulose 1,7-bisphosphate; E4P: Erythrose 4-phosphate. See also Figure S2.
Figure 3
Figure 3. Gem-R cells have higher de novo pyrimidine biosynthesis in vitro and in vivo
(A) Metabolic pathway impact analysis of significantly upregulated metabolites by Metaboanalyst 3.0 in Gem-R as compared to WT cells. (B) Levels of metabolites of de novo pyrimidine synthesis pathway in Gem-R cells relative to WT cells as determined by LC-MS/MS-based metabolomics. (C) Relative mRNA expression levels of genes in the pyrimidine and the purine synthesis pathways analyzed by qPCR. Data analyzed by Student’s t-test and plotted relative to expression levels in WT cells. (D) Levels of orotate and the ratios of dihydroorotate/orotate and dihydroorotate/Orotidine 5′-monophosphate (OMP) in WT and Gem-R cells in the presence or absence of leflunomide relative to untreated WT cells. Data were analyzed by one-way ANOVA, followed by Bonferroni’s post hoc test. (E) Relative survival of Gem-R and WT cells by MTT assays, under treatment with gemcitabine, leflunomide, or gemcitabine with leflunomide. Data is presented relative to respective untreated shScr controls for WT and Gem-R cells. Comparisons made to the respective controls or indicated groups by two-way ANOVA, followed by Bonferroni’s post hoc test. (F) Tumor volumes upon necropsy, after three weeks of treatment, in orthotopically implanted mice subjected to treatments with control, gemcitabine (Gem), leflunomide (Lef) or gemcitabine with leflunomide (Gem + Lef). Numbers in parentheses indicate the number of mice in each cohort. All the groups were compared to the control WT cohort by one-way ANOVA and Dunnett’s post hoc test. (G) IHC staining for Ki-67 and quantification of percent positive cells in the formalin-fixed tumor sections from the indicated treatment groups. Scale bars: 250 μm. Ki-67 positive and negative cells were counted manually in ten fields of 5 tumors of each group. All the groups were compared to the control WT cohort by one-way ANOVA and Tukey’s post hoc test. For all in vitro studies n=3 per sample. Data are represented as mean ± SEM. *p < 0.05, **p < 0.01, and ***p < 0.001. CarP: Carbamoyl phosphate; Asp: L-Aspartate; N-Carb. Asp: N-carbamoyl-L-aspartate; DHOA: 4,5-Dihydrooratate; PRPP: Phosphoribosyl pyrophosphate; UMP: Uridine 5′-monophosphate; UTP: Uridine 5′-triphosphate; CTP: Cytidine 5′-triphosphate. See also Figure S3 and Table S2.
Figure 4
Figure 4. Increased deoxycytidine reduces the efficacy of gemcitabine
(A) NMR-based metabolite detection for nucleosides in Capan-1 Gem-R vs. WT cells. X indicates the number of phosphate groups and can be mono, di or triphosphates. Levels in Gem-R cells are presented relative to the WT control and analyzed by Student’s t-test. (B) Effect of deoxycytidine (dC) on gemcitabine sensitivity in WT cells by MTT assays at 72 hr post-treatment. (C) Bright-field images of SUIT-2 and FG/Colo357 cells treated with gemcitabine and different nucleosides (100 μ M) for 72 hr. Scale bars: 100 μm (D) Relative deoxycytidine levels and gemcitabine/deoxycytidine ratios as determined by LC-MS/MS in WT and Gem-R cells under treatment with gemcitabine and/or deoxycytidine. compared to untreated WT cells. Data was analyzed by one-way ANOVA and Bonferroni’s post hoc test. (E) Correlation of dCXP levels versus the IC50 of gemcitabine in 15 pancreatic cancer cell lines. ‘r’ depicts Pearson correlation value and p values denote significance of correlation. (F) Kaplan-Meier progression-free survival analysis of PDAC patients on gemcitabine/5-FU chemotherapy with high (above median; n=12) or low (below median; n=12) dCXP levels, as determined by LC-MS/MS in human pancreatic tumors. Data was compared with log-rank (Mantel-Cox) test. For all in vitro studies n=3 per sample. Data are represented as mean ± SEM. *p < 0.05, **p < 0.01, and ***p < 0.001 as compared to WT controls. See also Figure S4 and Table S1.
Figure 5
Figure 5. HIF-1α regulates the metabolic phenotype and gemcitabine resistance in pancreatic cancer
(A) Expression of HIF-1α and HIF-1α-dependent gene products in WT vs. Gem-R cells. Cells were cultured under normoxia (20% oxygen) or hypoxia (1% oxygen) for 12 hr and the lysates were utilized for immunoblotting to determine the levels of HIF-1α, GLUT1 and LDHA. β-tubulin was used as a loading control. (B) WT and Gem-R cells were stably knocked down for HIF1A or HIF2A using shRNA. A scrambled shRNA (shScr) was used as a control. Knockdown status of HIF-1α was confirmed by immunoblotting lysates from cells cultured under normoxia and hypoxia for 6 hr, using β-tubulin as a loading control. (C) Glucose uptake in WT and Gem-R cells as measured by [3H]-2DG labeling. Scrambled control (shScr), shHIF1A or shHIF2A cells in each group were cultured under normoxia or hypoxia (1% oxygen) for 12 hr. Raw scintillation values were normalized to cell counts and depicted as percent of shScr WT/Gem-R controls. (D) Gemcitabine responsiveness in shScr, shHIF1A or shHIF2A Gem-R cells as compared to the shScr WT cells. Cells were treated with gemcitabine for 72 hr, followed by MTT assays. Data is presented relative to respective untreated shScr controls for WT and Gem-R cells. (E) PANC-1 and MIA PaCa-2 pancreatic cancer cells were assessed for knockdown of HIF1A by immunoblotting lysates from cells under normoxic and hypoxic conditions. (F) Effect of HIF1A-knockdown on cell survival under gemcitabine-treated or untreated conditions for 72 hr as determined by MTT assays. (G) Glucose uptake in shScr and shHIF1A cells as measured by [3H]-2DG labeling. Cells in each group were cultured under normoxia or hypoxia (1% oxygen) for 12 hr. Raw scintillation values were normalized to cell counts and are plotted as percent of normoxic shScr cells. (H) Evaluation of HIF-1α expression upon CRISPR/Cas9-mediated knockout of HIF1A (with two independent target regions of HIF1A i.e. KO#1 and KO#2) in Capan-1 WT and Gem-R cells by western blotting (left). β-tubulin was used as a loading control. Evaluation of the effect of HIF1A knockout on gemcitabine responsiveness by MTT assays in Capan-1 WT and Gem-R cells after 72 hr treatment (right). Data is presented relative to respective untreated controls for WT and Gem-R cells. (I) Occupancy of CTPS1 and TKT promoters by HIF-1α was assessed by ChIP using anti-HIF-1α Ab or IgG control, followed by qPCR analysis. Occupancy of HIF-1α at proximal (−143) and distal (−744) CTPS1 promoter regions and TKT promoter region from T3M4 WT and T3M4 Gem-R cells under normoxic and hypoxic conditions (6 hr) is presented as relative to that in T3M4 WT cells under normoxic conditions. (J) Colocalization of CTPS and TKT with 2-nitroimidazole (EF5; a hypoxia probe) in tumor sections from orthotopically implanted Capan-1 cells by immunofluorescence microscopy. Tumors were collected after four weeks of implantation. Scale bars: 250 μm. (K) Colocalization of CTPS and TKT with CA IX in tumor sections from orthotopically implanted Capan-1 cells by immunofluorescence microscopy. Tumors were collected after four weeks of implantation. Scale bars: 250 μm. (L) Colocalization of CTPS and TKT with CA IX in primary tumor sections from human pancreatic cancer patients. Scale bars: 50 μm. For all in vitro studies n=3 per sample. Data in bar charts were compared to the controls by one-way ANOVA with Tukey’s post hoc analysis and are represented as mean ± SEM. *p < 0.05, **p < 0.01, and ***p < 0.001. See also Figure S4.
Figure 6
Figure 6. Pharmacological inhibition of HIF-1α improves gemcitabine sensitivity
(A) Immunoblotting for HIF-1α in T3M4 and Capan-1 WT and Gem-R cells cultured under normoxia or hypoxia (for 12 hr), treated with and without digoxin (Dig) for 12 hr. (B) The dCTP levels relative to control WT cells, under treatment with solvent control or digoxin, as determined by LC-MS/MS. Values are presented relative to solvent control treated WT cells. (C–D) Effect of digoxin treatment (100 nM) on gemcitabine responsiveness of T3M4 (C) and Capan-1 (D) Gem-R cells as determined by MTT assays, 72 hr after treatment with digoxin, a range of doses of gemcitabine, or both. Effect of digoxin alone on Gem-R cell survival, relative to DMSO-treated controls, is indicated by a single open diamond symbol. (E–K) Effect of digoxin and YC1 on gemcitabine responsiveness in orthotopically implanted T3M4 (E–H) and Capan-1 (I–K) WT and Gem-R tumor models. Tumor volumes upon necropsy (after three weeks of treatment) in orthotopically implanted mice subjected to treatments with control, gemcitabine alone (50 mg/kg, biweekly), digoxin (2 mg/kg, daily) or YC1 (15 mg/kg, daily) alone or gemcitabine with digoxin or YC1 (E and I). In vivo glucose uptake in tumor-bearing mice was determined three weeks after implantation; the mice were injected intraperitoneally with 100 μl of 10 nmoles RediJect 2DG 750 probe and imaged 3 hr later (F). IHC staining for Ki-67 and CA IX or cleaved caspase 3 (G and J) and Ki-67 staining quantitation (H and K) in the formalin-fixed tumor sections from the indicated treatment groups. (L-O) Effect of CRISPR/Cas9-mediated HIF1A knockout (with two independent target regions of HIF1A i.e. KO#1 and KO#2) on gemcitabine responsiveness in orthotopically implanted Capan-1 WT and Gem-R tumor models. Tumor volumes upon necropsy, after three weeks of treatment, in orthotopically implanted mice subjected to treatments with control or gemcitabine (L). IHC staining for Ki-67 and CA IX (M) and Ki-67 staining quantitation (N) in the formalin-fixed tumor sections from the indicated treatment groups. Evaluation of HIF1A knockout status by western blotting in tumor extracts (O). (P–T) Effect of digoxin on gemcitabine responsiveness in a patient-derived xenograft model. Tumor volumes measured by calipers at indicated time points in tumor-implanted mice subjected to treatments with control, gemcitabine alone (50 mg/kg, biweekly), digoxin (2 mg/kg, daily) or gemcitabine with digoxin. Tumor volumes were quantified by caliper measurements and statistically compared by two-way ANOVA analysis with Bonferroni’s post hoc test; p value presented indicates comparison of tumor volumes in gemcitabine and digoxin treated mice at day 18 post-implantation with that of mice treated with gemcitabine alone (P). Body weights of mice with the indicated treatments (Q). Representative tumor images upon necropsy (R). IHC staining for Ki-67 (S) and Ki-67 staining quantitation (T). Ki-67 positive and negative cells were counted manually in ten fields of 5 tumors of each group. Numbers in parentheses indicate the number of mice in each cohort. For all in vitro studies n=3 per sample. Data are represented as mean ± SEM. All cohorts in bar charts were compared to the respective controls by one-way ANOVA with Tukey’s post hoc analysis. *p < 0.05, **p < 0.01, and ***p < 0.001. Scale bars: 250 μm. See also Figure S5.
Figure 7
Figure 7. Knocking down MUC1 abrogates HIF-1α levels and increases gemcitabine sensitivity in Gem-R cells
(A) Relative MUC1 expression in Gem-R vs. WT cells as determined by immunoblotting. (B) MUC1 and HIF-1α protein levels in WT, Gem-R and MUC1 knockdown Gem-R cells, as determined by immunoblotting. β-tubulin was used as a loading control. (C) Relative glucose uptake determined by [3H]-2DG uptake assays in MUC1 knockdown Gem-R as compared to scrambled controls of Gem-R and WT cells. Raw scintillation values were normalized to cell counts and depicted as percent of shScr WT controls. (D) Relative lactate release from shScr WT, shScr Gem-R and MUC1 knockdown Gem-R cells. Raw values were normalized to cell counts and plotted as percent of shScr WT controls. (E) Effect of MUC1 knockdown on gemcitabine sensitivity in Gem-R vs. WT cells as denoted by pictomicrographs and survival curves. Scale bars: 100 μm. Cell survival was measured by MTT assay after 72 hr gemcitabine treatment. Data in bar charts were compared by one-way ANOVA with Tukey’s post hoc analysis. For all in vitro studies, n=3 per sample. Data are represented as mean ± SEM. *p < 0.05, **p < 0.01, and ***p < 0.001.
Figure 8
Figure 8. Reduced CTPS and TKT levels correlate with increased survival in human pancreatic cancer patients
(A) Correlation of TKT and CTPS1 expression levels versus the IC50 of gemcitabine in 17 pancreatic cancer cell lines. ‘r’ depicts Pearson correlation value, and p values denote significance of correlation. (B) IHC staining of TKT and CTPS in formalin-fixed paraffin-embedded sections obtained from normal human pancreas, PDAC and metastatic lesions. Scale bars: 250 μm (C) Kaplan-Meier progression-free survival analysis of PDAC patients on gemcitabine/5-FU chemotherapy with high (above a composite score of 9; n=8 for TKT, n=10 for CTPS) or low (below a composite score of 9; n=17 for TKT, n= 15 for CTPS) TKT or CTPS expression levels based on IHC in pancreatic tumors. Comparisons were made by log-rank (Mantel-Cox) test and p values denote significance of alterations in survival in TKT or CTPS high- vs. low-expressing population. (D) Graphical summary for the metabolic basis of gemcitabine resistance in pancreatic cancer. Gemcitabine resistant cells demonstrate increased HIF–1α-mediated glucose uptake and, resultantly, increased flux of glucose through the PPP and pyrimidine biosynthesis to generate dCTP. Inhibition of HIF-1α or pyrimidine biosynthesis increases gemcitabine sensitivity in pancreatic cancer cells. R5P: Ribose-5-Phosphate; UMP: Uridine 5′-monophosphate; dCTP: Deoxycytidine 5′-triphosphate; dFdCTP: 2′,2′-Difluorodeoxycytidine 5′-triphosphate or Gemcitabine 5′-triphosphate. See also Table S1.

Comment in

References

    1. Akiyama K, Chikayama E, Yuasa H, Shimada Y, Tohge T, Shinozaki K, Hirai MY, Sakurai T, Kikuchi J, Saito K. PRIMe: a Web site that assembles tools for metabolomics and transcriptomics. In silico biology. 2008;8:339–345. - PubMed
    1. Behrens ME, Grandgenett PM, Bailey JM, Singh PK, Yi CH, Yu F, Hollingsworth MA. The reactive tumor microenvironment: MUC1 signaling directly reprograms transcription of CTGF. Oncogene. 2010;29:5667–5677. - PMC - PubMed
    1. Burris H, Storniolo AM. Assessing clinical benefit in the treatment of pancreas cancer: gemcitabine compared to 5-fluorouracil. Eur J Cancer. 1997;33(Suppl 1):S18–22. - PubMed
    1. Chaika NV, Gebregiworgis T, Lewallen ME, Purohit V, Radhakrishnan P, Liu X, Zhang B, Mehla K, Brown RB, Caffrey T, et al. MUC1 mucin stabilizes and activates hypoxia-inducible factor 1 alpha to regulate metabolism in pancreatic cancer. Proc Natl Acad Sci U S A. 2012a;109:13787–13792. - PMC - PubMed
    1. Chaika NV, Yu F, Purohit V, Mehla K, Lazenby AJ, DiMaio D, Anderson JM, Yeh JJ, Johnson KR, Hollingsworth MA, Singh PK. Differential expression of metabolic genes in tumor and stromal components of primary and metastatic loci in pancreatic adenocarcinoma. PLoS One. 2012b;7:e32996. - PMC - PubMed

Publication types

MeSH terms