. 2017 Sep 19;136(12):1140-1154.
doi: 10.1161/CIRCULATIONAHA.117.027844. Epub 2017 Jul 11.

Interferon Regulatory Factor 5 Controls Necrotic Core Formation in Atherosclerotic Lesions by Impairing Efferocytosis

Affiliations

Interferon Regulatory Factor 5 Controls Necrotic Core Formation in Atherosclerotic Lesions by Impairing Efferocytosis

Anusha N Seneviratne et al. Circulation. .

Abstract

Background: Myeloid cells are central to atherosclerotic lesion development and vulnerable plaque formation. Impaired ability of arterial phagocytes to uptake apoptotic cells (efferocytosis) promotes lesion growth and establishment of a necrotic core. The transcription factor interferon regulatory factor (IRF)-5 is an important modulator of myeloid function and programming. We sought to investigate whether IRF5 affects the formation and phenotype of atherosclerotic lesions.

Methods: We investigated the role of IRF5 in atherosclerosis in 2 complementary models. First, atherosclerotic lesion development in hyperlipidemic apolipoprotein E-deficient (ApoE-/-) mice and ApoE-/- mice with a genetic deletion of IRF5 (ApoE-/-Irf5-/-) was compared and then lesion development was assessed in a model of shear stress-modulated vulnerable plaque formation.

Results: Both lesion and necrotic core size were significantly reduced in ApoE-/-Irf5-/- mice compared with IRF5-competent ApoE-/- mice. Necrotic core size was also reduced in the model of shear stress-modulated vulnerable plaque formation. A significant loss of CD11c+ macrophages was evident in ApoE-/-Irf5-/- mice in the aorta, draining lymph nodes, and bone marrow cell cultures, indicating that IRF5 maintains CD11c+ macrophages in atherosclerosis. Moreover, we revealed that the CD11c gene is a direct target of IRF5 in macrophages. In the absence of IRF5, CD11c- macrophages displayed a significant increase in expression of the efferocytosis-regulating integrin-β3 and its ligand milk fat globule-epidermal growth factor 8 protein and enhanced efferocytosis in vitro and in situ.

Conclusions: IRF5 is detrimental in atherosclerosis by promoting the maintenance of proinflammatory CD11c+ macrophages within lesions and controlling the expansion of the necrotic core by impairing efferocytosis.

Keywords: CD11c; IRF5; atherosclerosis; efferocytosis; macrophages.


Figures

Figure 1.
Figure 1.
IRF5 deficiency decreases lesion and necrotic core size in the aortic root of ApoE-/- mice. Representative images of aortic root sections from ApoE-/- and ApoE-/-Irf5-/- mice 15, 20, or 27 weeks of age stained with Oil Red O and hematoxylin for lesion area (A). Graphs show cross-sectional aortic root lesion area (x103 μm2 and %) (B) hematoxylin and eosin for necrotic core delineation. Graphs show aortic root lesional necrotic core area (defined as anuclear, afibrotic, and eosin-negative areas) (x103 μm2 and %). Dotted lines show necrotic core area. Each circle represents the mean area per individual mouse. Horizontal line denotes group median (n=9 to 10). Bars=100μm. ApoE indicates apolipoprotein E-deficient; and IRF, interferon regulatory factor. *P<0.05; **P<0.01; ***P<0.001.
Figure 2.
Figure 2.
IRF5 deficiency reduces CD11c expression in the aortic root. A, Representative photomicrographs of aortic root sections from 15-, 20-, and 27-week-old ApoE-/- and ApoE-/-Irf5-/- mice stained with an antibody against CD68 (brown staining) and hematoxylin. Graphs show aortic root lesion area staining positive (x103 μm2 and %) for CD68. B, Representative photomicrographs of aortic root sections from 15-, 20-, and 27-week-old ApoE-/- and ApoE-/-Irf5-/- mice stained with an antibody against CD11c (brown staining) and hematoxylin. Arrows highlight CD11c+ positive cells. Graphs show aortic root lesion area staining positive (x103 μm2 and %) for CD11c. C, Representative photomicrographs of aortic root sections from 15-, 20-, and 27-week-old ApoE-/- and ApoE-/-Irf5-/- mice stained with an antibody against CD206 (brown staining) and hematoxylin. Graphs show aortic root lesion area staining positive (x103 μm2 and %) for CD206 (n=9 to 10). Bars=100μm. Each circle represents the mean positive area per individual mouse. Horizontal line denotes group median. ApoE indicates apolipoprotein E-deficient; and IRF, interferon regulatory factor. *P<0.05; **P<0.01; ***P<0.001.
Figure 3.
Figure 3.
Decreased gene expression of inflammatory and myeloid cell markers in ApoE-/-Irf5-/- mice. The aortic arches and PALNs of ApoE-/- and ApoE-/-Irf5-/- mice were collected and RNA extracted. Gene expression of inflammatory and myeloid cell markers was then assessed by reverse transcription polymerase chain reaction. A and B, Graphs show gene expression of selected genes in the aortic arch of ApoE-/- (black bars) and ApoE-/-Irf5-/- mice (white bars) at 20 (A) and 27 (B) weeks of age. C, Graph shows gene expression of selected genes in the PALN of ApoE-/- (black bars) and ApoE-/-Irf5-/- mice (white bars) at 20 weeks of age. Data are presented as fold change (n=8). Bars=mean+SEM. ApoE indicates apolipoprotein E-deficient; IRF, interferon regulatory factor; and PALN, para-aortic lymph nodes. **P<0.01; ***P<0.001.
Figure 4.
Figure 4.
IRF5 deficiency decreases necrotic core formation and CD11c expression in shear stress-modulated lesions. ApoE-/- (black circles) and ApoE-/-Irf5-/- mice (white circles) were placed on a high-fat diet at 17 to 18 weeks of age. After 2 weeks, a perivascular shear stress-altering cast was surgically placed around the common carotid artery and left in place for 9 weeks. A, Representative photomicrographs of carotid artery sections stained with hematoxylin and eosin. Graphs show lesional necrotic core area (defined as anuclear, afibrotic, and eosin-negative areas) (x1000 μm2 and %). Solid lines show necrotic core area. B, Representative photomicrographs of carotid sections stained with an antibody against CD68 (brown staining) and hematoxylin. Graphs show lesion area staining positive (x1000 μm2 and %) for CD68. Dotted lines denote lesion area. C, Representative photomicrographs of carotid sections stained with an antibody against CD11c (brown staining) and hematoxylin. Graphs show lesion area staining positive (x1000 μm2 and %) for CD11c. Dotted lines denote lesion area. D, Representative photomicrographs of carotid sections with an antibody against smooth muscle cell α-actin (ASMA) (Cy3-red). Graphs show aortic root lesion area staining positive (x1000 μm2 and %) for ASMA. Dotted lines denote lumen. Bars=100μm in A through C and 80 μm in D (n=8). Each circle represents the mean positive area per individual mouse. Horizontal line denotes group median. ApoE indicates apolipoprotein E-deficient; IRF, interferon regulatory factor; and SMC, smooth muscle cell. *P<0.05; **P<0.01; ***P<0.001.
Figure 5.
Figure 5.
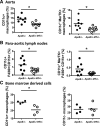
IRF5 affects myeloid cell phenotype in the aorta, para-aortic lymph nodes, and in vitro bone marrow cultures. Aortas, PALNs, and bones were harvested from 20- to 24-week-old ApoE-/- and ApoE-/-Irf5-/- mice. Single-cell suspensions were then stained with antibodies against myeloid cell markers and analyzed by flow cytometry. Dead cells and debris were excluded from the analysis, and cells were gated on CD45+ cells. A, Graphs show the numbers of aortic CD11c+ macrophages (gated as CD45+CD11b+F4/80+cells or as CD45+CD11b+F4/80+MerTK+), expressed as a percentage of CD45+ cells (n=8). B, Graphs show the numbers of CD11c+ macrophages in the PALNs, expressed as a percentage of CD45+ cells (n=8). C, Graphs show the numbers of CD11c+- and CD11c- expressing macrophages in GM-CSF-derived macrophage cultures in vitro, expressed as a percentage of CD45+ cells (n=4). Each circle represents an individual mouse. Horizontal line denotes group mean. ApoE indicates apolipoprotein E-deficient; IRF, interferon regulatory factor; MerTK, tyrosine-protein kinase Mer; and PALN, para-aortic lymph nodes. *P<0.05.
Figure 6.
Figure 6.
IRF5 regulates CD11c expression. A, Chromatin immunoprecipitation and next-generation sequencing (ChIP-seq) of IRF5 binding sites from unstimulated and LPS-stimulated GM-CSF bone marrow-derived cells revealed specific binding of the transcription factor to the promoter region of ITGAX in GM-CSF-cultured bone marrow-derived macrophages. Notably, the binding of IRF5 to the ITGAX gene loci is dependent on LPS stimulation, with recruitment of IRF5, as detected by peak calling with MACS2, occurring in stimulated macrophages but not in untreated cells. B, Graph shows the fold change of CD11c gene expression in unstimulated or LPS-stimulated GM-CSF bone marrow-derived cells from ApoE-/- (black bars) or ApoE-/-Irf5-/- (white bars) mice. CD11c gene expression is downregulated in GM-CSF-matured bone marrow-derived macrophages from IRF5-deficient mice upon LPS stimulation (n=6 to 10). Data are presented as mean±SEM. ApoE indicates apolipoprotein E-deficient; GM-CSF, granulocyte-macrophage colony-stimulating factor; IRF, interferon regulatory factor; Itgb3, integrin-β3; and LPS, lipopolysaccharide. *P<0.05.
Figure 7.
Figure 7.
IRF5 deficiency reduces cellular apoptosis and increases efferocytosis. Bone marrow cells from ApoE-/- (black bars) and ApoE-/-Irf5-/- (white bars) mice 16 to 20 weeks of age were cultured in GM-CSF for 7 days, and their ability to undergo apoptosis and to perform efferocytosis was assessed. A, Graph shows percentage of CD11c+ and CD11c- cells staining positive for propidium iodide and Annexin V after LPS stimulation and ultraviolet light exposure (n=8). B, Graph shows percentage of apoptotic Jurkat cell uptake by CD11c+ and CD11c- macrophages (n=8). C, Representative images of perivascular flow-modifying cast-induced carotid lesions in ApoE-/- and ApoE-/-Irf5-/- mice stained with an antibody against CD68 (red) and TUNEL stained (green) and DNA (blue). Graphs show number of apoptotic cells (left) and percentage (right) of apoptotic cells undergoing efferocytosis in situ (n=4 to 5). Data are presented as mean±SEM. Black bars, ApoE-/-.. White bars, ApoE-/-Irf5-/-. ApoE indicates apolipoprotein E-deficient; and IRF, interferon regulatory factor. *P<0.05; **P<0.01; ***P<0.001.
Figure 8.
Figure 8.
IRF5 deficiency increases efferocytosis by CD11c- cells by an upregulation of Itgb3 and Mfge8. A, Gene expression (shown as fold change) of efferocytosis regulating receptors (Itgb3, MerTK, Axl, and Tyro3) and efferocytosis-regulating bridging molecules (Mfge8, Gas6, and Protein S) in GM-CSF-matured macrophage cell cultures from ApoE-/- (black bars) and ApoE-/-Irf5-/- (white bars) mice 16 to 20 weeks of age (n=6 to 8). Data presented as median and IQR. B, Gene expression (shown as fold change) of efferocytosis-regulating receptors (Itgb3, MerTK, Tyro3, CD36, and CD14) and receptor ligands (Mfge8, Gas6, and Protein S) in the aorta of 20-week-old ApoE-/- and ApoE-/-Irf5-/- mice (n=5 to 8). Data presented as median and IQR. C, CD11c- GM-CSF-matured macrophages from ApoE-/- and ApoE-/-Irf5-/- mice were stained with an antibody against Itgb3. Representative plots show Itgb3 expression on CD11c- cells and graphs show numbers (left) of CD11c− cells expressing Itgb3 and the median fluorescent intensity (MFI) of Itgb3 staining (right) (n=6). Horizontal bars denote group median. D, Bone marrow-derived cells from ApoE-/- and ApoE-/-Irf5-/- mice were cultured in GM-CSF for 7 days, and Mfge8 released into the supernatant was assessed by ELISA (n=8). Data are presented as median and IQR. E, Gene expression level (fold change) of Itgb3 (left) and Mfge8 (right) in GM-CSF-matured macrophages from ApoE-/- (black bars) and ApoE-/-Irf5-/- (white bars) mice after transfection with siRNA against Itgb3, Mfge8, or a control siRNA. Graphs show mean and SEM (n=3). F, Histogram overlay of Itgb3 protein expression, as assessed by flow cytometry, on GM-CSF-matured macrophages after transfection with siRNA against Itgb3 (red) or control (blue). G, Percentage of apoptotic Jurkat cell uptake by GM-CSF-cultured macrophages from ApoE-/- (black bars) and ApoE-/-Irf5-/- (white bars) mice after transfection with siRNA against Itgb3, Mfge8, or a control siRNA. Graphs show mean and SEM (n=4). ApoE indicates apolipoprotein E-deficient; Ctrl, control; GM-CSF, granulocyte-macrophage colony-stimulating factor; IRF, interferon regulatory factor; Itgb3, integrin-β3; MerTK, tyrosine-protein kinase Mer; and Mfge8, milk fat globule-epidermal growth factor 8 protein. *P<0.05; **P<0.01; ***P<0.001.

References

    1. Lozano R, Naghavi M, Foreman K, Lim S, Shibuya K, Aboyans V, Abraham J, Adair T, Aggarwal R, Ahn SY, Alvarado M, Anderson HR, Anderson LM, Andrews KG, Atkinson C, Baddour LM, Barker-Collo S, Bartels DH, Bell ML, Benjamin EJ, Bennett D, Bhalla K, Bikbov B, Bin Abdulhak A, Birbeck G, Blyth F, Bolliger I, Boufous S, Bucello C, Burch M, Burney P, Carapetis J, Chen H, Chou D, Chugh SS, Coffeng LE, Colan SD, Colquhoun S, Colson KE, Condon J, Connor MD, Cooper LT, Corriere M, Cortinovis M, de Vaccaro KC, Couser W, Cowie BC, Criqui MH, Cross M, Dabhadkar KC, Dahodwala N, De Leo D, Degenhardt L, Delossantos A, Denenberg J, Des Jarlais DC, Dharmaratne SD, Dorsey ER, Driscoll T, Duber H, Ebel B, Erwin PJ, Espindola P, Ezzati M, Feigin V, Flaxman AD, Forouzanfar MH, Fowkes FG, Franklin R, Fransen M, Freeman MK, Gabriel SE, Gakidou E, Gaspari F, Gillum RF, Gonzalez-Medina D, Halasa YA, Haring D, Harrison JE, Havmoeller R, Hay RJ, Hoen B, Hotez PJ, Hoy D, Jacobsen KH, James SL, Jasrasaria R, Jayaraman S, Johns N, Karthikeyan G, Kassebaum N, Keren A, Khoo JP, Knowlton LM, Kobusingye O, Koranteng A, Krishnamurthi R, Lipnick M, Lipshultz SE, Ohno SL, Mabweijano J, MacIntyre MF, Mallinger L, March L, Marks GB, Marks R, Matsumori A, Matzopoulos R, Mayosi BM, McAnulty JH, McDermott MM, McGrath J, Mensah GA, Merriman TR, Michaud C, Miller M, Miller TR, Mock C, Mocumbi AO, Mokdad AA, Moran A, Mulholland K, Nair MN, Naldi L, Narayan KM, Nasseri K, Norman P, O’Donnell M, Omer SB, Ortblad K, Osborne R, Ozgediz D, Pahari B, Pandian JD, Rivero AP, Padilla RP, Perez-Ruiz F, Perico N, Phillips D, Pierce K, Pope CA, 3rd, Porrini E, Pourmalek F, Raju M, Ranganathan D, Rehm JT, Rein DB, Remuzzi G, Rivara FP, Roberts T, De Leon FR, Rosenfeld LC, Rushton L, Sacco RL, Salomon JA, Sampson U, Sanman E, Schwebel DC, Segui-Gomez M, Shepard DS, Singh D, Singleton J, Sliwa K, Smith E, Steer A, Taylor JA, Thomas B, Tleyjeh IM, Towbin JA, Truelsen T, Undurraga EA, Venketasubramanian N, Vijayakumar L, Vos T, Wagner GR, Wang M, Wang W, Watt K, Weinstock MA, Weintraub R, Wilkinson JD, Woolf AD, Wulf S, Yeh PH, Yip P, Zabetian A, Zheng ZJ, Lopez AD, Murray CJ, AlMazroa MA, Memish ZA. Global and regional mortality from 235 causes of death for 20 age groups in 1990 and 2010: a systematic analysis for the Global Burden of Disease Study 2010. Lancet. 2012;380:2095–2128. doi: 10.1016/S0140-6736(12)61728-0. - PMC - PubMed
    1. Gu L, Okada Y, Clinton SK, Gerard C, Sukhova GK, Libby P, Rollins BJ. Absence of monocyte chemoattractant protein-1 reduces atherosclerosis in low density lipoprotein receptor-deficient mice. Mol Cell. 1998;2:275–281. - PubMed
    1. Qiao JH, Tripathi J, Mishra NK, Cai Y, Tripathi S, Wang XP, Imes S, Fishbein MC, Clinton SK, Libby P, Lusis AJ, Rajavashisth TB. Role of macrophage colony-stimulating factor in atherosclerosis: studies of osteopetrotic mice. Am J Pathol. 1997;150:1687–1699. - PMC - PubMed
    1. Chinetti-Gbaguidi G, Colin S, Staels B. Macrophage subsets in atherosclerosis. Nat Rev Cardiol. 2015;12:10–17. doi: 10.1038/nrcardio.2014.173. - PubMed
    1. Moore KJ, Tabas I. Macrophages in the pathogenesis of atherosclerosis. Cell. 2011;145:341–355. doi: 10.1016/j.cell.2011.04.005. - PMC - PubMed

MeSH terms