. 2017 Sep 1;23(17):5187-5201.
doi: 10.1158/1078-0432.CCR-17-0741. Epub 2017 Jul 11.

Entinostat Neutralizes Myeloid-Derived Suppressor Cells and Enhances the Antitumor Effect of PD-1 Inhibition in Murine Models of Lung and Renal Cell Carcinoma

Affiliations

Entinostat Neutralizes Myeloid-Derived Suppressor Cells and Enhances the Antitumor Effect of PD-1 Inhibition in Murine Models of Lung and Renal Cell Carcinoma

Ashley Orillion et al. Clin Cancer Res. .

Abstract

Purpose: Recent advances in immunotherapy highlight the antitumor effects of immune checkpoint inhibition despite a relatively limited subset of patients receiving clinical benefit. The selective class I histone deacetylase inhibitor entinostat has been reported to have immunomodulatory activity including targeting of immune suppressor cells in the tumor microenvironment. Thus, we decided to assess whether entinostat could enhance anti-PD-1 treatment and investigate those alterations in the immunosuppressive tumor microenvironment that contribute to the combined antitumor activity.

Experimental design: We utilized syngeneic mouse models of lung (LLC) and renal cell (RENCA) carcinoma and assessed immune correlates, tumor growth, and survival following treatment with entinostat (5 or 10 mg/kg, p.o.) and a PD-1 inhibitor (10 and 20 mg/kg, s.c.).

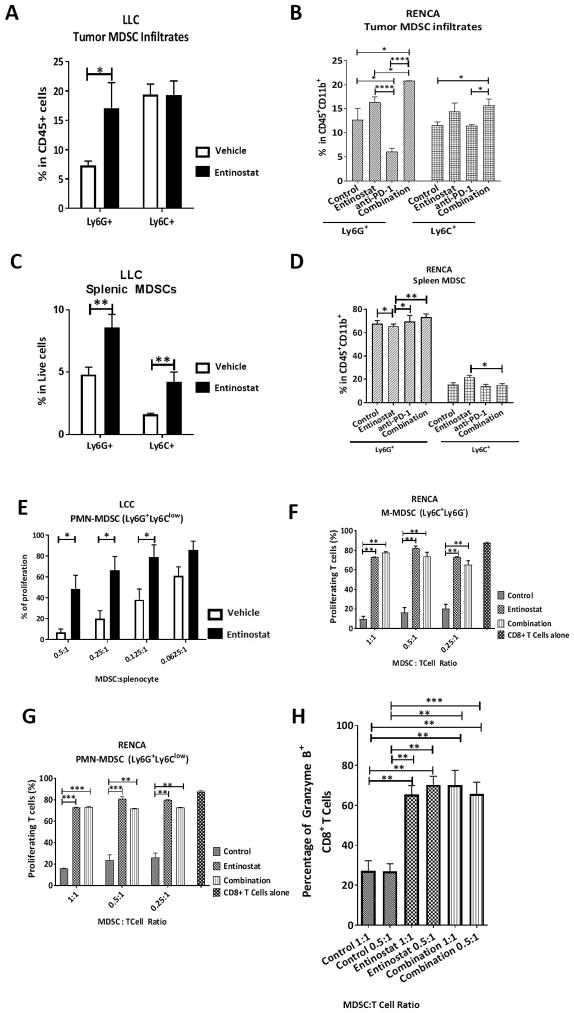
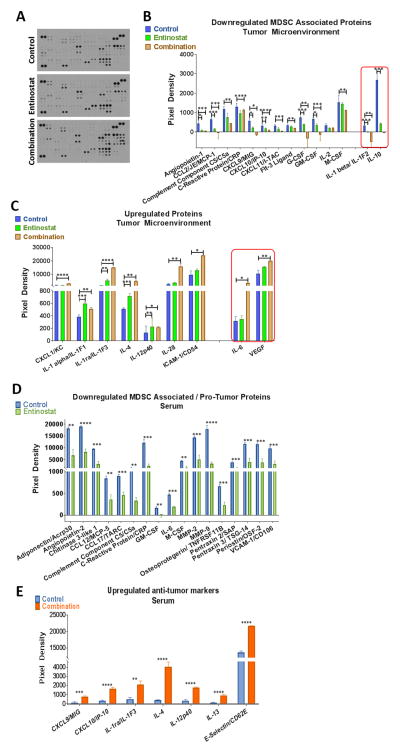
Results: Entinostat enhanced the antitumor effect of PD-1 inhibition in two syngeneic mouse tumor models by reducing tumor growth and increasing survival. Entinostat inhibited the immunosuppressive function of both polymorphonuclear (PMN)- and monocytic-myeloid derived suppressor cell (M-MDSC) populations. Analysis of MDSC response to entinostat revealed significantly reduced arginase-1, iNOS, and COX-2 levels, suggesting potential mechanisms for the altered function. We also observed significant alterations in cytokine/chemokine release in vivo with a shift toward a tumor-suppressive microenvironment.

Conclusions: Our results demonstrate that entinostat enhances the antitumor effect of PD-1 targeting through functional inhibition of MDSCs and a transition away from an immune-suppressive tumor microenvironment. These data provide a mechanistic rationale for the clinical testing and potential markers of response of this novel combination in solid tumor patients.


Conflict of interest statement

Conflict of interest: This study was supported in part by a research grant from Syndax Pharmaceuticals, Inc (D.G. and R.P.). Peter Ordentlich is an employee of Syndax Pharmaceuticals, Inc.

Figures

Figure 1
Figure 1. Entinostat improves immunotherapy in syngeneic models of mouse of renal cell and lung carcinoma
A–F RENCA model (A) Top: baseline bioluminescent imaging. Bottom: endpoint bioluminescent imaging. (B) Average Radiance [p/s/cm2/sr] of each mouse in control, entinostat, anti-PD-1, and entinostat + anti-PD-1 cohorts across the duration of the study. (C) Endpoint tumor weight in grams. (D) Survival study, with 10 mg/kg of anti-PD-1. (E) Survival study, with 20 mg/kg of anti-PD-1. Results are shown as mean ± SEM (*p < 0.05; **p < 0.01; ***p < 0.001; ****p < 0.0001). (F) The LLC tumor-bearing mice were orally treated with vehicle (1% DMSO) or entinostat solution (10 mg/kg) from Day 11 to Day 28. The mice were treated with anti-PD-1 antibody i.p. on Day 11, 14, 18 and 21. Results are indicated as mean ± SEM of n = 5 (**p < 0.01)
Figure 2
Figure 2. Entinostat modulates T cell and tumor associated macrophage response in the RENCA and LLC models
Blood and tumor samples were isolated from mice at the end of the study and processed for flow cytometry analysis. (A) Left: FACS analysis of blood shows the effect of vehicle and combination treatment on CD4 and FoxP3 levels. Right: Quantification of T regulatory cell presence in the blood and protein expression shown as mean fluorescence intensity (MFI). (B) Left: FACS analysis of tumor-cell suspensions from RENCA mice after control or entinostat treatment. Right: Quantification of T regulatory cell presence in the TME and protein expression shown as mean fluorescence intensity (MFI). (C) Quantitative FACS analysis of CD8+ T cell infiltrates into the TME. (D) Left: Quantitative FACS analysis results of tumor associate macrophage infiltration into the TME. n = 3–5 tumors/blood samples per cohort per panel. Right: LLC tumor-bearing mice were orally treated with vehicle (1% DMSO) or entinostat solution (10 mg/kg) for 2 weeks. Tumor cells were processed and analyzed by flow cytometric analysis. Results are shown as mean ± SEM (*p < 0.05; **p < 0.01; ***p < 0.001; ****p < 0.0001).
Figure 3
Figure 3. Entinostat inhibits the immunosuppressive capacity of MDSCs
(A,B) Cells with MDSC phenotype infiltrating LLC (A) (n=6–8) or RENCA tumors (n=3–5) in mice treated for 2–4 weeks with vehicle (1% DMSO) or entinostat. (C, D) Cells with MDSC phenotype in spleens of LLC tumor-bearing mice (C) or RENCA tumor-bearing mice (D). (E) LLC Ly6G+ cells were enriched by MACS separation from tumor cells and cultured with splenocytes from PMEL mice and 0.1 mg/mL of gp100 peptide for 3 days. Cell proliferation was measured in triplicate using 3H-thymidine uptake. (F) M-MDSC and (G) PMN-MDSC cells isolated from the RENCA TME were co-cultured with CFSE tagged CD8+ T cells for 16–18 hours, at which time they were collected, stained with CD8 & Granzyme B antibodies, and subjected to FACS analysis in triplicate for T cell proliferation (n = 3–5 tumors). (H) Quantitative representation of FACS analysis of cytotoxic CD8+ active protein Granzyme B from T cells which have been co-cultured with MDSCs from control, entinostat, or combination treated cohorts. Results are shown as mean ± SEM (*p < 0.05; **p < 0.01; ***p < 0.001; ****p < 0.0001).
Figure 4
Figure 4. Entinostat diminishes inhibitory capabilities of MDSC-like cells revealing molecular modifications
(A) Characteristic FACS analysis of J774M cell line (B) CFSE fluorescent histograms of gated CD8+ T cells incubated with J77M cells at a ratio of 1:1. J774M cells were treated with increasing concentrations of entinostat – from right to left: control(untreated), 0.01μM, 0.05μM, 0.25μM, 0.37μM, 0.5μM. (C) Quantitative representation of B. bars show the mean percentage of proliferating CD8+ T cells (n = 3 technical replicates). This experiment was repeated 3 times independently. (D) Entinostat induces Stat3 acetylation in J774M MDSC-like cells. Cells were treated for 6 hours and then harvested for immunoprecipitation of STAT3 and Western blot staining for acetylated lysine and total STAT3. (E) Quantitative RT-PCR analysis indicates a significant decrease in key MDSC functional regulator Arginase-1 when J774M cells are treated with entinostat. (F) Total RNA was extracted from Ly6G+ cells which were enriched from spleen of LLC tumor bearing mice, and analyzed by qRT-PCR. (G) Spleen and tumor cells were stained with DCFDA and analyzed by flow. Results are shown as mean ± SEM (*p < 0.05; **p < 0.01; ***p < 0.001; ****p < 0.0001).
Figure 5
Figure 5. Effect of entinostat on factors involved in PMN-MDSC mediated suppression in Ly6G+ generated from HPC
(A-B) Lineage negative cells were enriched from bone marrow cells of naïve female C57BL/6 mice, and cultured in RPMI supplemented with 10% FBS, penicillin and streptomycin, and 20 ng/mL of GM-CSF at 50,000 cells/well in 24-well plates. On Day 1, TES or media with DMSO, 100 or 500 nM of entinostat was added into the wells at 10%. On Day 3, half of culture supernatant was exchanged to fresh media supplemented with 20 ng/mL of GM-CSF with or without TES. On Day 6, cells were collected and analyzed by flow cytometric analysis. Results represent mean ± SEM of duplicate (*p < 0.05). (C) HPC cells from naïve bone marrow cells were cultured with 20 ng/mL of GM-CSF, 10% of TES, and DMSO or entinostat for 6 days. Ly6G+ cells were enriched by MACS separation and cocultured with splenocyte from PMEL mice and 0.1 mg/mL of gp100 peptide for 3 days. Cell proliferation was measured in triplicate using 3H-thymidine uptake. Results represent mean ± SEM of 2 independent experiments. (D) HPC cells from naïve bone marrow cells were cultured with 20 ng/mL of GM-CSF, 10% of TES, and DMSO or entinostat for 6 days. Ly6G+ cells were enriched by MACS separation. RNA was extracted from Ly6G+ cells and analyzed by qRT-PCR. Data represent mean ± SEM of triplicate, and statistically analyzed by Turkey’s multiple comparisons test (*p < 0.05). (E) HPC from naïve bone marrow cells were cultured with 20 ng/mL of GM-CSF, 10% of TES, and DMSO or entinostat for 6 days. Ly6G+ cells were enriched by MACS separation and cocultured with naïve splenocytes and 0.1 mg/mL of anti-CD3 and anti-CD28 antibodies for 24 hours at 105 cells/well. Nitrite concentration in culture supernatant was analyzed by Griess Reagent System (Promega). Data represent mean ± SEM of triplicate, and statistically analyzed by Turkey’s multiple comparisons test (*p < 0.05). (F) Arginase activity (in vitro HPC). HPC from naïve bone marrow cells were cultured with 20 ng/mL of GM-CSF, 10% of TES, and DMSO or entinostat for 6 days. Ly6G+ cells were enriched by MACS separation and lysed with lysis buffer of Arginase activity assay kit (abcam). Arginase activity was measured using Arginase activity assay kit. Data represent mean ± SEM of duplicated 2 independent experiments and statistically analyzed by t test (*p < 0.05). (G) PGE2 production in culture supernatant (in vitro HPC). HPC from naïve bone marrow cells were cultured with 20 ng/mL of GM-CSF, 10% of TES, and DMSO or entinostat for 6 days. Ly6G+ cells were enriched by MACS separation and cultured at 2×10⁶ cells/mL in RPMI complete media with 20 ng/mL of GM-CSF for 20 hours. PGE2 concentration in supernatant was measured using PGE2 ELISA Kit (Invitrogen). Data represent mean ± SEM of duplicate.
Figure 6
Figure 6. Treatment with entinostat significantly alters the highly immunosuppressive environment found in RENCA tumors
Tumor and blood samples collected from mice at the end of the study were processed and examined using the Proteome Profiler Mouse XL Cytokine array kit (Ary028). (A) Mouse cytokine/chemokine array results from tumor lysates in the control and entinostat treated cohorts (arrangement of the mouse cytokine/chemokine array can be found in the supplemental figures S.2) (n = 2 tumors/cohort & 3 data points per tumor). (B) Quantification of MDSC associated or pro-tumor cytokines/chemokines which were significantly downregulated in the presence of entinostat. (C) Quantification of anti-tumor chemokines/cytokines which were upregulated significantly in the presence of entinostat treatment. (D) Ary028 array results from serum samples of control and entinostat treated mice (n = 2 samples/cohort & 3 data points per tumor). (E) Array results comparing the control cohort with the combination cohort (n = 2 samples/cohort & 3 data points per tumor). Combination treatment significantly upregulated multiple anti-tumor associated chemokines and cytokines. Results are shown as mean ± SEM (*p < 0.05; **p < 0.01; ***p < 0.001; ****p < 0.0001), statistics were calculated using multiple t tests, discovery was determined using the Two-stage linear step-up procedure of Benjamini, Krieger and Yekutieli, with Q = 1%.

Similar articles

Cited by

References

    1. Brahmer JR, Tykodi SS, Chow LQ, Hwu WJ, Topalian SL, Hwu P, et al. Safety and activity of anti-PD-L1 antibody in patients with advanced cancer. N Engl J Med. 2012;366(26):2455–65. doi: 10.1056/NEJMoa1200694. - DOI - PMC - PubMed
    1. Topalian SL, Hodi FS, Brahmer JR, Gettinger SN, Smith DC, McDermott DF, et al. Safety, activity, and immune correlates of anti-PD-1 antibody in cancer. N Engl J Med. 2012;366(26):2443–54. doi: 10.1056/NEJMoa1200690. - DOI - PMC - PubMed
    1. Motzer RJ, Escudier B, McDermott DF, George S, Hammers HJ, Srinivas S, et al. Nivolumab versus Everolimus in Advanced Renal-Cell Carcinoma. N Engl J Med. 2015;373(19):1803–13. doi: 10.1056/NEJMoa1510665. - DOI - PMC - PubMed
    1. Quinn DI, Lara PN., Jr Renal-Cell Cancer--Targeting an Immune Checkpoint or Multiple Kinases. N Engl J Med. 2015;373(19):1872–4. doi: 10.1056/NEJMe1511252. - DOI - PMC - PubMed
    1. Shen L, Ciesielski M, Ramakrishnan S, Miles KM, Ellis L, Sotomayor P, et al. Class I histone deacetylase inhibitor entinostat suppresses regulatory T cells and enhances immunotherapies in renal and prostate cancer models. PloS one. 2012;7(1):e30815. doi: 10.1371/journal.pone.0030815. - DOI - PMC - PubMed

MeSH terms