. 2017 Sep 1;77(17):4567-4578.
doi: 10.1158/0008-5472.CAN-16-3389. Epub 2017 Jul 11.

APOBEC3A and APOBEC3B Activities Render Cancer Cells Susceptible to ATR Inhibition

Affiliations

APOBEC3A and APOBEC3B Activities Render Cancer Cells Susceptible to ATR Inhibition

Rémi Buisson et al. Cancer Res. .

Abstract

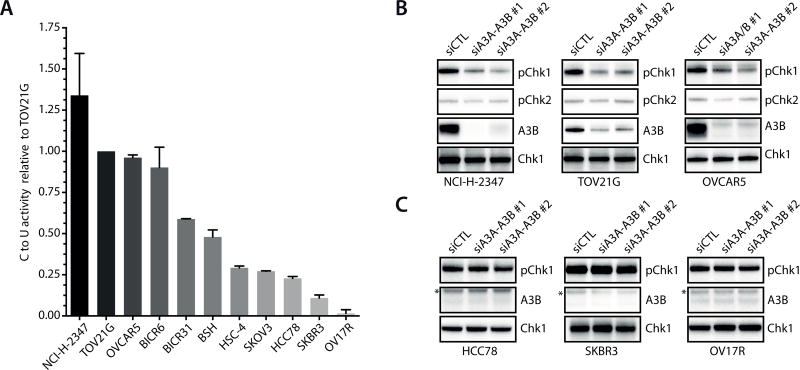
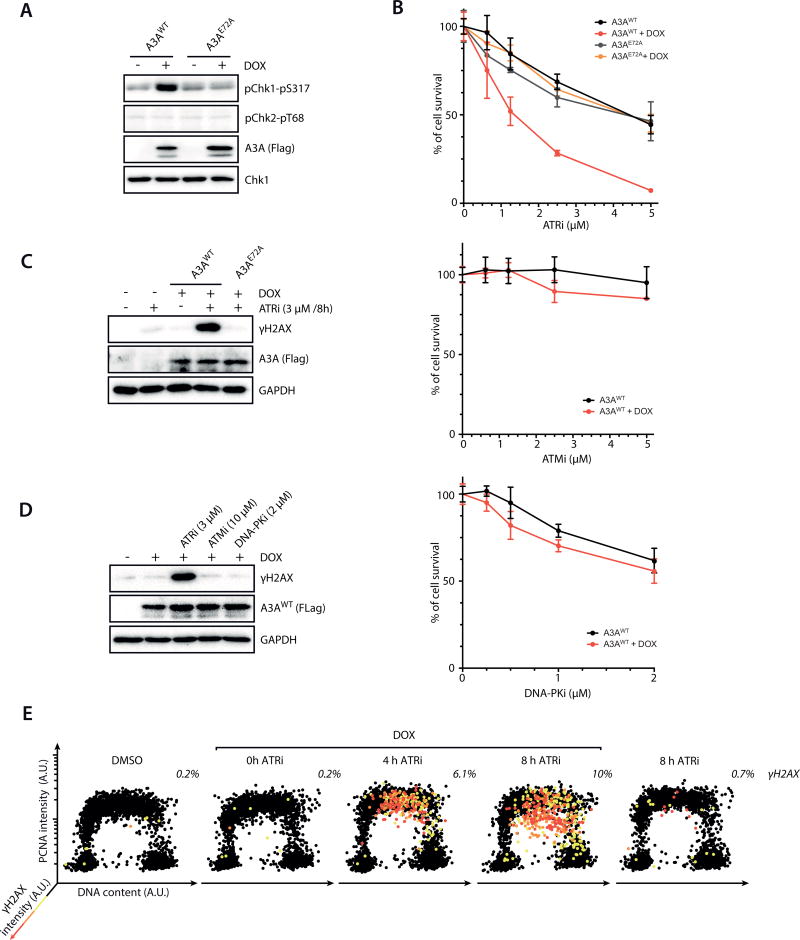
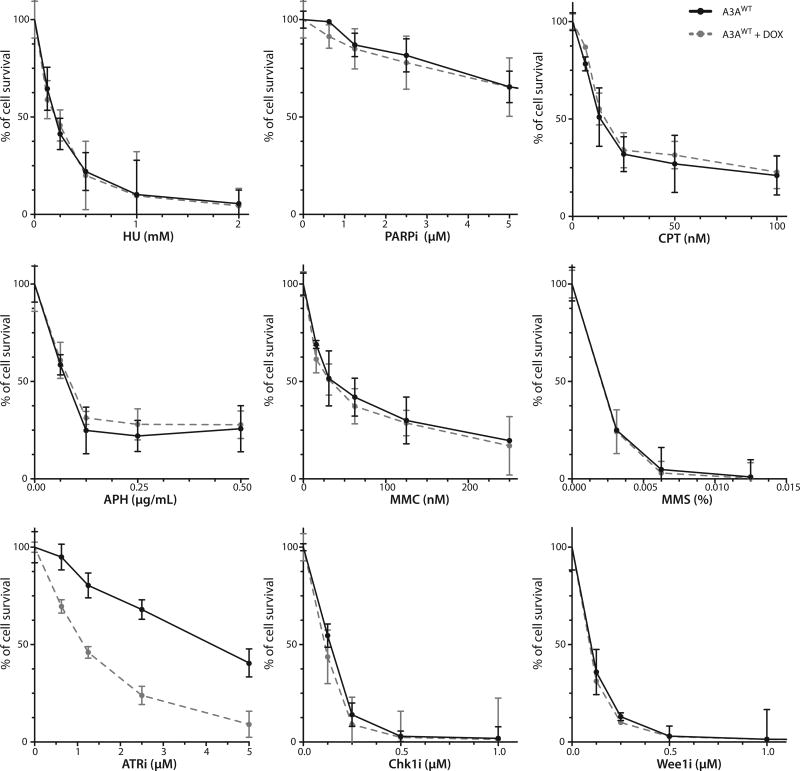
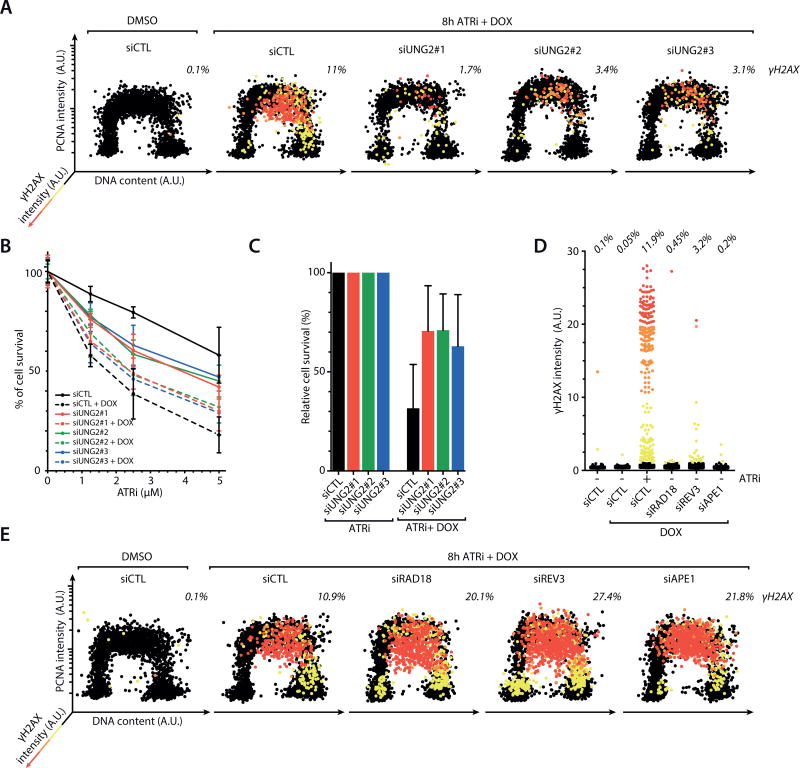
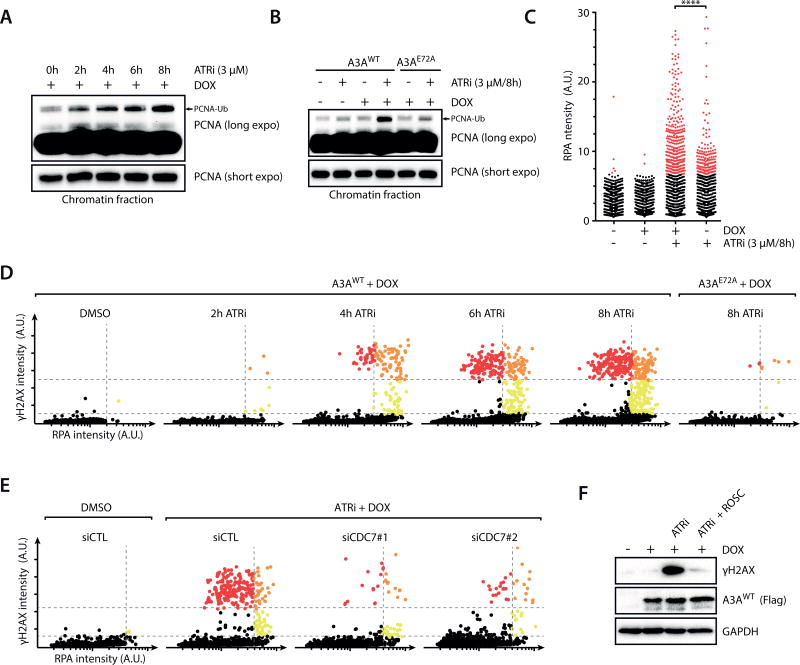
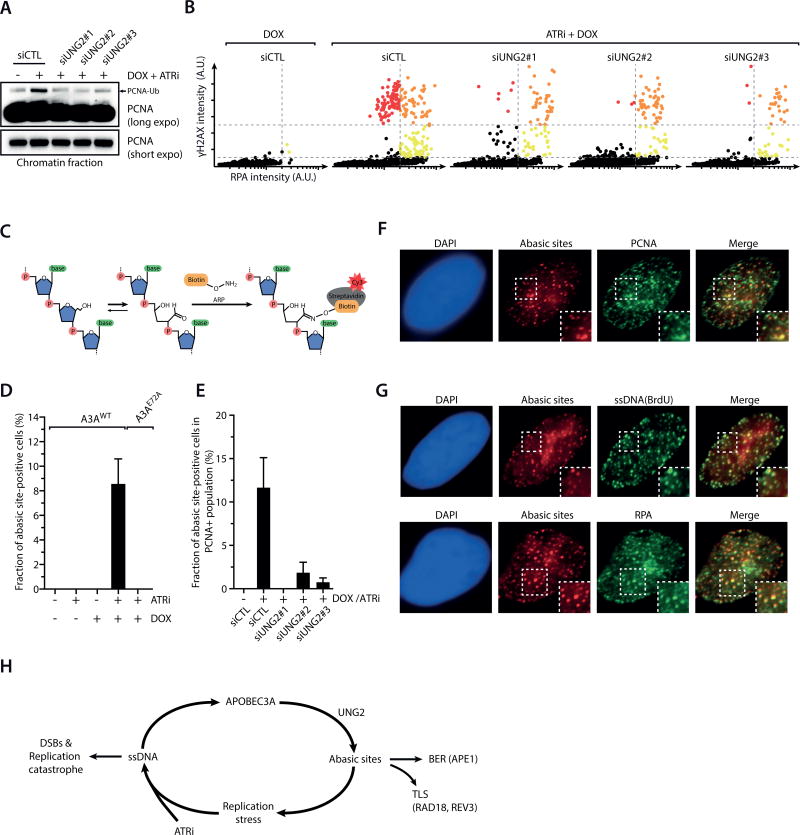
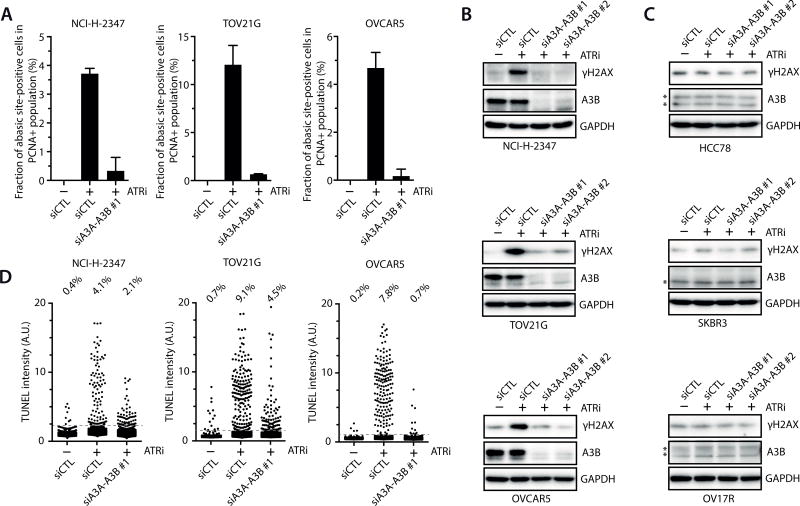
The apolipoprotein B mRNA editing enzyme catalytic polypeptide-like APOBEC3A and APOBEC3B have emerged as key mutation drivers in cancer. Here, we show that APOBEC3A and APOBEC3B activities impose a unique type of replication stress by inducing abasic sites at replication forks. In contrast to cells under other types of replication stress, APOBEC3A-expressing cells were selectively sensitive to ATR inhibitors (ATRi), but not to a variety of DNA replication inhibitors and DNA-damaging drugs. In proliferating cells, APOBEC3A modestly elicited ATR but not ATM. ATR inhibition in APOBEC3A-expressing cells resulted in a surge of abasic sites at replication forks, revealing an ATR-mediated negative feedback loop during replication. The surge of abasic sites upon ATR inhibition associated with increased accumulation of single-stranded DNA, a substrate of APOBEC3A, triggering an APOBEC3A-driven feed-forward loop that ultimately drove cells into replication catastrophe. In a panel of cancer cell lines, ATRi selectively induced replication catastrophe in those harboring high APOBEC3A and/or APOBEC3B activities, showing that APOBEC3A and APOBEC3B activities conferred susceptibility to ATRi. Our results define an APOBEC-driven replication stress in cancer cells that may offer an opportunity for ATR-targeted therapy. Cancer Res; 77(17); 4567-78. ©2017 AACR.


Conflict of interest statement

The conflict of interest statement: The authors do not have conflicts of interest to disclose.

Figures

Figure 1
Figure 1. APOBEC3A and APOBEC3B activate ATR in cancer cells
A. Relative A3A–A3B activity in a panel of cancer cell lines. A3A–A3B activity was determined from 20 µg cell extracts as showed in Supplementary Fig. S2. The activity of TOV12G is defined as 1. Cell lines are ranked according to their overall A3A–A3B activity. Error bar: S.D. (n = 3). B–C. The three high-A3A–A3B activity lines (B) and the three low-A3A–A3B activity lines (C) were transfected with control siRNA or A3A–A3B siRNAs. Levels of baseline p-Chk1 and p-Chk2 were analyzed by Western blot. *, a non-specific band.
Figure 2
Figure 2. ATR counters APOBEC3A-induced replication stress
A. U2OS-derived inducible cell lines of A3AWT and A3AE72A were induced with doxycycline (DOX) or left uninduced. Levels of p-Chk1 and p-Chk2 were analyzed by Western blot. B. Cells expressing A3AWT or A3AE72A were treated with ATRi, ATMi, or DNA-PKi as indicated. Cell survival was analyzed after 5 days of continuous treatments. Error bar: S.D. (n=3). C–D. Levels of γH2AX in cells expressing A3AWT or A3AE72A after 8 h of treatments with ATRi, ATMi, or DNA-PKi. E. Cells were induced to express A3AWT or left uninduced, and treated with DMSO or ATRi (3 µM) for the indicated amounts of time. Levels of chromatin-bound PCNA, γH2AX, and DNA contents of 4,000 cells were quantified, and plotted along the 3 indicated axes. Cells were colored according to the intensity of γH2AX staining.
Figure 3
Figure 3. APOBEC3A-expressing cells are specifically sensitive to ATR inhibitor
U2OS-derived inducible cell lines of A3AWT and A3AE72A were induced with DOX or left uninduced, and treated with increasing concentrations of the indicated inhibitors or DNA-damaging agents. Cell survival was analyzed after 5 days of continuous treatments. Error bar: S.D. (n=3).
Figure 4
Figure 4. APOBEC3A induces DSBs through abasic sites upon ATR inhibition
A. Inducible A3AWT cells were transfected with control siRNA or 3 independent UNG2 siRNAs, and treated with DMSO or ATRi (3 µM) + DOX. Levels of chromatin-bound PCNA, γH2AX, and DNA contents of 4,000 cells were quantified and plotted along the 3 indicated axes. Cells were colored according to the intensity of γH2AX staining. B–C. Inducible A3AWT cells were transfected with UNG2 siRNAs, and treated with increasing concentrations of ATRi (B) or with 5 µM of ATRi (C) in the presence or absence of DOX. Cell survival was analyzed after 5 days of continuous treatments. Error bar: S.D. (n=3). D. Quantification of γH2AX intensity in 2,000 inducible A3AWT cells treated with various siRNAs, ATRi, and DOX as indicated. E. Inducible A3AWT cells were treated and analyzed as in A except that RAD18, REV3, and APE1 siRNAs were used.
Figure 5
Figure 5. ATR inhibition in APOBEC3A-expressing cells leads to replication catastrophe
A–B. Levels of PCNA and mono-ubiquitinated PCNA in the chromatin fractions of ATRi-treated A3AWT or A3AE72A-expressing cells were analyzed by Western blot. C. Levels of chromatin-bound RPA were analyzed in 1,000 inducible A3AWT cells after induction with DOX and treatment with ATRi as indicated. Significance was determined by t-test. ****, P<0.0001. D. Cells expressing A3AWT or A3AE72A were treated with DMSO or ATRi (3 µM) as indicated. Levels of chromatin-bound RPA and γH2AX in 5,000 cells were quantified. Cells with medium or high levels of RPA and γH2AX are divided by dotted lines and colored differently. The reduction of RPA in red cells compared to orange cells is likely due to severe chromosome fragmentation. E. Inducible A3AWT cells were transfected with control or CDC7 siRNAs, induced with DOX, and treated with ATRi (3 µM) for 8h. Levels of chromatin-bound RPA and γH2AX in 3,000 cells were quantified. F. Cells were induced to express A3AWT or left uninduced, and treated with ATRi (3 µM) and Roscovitine (12 µM) as indicated for 8 h. Levels of γH2AX were analyzed by Western blot.
Figure 6
Figure 6. ATR inhibition increases abasic site accumulation at replication forks
A–B. Cells were induced to express A3AWT or left uninduced, transfected with control siRNA or 3 independent UNG2 siRNAs, and treated with DMSO or ATRi (3 µM) for 8 h. Levels of PCNA and mono-ubiquitinated PCNA in the chromatin fractions were analyzed by Western blot in A, and levels of chromatin-bound RPA and γH2AX in 5,000 cells were quantified in B. C. A schematic diagram of the chemical reaction in which an Aldehyde Reactive Probe (ARP) binds to an abasic site in DNA. ARP probes were detected with Cy3-conjugated Streptavidin. D–E. Cells were transfected with control or UNG2 siRNAs (E), induced to express A3AWT, A3AE72A, or left uninduced, and treated with ATRi (3 µM) for 8h. Fractions of abasic site-positive cells in total cell populations (D) or PCNA-positive cell populations (E) were quantified. Error bar: S.D. (n = 3). F. The abasic sites induced by A3AWT and ATRi (3 µM for 8 h) colocalize with PCNA, a marker of replication forks. G. The abasic sites induced by A3AWT and ATRi (3 µM for 8h) colocalize with ssDNA (native BrdU staining) and RPA. H. A model that explains how A3A and ATRi drive a feed-forward loop that generates abasic sites, elevates DNA replication stress, and promotes replication catastrophe.
Figure 7
Figure 7. APOBEC3A and APOBEC3B render cancer cells susceptible to ATRi
A. The three cell lines with high overall A3A–A3B activity were transfected with control siRNA or A3A–A3B siRNA, and treated with ATRi (6 µM) for 8 h. Levels of abasic sites were analyzed using biotinylated ARP. Error bar: S.D. (n = 3). B–C. The three cell lines with high overall A3A–A3B activity (B) and the three lines with low A3A–A3B activity (C) were transfected with control siRNA or A3A–A3B siRNAs, and treated with ATRi (6 µM) for 8 h. Levels of γH2AX were analyzed by Western blot. *, a non-specific band. D. The three cell lines with high overall A3A–A3B activity were transfected with control siRNA or A3A–A3B siRNA, and treated with ATRi (6 µM) for 8 h. TUNEL signals of 2,000 cells were quantified for each condition.

Similar articles

Cited by

References

    1. Hanahan D, Weinberg RA. Hallmarks of cancer: the next generation. Cell. 2011;144:646–674. - PubMed
    1. Zeman MK, Cimprich KA. Causes and consequences of replication stress. Nat Cell Biol. 2014;16:2–9. - PMC - PubMed
    1. Macheret M, Halazonetis TD. DNA replication stress as a hallmark of cancer. Annu Rev Pathol. 2015;10:425–448. - PubMed
    1. Bartkova J, Horejsi Z, Koed K, Kramer A, Tort F, Zieger K, et al. DNA damage response as a candidate anti-cancer barrier in early human tumorigenesis. Nature. 2005;434:864–870. - PubMed
    1. Bartkova J, Rezaei N, Liontos M, Karakaidos P, Kletsas D, Issaeva N, et al. Oncogene-induced senescence is part of the tumorigenesis barrier imposed by DNA damage checkpoints. Nature. 2006;444:633–637. - PubMed

Publication types

MeSH terms