. 2017 Aug 15;144(16):2925-2939.
doi: 10.1242/dev.147629. Epub 2017 Jul 11.

Loss of DNA methylation in zebrafish embryos activates retrotransposons to trigger antiviral signaling

Affiliations

Loss of DNA methylation in zebrafish embryos activates retrotransposons to trigger antiviral signaling

Yelena Chernyavskaya et al. Development. .

Abstract

Complex cytoplasmic nucleotide-sensing mechanisms can recognize foreign DNA based on a lack of methylation and initiate an immune response to clear the infection. Zebrafish embryos with global DNA hypomethylation caused by mutations in the ubiquitin-like with PHD and ring finger domains 1 (uhrf1) or DNA methyltransferase 1 (dnmt1) genes exhibit a robust interferon induction characteristic of the first line of defense against viral infection. We found that this interferon induction occurred in non-immune cells and examined whether intracellular viral sensing pathways in these cells were the trigger. RNA-seq analysis of uhrf1 and dnmt1 mutants revealed widespread induction of Class I retrotransposons and activation of cytoplasmic DNA viral sensors. Attenuating Sting, phosphorylated Tbk1 and, importantly, blocking reverse transcriptase activity suppressed the expression of interferon genes in uhrf1 mutants. Thus, activation of transposons in cells with global DNA hypomethylation mimics a viral infection by activating cytoplasmic DNA sensors. This suggests that antiviral pathways serve as surveillance of cells that have derepressed intragenomic parasites due to DNA hypomethylation.

Keywords: Antiviral; DNA methylation; Interferon; Transposon; Uhrf1.


Conflict of interest statement

Competing interestsThe authors declare no competing or financial interests.

Figures

Fig. 1.
Fig. 1.
uhrf1 loss induces immune gene expression. (A) Heat map of the top 50 upregulated genes in uhrf1 zebrafish mutants at 120 hpf rank ordered by their expression analysis via microarray and expression in uhrf1 and dnmt1 via RNA-seq at the same time point. 39 of the top 50 genes (76%) are annotated as having a function in the immune system (red text). (B) Gene ontology (GO) pathway enrichment analysis of biological processes based on differentially expressed genes identified through microarray analysis, rank ordered by normalized enrichment score. Red, blue and gray bars denote immune, apoptotic and other pathways, respectively. (C) RT-qPCR validation of microarray results for genes randomly chosen from among those significantly upregulated genes and categorized as having an immune function, in addition to key components of the immune response. Gene symbols that are marked with an asterisk were identified as upregulated in uhrf1 mutants as compared with WT by microarray. *P<0.05, **P<0.005 by t-test (see Table S3 for P-values and fold changes). Error bars represent s.d.
Fig. 2.
Fig. 2.
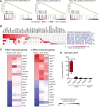
Induction of a type I interferon response in uhrf1 mutant embryos. (A) Gene set enrichment analysis (GSEA) reveals enrichment of type I (alpha, beta) and type II (gamma) interferon pathways in 120 hpf uhrf1 embryos. Normalized enrichment score (NES) and false discovery rate (FDR) are indicated. (B) Leading edge analysis comparing the uhrf1 interferon gene signature with those reported from human cells exposed to interferon (Table S2). (C) Heat map comparing expression of the top ten upregulated (red) and downregulated (blue) genes in zebrafish embryos infected with CHIKV or IHNV virus (Briolat et al., 2014) with the expression of these genes in uhrf1 and dnmt1 mutants (log2 fold change). Note that expression was assessed by RT-qPCR in infected embryos by Briolat et al. (2014) and by RNA-seq in uhrf1 and dnmt1 mutants. (D) Expression of zebrafish interferon genes in whole 120 hpf uhrf1 mutants assayed by RT-qPCR. Fold change in individual clutches compared with WT siblings is indicated (black dots). Boxes indicate the 25th and 75th percentile of the range, with whiskers marking the 10th and 90th percentile values.
Fig. 3.
Fig. 3.
Immune gene induction occurs as an early response to loss of DNA methylation. (A) Transcript levels examined by RT-qPCR of a panel of immune genes in 55, 72, 80 and 120 hpf uhrf1 mutants relative to expression in WT siblings, as compared with RNA-seq from 120 hpf uhrf1 and dnmt1 mutants. Expression is depicted as log2 fold change, with significance indicated by an asterisk (individual P-values are listed in Tables S1 and S3). (B) Slot blot analysis of global 5MeC in uhrf1 mutants at the same time points as assayed for gene expression. Error bars represent s.d.
Fig. 4.
Fig. 4.
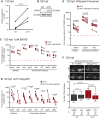
Leukocyte depletion does not reduce the induction of immune genes in uhrf1 mutants. Macrophages (A) and neutrophils (B) are enriched in the head (magnified in inset) of Tg(mpeg:mCherry;uhrf1) (A) and Tg(lysZ:dsRed;uhrf1) (B) and WT embryos at 80 and 120 hpf. Macrophages (C) and neutrophils (D) in the head region (inset in A,B) are significantly increased in uhrf1 mutants at 80 and 120 hpf. The number of embryos and clutches analyzed is indicated for each sample. (E) 0.5 mM pu.1 morpholino (MO) effectively reduces the leukocyte population. (F) RT-qPCR analysis reveals fold change in expression of immune genes from five clutches of uhrf1 and uhrf1 mutant/pu.1 morphants at 80 hpf (expression in WT embryos is shown in Fig. S5). A line connecting two dots represents one paired sample, which are siblings from a single clutch. P-values were determined by t-test (C,D) or paired t-test (F).
Fig. 5.
Fig. 5.
Interferon target genes are induced in the head, jaw and liver in uhrf1 mutants. ISH for irf1b and isg15, two of the most upregulated interferon genes, in 80 and 120 hpf uhrf1 and WT siblings (3-6 embryos per group/per time point). Staining is particularly intense along the caudomedial edge of the optic tectum (white arrowhead), ear (asterisk) and liver (black arrowhead) at 120 hpf for both genes. n=15, clutches=3.
Fig. 6.
Fig. 6.
Cytosolic antiviral signaling is activated in uhrf1 mutants. (A) Change of pTbk1 protein levels quantified in three clutches of 120 hpf uhrf1 mutants and their siblings and (B) a representative western blot. (C) Embryos treated with 1 µM BX795 from 48-120 hpf were assayed for immune gene expression at 120 hpf by RT-qPCR in at least three clutches. Relative percentage change in gene expression is shown in treated uhrf1 compared with 0.1% DMSO-treated uhrf1 embryos (n=4). (D) Immune gene expression in uhrf1 mutant embryos injected with sting morpholino (MO) compared with uninjected uhrf1 mutants (n=4). (E) Examination of the expression of a limited panel of immune genes before and after 500 µg/µl Foscarnet (Fos) treatment in uhrf1 mutants (n=8). A line connecting two dots represents one paired sample of siblings from a single clutch. Significance was determined by t-test (A) or paired t-test (C-E). (F) Assessment of macrophage number in the head of embryos treated with 500 µg/µl Fos. The area quantified in WT and uhrf1 mutants is indicated (red dashed box). Error bars represent s.d.
Fig. 7.
Fig. 7.
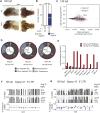
Endogenous retrotransposon expression is upregulated in uhrf1 mutants. (A) ISH of zferv expression in representative 120 hpf larvae. Staining is apparent in the eye and optic tectum (arrowheads). (B) ISH quantification of total number of embryos from two clutches scored for zferv expression in the head. (C) Expression of individual TEs, as normalized read counts, is plotted against log2 fold change of analogous TEs in uhrf1 relative to WT siblings as identified through RNA-seq. Red dots indicate TEs with significantly altered expression (P<0.05) and include the highly expressed Gypsy-10 and Gypsy-21. (D) TEs showing significant changes in C and two additional RNA-seq datasets from 55 hpf uhrf1 and 120 hpf dnmt1 mutants were grouped by expression and subdivided into transposon classes depending on their mechanism of mobility. (E) Expression comparison of select significantly induced TEs shared between 55 and 120 hpf uhrf1 mutant RNA-seq datasets. (F,G) Sanger sequencing of BS-PCR products from the Gypsy-21 (F) or Gypsy-10 (G) locus at 55 and 120 hpf in WT and uhrf1 mutants. Bottom panel shows differential methylation.
Fig. 8.
Fig. 8.
Model for uhrf1 loss and DNA hypomethylation driving immune induction. (A) Summary of phenotype onset in uhrf1 mutant embryos. Phenotypes are subdivided into events that occur early (1st wave) and late (2nd wave) in development. (B) uhrf1 mutation results in global DNA hypomethylation and apoptosis. Release of cellular debris and hypomethylated DNA into the environment, coupled with secretion of immune factors, can recruit immune cells. Increase in expression of interferon and immune genes can occur either directly by derepression of gene promoters or indirectly through cytosolic viral sensors, reflecting reactivation of repressed retrotransposable elements. Arrow colors are indicative of confirmed (black) or proposed (gray) contributions of each pathway to the uhrf1 phenotype.

References

    1. Absher D. M., Li X., Waite L. L., Gibson A., Roberts K., Edberg J., Chatham W. W. and Kimberly R. P. (2013). Genome-wide DNA methylation analysis of systemic lupus erythematosus reveals persistent hypomethylation of interferon genes and compositional changes to CD4+ T-cell populations. PLoS Genet. 9, e1003678 10.1371/journal.pgen.1003678 - DOI - PMC - PubMed
    1. Aggad D., Mazel M., Boudinot P., Mogensen K. E., Hamming O. J., Hartmann R., Kotenko S., Herbomel P., Lutfalla G. and Levraud J.-P. (2009). The two groups of zebrafish virus-induced interferons signal via distinct receptors with specific and shared chains. J. Immunol. 183, 3924-3931. 10.4049/jimmunol.0901495 - DOI - PubMed
    1. Aken B. L., Ayling S., Barrell D., Clarke L., Curwen V., Fairley S., Fernandez Banet J., Billis K., García Girón C., Hourlier T. et al. (2016). The Ensembl gene annotation system. Database 2016, baw093 10.1093/database/baw093 - DOI - PMC - PubMed
    1. Amsterdam A., Nissen R. M., Sun Z., Swindell E. C., Farrington S. and Hopkins N. (2004). Identification of 315 genes essential for early zebrafish development. Proc. Natl. Acad. Sci. USA 101, 12792-12797. 10.1073/pnas.0403929101 - DOI - PMC - PubMed
    1. Anders S., Pyl P. T. and Huber W. (2015). HTSeq—a Python framework to work with high-throughput sequencing data. Bioinformatics 31, 166-169. 10.1093/bioinformatics/btu638 - DOI - PMC - PubMed

Publication types

MeSH terms