. 2017 Oct;23(10):1582-1591.
doi: 10.1261/rna.061184.117. Epub 2017 Jul 11.

Enzymatic production of single-molecule FISH and RNA capture probes

Affiliations

Enzymatic production of single-molecule FISH and RNA capture probes

Imre Gaspar et al. RNA. 2017 Oct.

Abstract

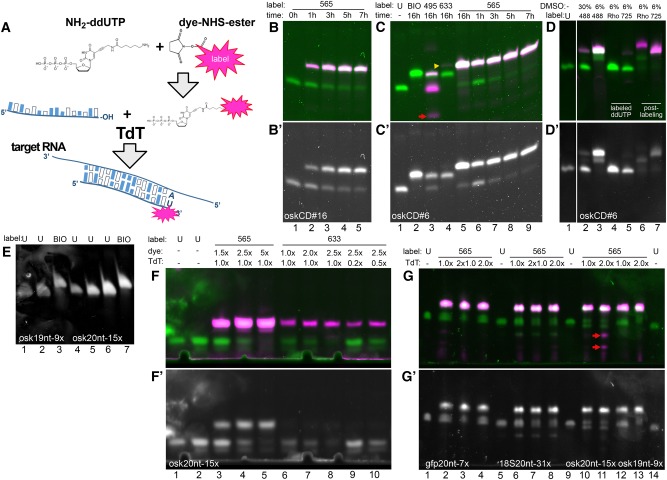
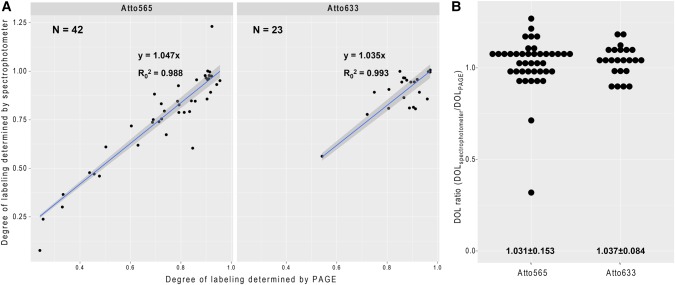
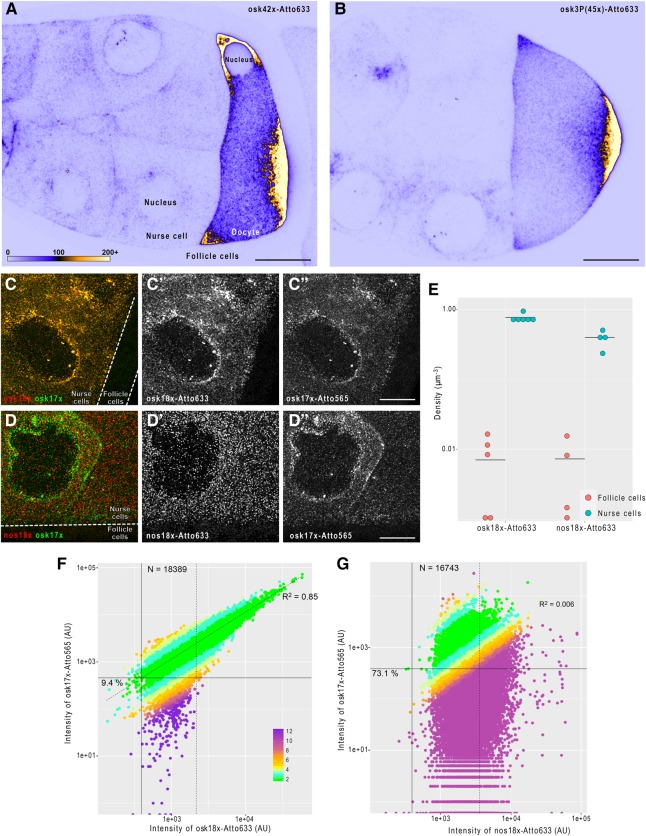
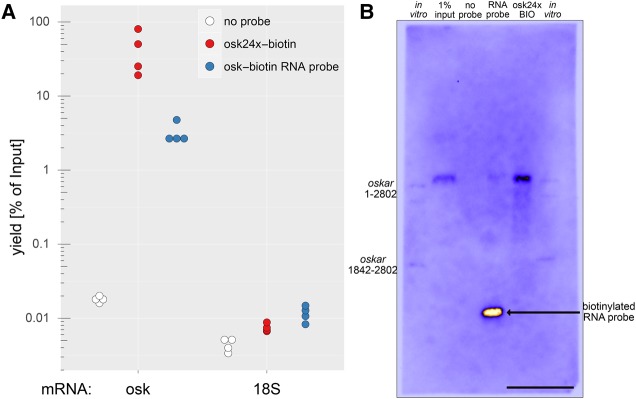
Arrays of singly labeled short oligonucleotides that hybridize to a specific target revolutionized RNA biology, enabling quantitative, single-molecule microscopy analysis and high-efficiency RNA/RNP capture. Here, we describe a simple and efficient method that allows flexible functionalization of inexpensive DNA oligonucleotides by different fluorescent dyes or biotin using terminal deoxynucleotidyl transferase and custom-made functional group conjugated dideoxy-UTP. We show that (i) all steps of the oligonucleotide labeling-including conjugation, enzymatic synthesis, and product purification-can be performed in a standard biology laboratory, (ii) the process yields >90%, often >95% labeled product with minimal carryover of impurities, and (iii) the oligonucleotides can be labeled with different dyes or biotin, allowing single-molecule FISH, RNA affinity purification, and Northern blot analysis to be performed.

Keywords: RNA affinity purification; dideoxy-UTP; oligonucleotide labeling; single-molecule FISH; terminal deoxynucleotidyl transferase.


Figures

FIGURE 1.
FIGURE 1.
3′ Incorporation of labeled ddUTP by TdT. (A) Schematics of the enzymatic oligo labeling protocol. The volatile dye–NHS ester is reacted with NH2-ddUTP immediately upon reconstitution. The labeled, unpurified terminator nucleotide is then used in a TdT-mediated end-labeling reaction to label the 3′ end of individual oligonucleotides or oligonucleotide mixtures that can serve as smFISH or RNA affinity capture probes in downstream applications. (B,B′) oskCD#16 probe (lane 1) labeled with Atto565–ddUTP (4× molar excess) for 1 h (lane 2), 3 h (lane 3), 5 h (lane 4), and 7 h (lane 5). Dye fluorescence is shown in magenta, SYBR GOLD staining is shown in green (B) and in gray (B′). Ninety-six picomoles of oligo/lane. (C,C′) oskCD#6 probe (lane 1) labeled with biotin–ddUTP (threefold molar excess) (lane 2), Atto495–ddUTP (fourfold molar excess) (lane 3), Atto633–ddUTP (fourfold molar excess) (lane 4), and Atto565–ddUTP (fourfold molar excess) (lane 5) overnight (16 h). Red arrow (lane 3) indicates carryover of free Atto495–ddUTP. Yellow arrowhead points to a minuscule amount of Atto633 labeled, fluorescent product in lane 4. Time course labeling of oskCD#6 probe with Atto565–ddUTP (fourfold molar excess) for 1 h (lane 6), 3 h (lane 7), 5 h (lane 8), and 7 h (lane 9). Ninety-six picomoles of oligo/lane. (D,D′) oskCD#6 probe (lane 1) labeled with Atto488–ddUTP (fourfold molar excess) in the presence of 30% (lane 2) and 6% DMSO (lane 3). oskCD#8 probe labeled directly with AttoRho14–ddUTP (lane 4) and Atto725–ddUTP (lane 5) (fourfold molar excess) or with unconjugated NH2–ddUTP reacted to AttoRho14–NHS ester (lane 6) or Atto725–NHS ester (lane 7) subsequently. Ninety-six picomoles of oligo/lane. (E) osk19nt-9× probe mixture (lane 1, 12 pmol; lane 2, 24 pmol) labeled with biotin–ddUTP (threefold molar excess) (lane 3, 24 pmol). osk20nt-15× probe mixture (lane 4, 6 pmol; lane 5, 12 pmol; lane 6, 24 pmol) labeled with biotin–ddUTP (threefold molar excess) (lane 7, 24 pmol). (F,F′) osk20nt-15× probe mixture (lane 1, 6 pmol; lane 2, 9 pmol) labeled with Atto565–ddUTP (lane 3, 1.5-fold; lane 4, 2.5-fold; lane 5, fivefold molar excess) or with Atto633–ddUTP (lane 6, 1.5-fold; lane 7, twofold; lanes 810, 2.5-fold molar excess). Lanes 9 and 10 show results of labeling performed with reduced amounts of TdT enzyme (lane 9, 0.2-fold; lane 10, 0.5-fold of standard TdT amount). Fifteen picomoles of oligo/lane (310). (G,G′) Atto565–ddUTP labeling (fivefold excess) of probe mixtures. gfp20nt-7× probe mixture (lane 1) labeled using onefold (lanes 2,3) or twofold (lane 4) the standard TdT amount. 18S20nt-31× probe mixture (lane 5) labeled using onefold (lanes 6,7) or twofold (lane 8) the standard TdT amount. osk20nt-15× probe mixture (lane 9) labeled using onefold (lane 10) or twofold (lane 11) of standard TdT amount. osk19nt-9× probe mixture (lane 14) labeled using onefold (lane 12) or twofold (lane 13) the standard TdT amount. Lanes 3 and 7 show results of relabeling of probe mixtures shown in lanes 2 and 6, respectively. Three picomoles of oligo/lane (1,5,9,14) and 15 pmol oligo/lane (24,68,1013). Red arrow (lane 11) indicates carryover of free Atto565–ddUTP.
FIGURE 2.
FIGURE 2.
Determining degree of labeling. (A) Degree of labeling of isomeric probe mixtures (osk19nt-7×, osk20nt-15×, gfp-19nt-11×, gfp-20nt-7×, and 18S-20nt-31×) determined by PAGE densitometry and by spectrophotometry using Atto565– or Atto633–ddUTP. Correlation of the two analytical modalities was tested, slope and goodness of fit, as well as the number of measurements are indicated in the graphs. The intercept of the regression model was set to zero. (B) Ratio of spectroscopically and densitometrically determined degree of labeling. Mean ± SD are indicated below the graphs.
FIGURE 3.
FIGURE 3.
smFISH carried out using 3′ end labeled probe mixtures. (A,B) Fluorescent in situ hybridization of oskar mRNA in mid-oogenetic Drosophila egg chambers using a set of 42 enzymatically produced antisense oligonucleotides (A) or a set of 45 chemically labeled smFISH probes (B [Little et al. 2015]). Posterior poles, where oskar mRNA localizes, face toward the right of the panels. Sum intensity projections of 11 optical slices (a total 2 µm depth) of raw confocal images are shown. Pixels represent absolute photon counts (see panel A for key). Scale bars are 20 µm. (CC″) smFISH of oskar mRNA in a developing Drosophila egg chamber using osk18×–Atto633 (red, C′) and osk17×–Atto565 (green, C″) probe sets. The two probes sets label oskar mRNA in an alternating fashion. (DD″) smFISH of oskar and nanos mRNAs in a developing Drosophila egg chamber using nos18×–Atto633 (red, D′) and osk17×–Atto565 (green, D″) probe sets. (CD″) The germline, which expresses oskar and nanos mRNAs (nurse cells) and the soma (follicle cells), is indicated. Scale bars are 10 µm. (E) Density of detected smFISH signal in the mRNA expressing (cyan, nurse cells) and nonexpressing (red, follicle cells) compartments of the egg chambers. Horizontal lines indicate the mean value of observations. (F,G) Intensity of osk17×–Atto565 probe sets (target channel) as a function of Atto633 signal intensity (reference channel) of smFISH objects detected by the fluorescence of osk18×–Atto633 (F) or nos18×–Atto633 (G) probe sets (reference channel). Percentage values represent the fraction of single mRNA containing smFISH objects that would have failed to be detected in the target channel (Atto 565) since their corresponding signal intensity falls below the estimated target channel detection threshold (solid horizontal line). This detection threshold corresponds to the product of the reference channel detection threshold (solid vertical line, 0.1th percentile of the Atto633 signal intensity distribution) and the slope of the fitted line (dashed line. The line was fitted to the nonsingle mRNA representing fraction of the population; goodness-of-fit indicated). smFISH objects with signal intensity lower than µ1 + 2σ1 of the smallest fitted Gaussian function (Supplemental Fig. S2) were considered to represent a single mRNA molecule (dashed vertical line). Numbers of these single copy mRNA objects are indicated in the graphs. Colors represent the relative fold difference of the observed and expected target channel (Atto565) signals (see panel F for key). The expected target channel (Atto565) signal is calculated as the product of the regression slope and the reference channel (Atto633) fluorescence.
FIGURE 4.
FIGURE 4.
mRNA affinity purification using biotinylated DNA versus RNA probes. (A) Quantitative RT-PCR analysis of the captured RNA. A biotinylated DNA probe set (osk24×–biotin) captured oskar mRNA more efficiently than a single, 400-nt-long, internally biotinylated RNA probe (osk–biotin RNA probe), whereas the unrelated RNA (18S ribosomal RNA) was only marginally captured. (B) Northern blot of the captured oskar mRNA (4 min exposure). Equal volumes of the 1% input (lane 2, 12.5 µg total RNA) and 20%–20% of the three eluates (lanes 35) were blotted to a membrane, and oskar mRNA was hybridized with the osk59×–biotin probe set. The signal was detected by HRP-conjugated streptavidin that recognized the biotinylated 400-nt-long RNA probe used for the RNA capture in lane 4. As markers, in vitro transcribed oskar1-2802 (almost full-length RNA, 150 pg/lane) and oskar1842-2802 (almost the entire oskar 3′ UTR, 300 pg/lane) was used (lanes 1,6). Note that oskar1-2802 ran as a doublet, possibly because of two stable RNA conformations. Scale bar is 1 cm.

Similar articles

Cited by

References

    1. Chu C, Zhang QFC, da Rocha ST, Flynn RA, Bharadwaj M, Calabrese JM, Magnuson T, Heard E, Chang HY. 2015. Systematic discovery of Xist RNA binding proteins. Cell 161: 404–416. - PMC - PubMed
    1. Femino AM, Fay FS, Fogarty K, Singer RH. 1998. Visualization of single RNA transcripts in situ. Science 280: 585–590. - PubMed
    1. Gaspar I, Ephrussi A. 2015. Strength in numbers: quantitative single-molecule RNA detection assays. Wiley Interdiscip Rev Dev Biol 4: 135–150. - PMC - PubMed
    1. Gaspar I, Yu YV, Cotton SL, Kim DH, Ephrussi A, Welte MA. 2014. Klar ensures thermal robustness of oskar localization by restraining RNP motility. J Cell Biol 206: 199–215. - PMC - PubMed
    1. Gáspár I, Sysoev V, Komissarov A, Ephrussi A. 2017. An RNA-binding atypical tropomyosin recruits kinesin-1 dynamically to oskar mRNPs. EMBO J 36: 319–333. - PMC - PubMed

Publication types

MeSH terms

LinkOut - more resources