. 2017 Jul 11;8(4):e00876-17.
doi: 10.1128/mBio.00876-17.

A Novel Single-Cell FISH-Flow Assay Identifies Effector Memory CD4+ T cells as a Major Niche for HIV-1 Transcription in HIV-Infected Patients

Affiliations

A Novel Single-Cell FISH-Flow Assay Identifies Effector Memory CD4+ T cells as a Major Niche for HIV-1 Transcription in HIV-Infected Patients

Judith Grau-Expósito et al. mBio. .

Abstract

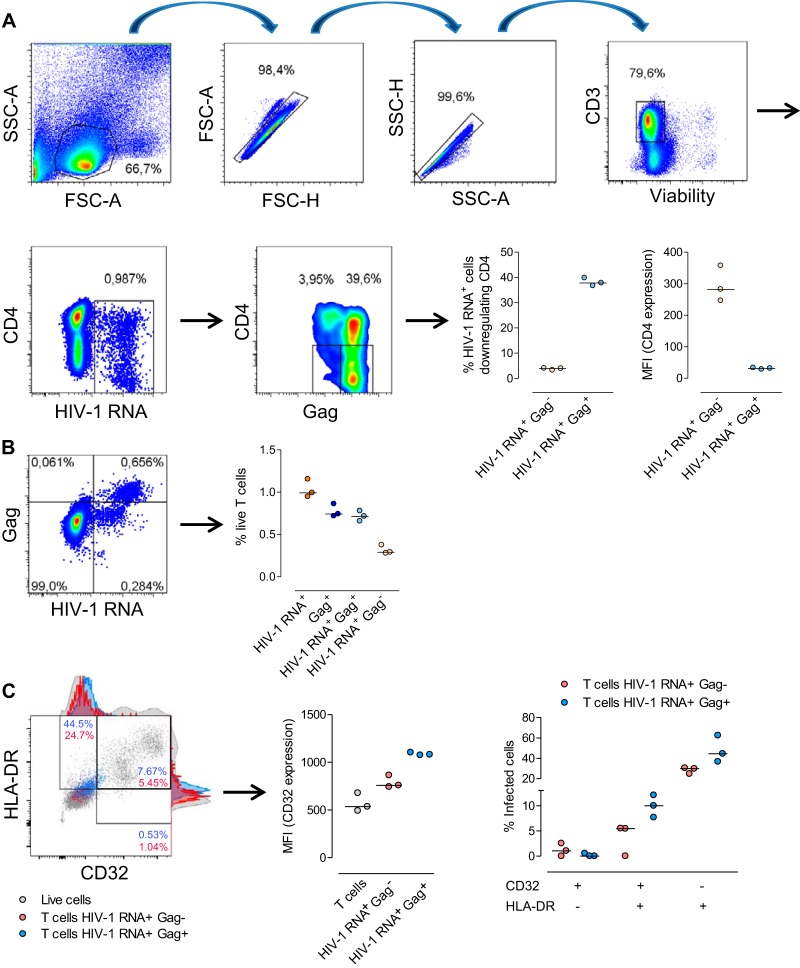
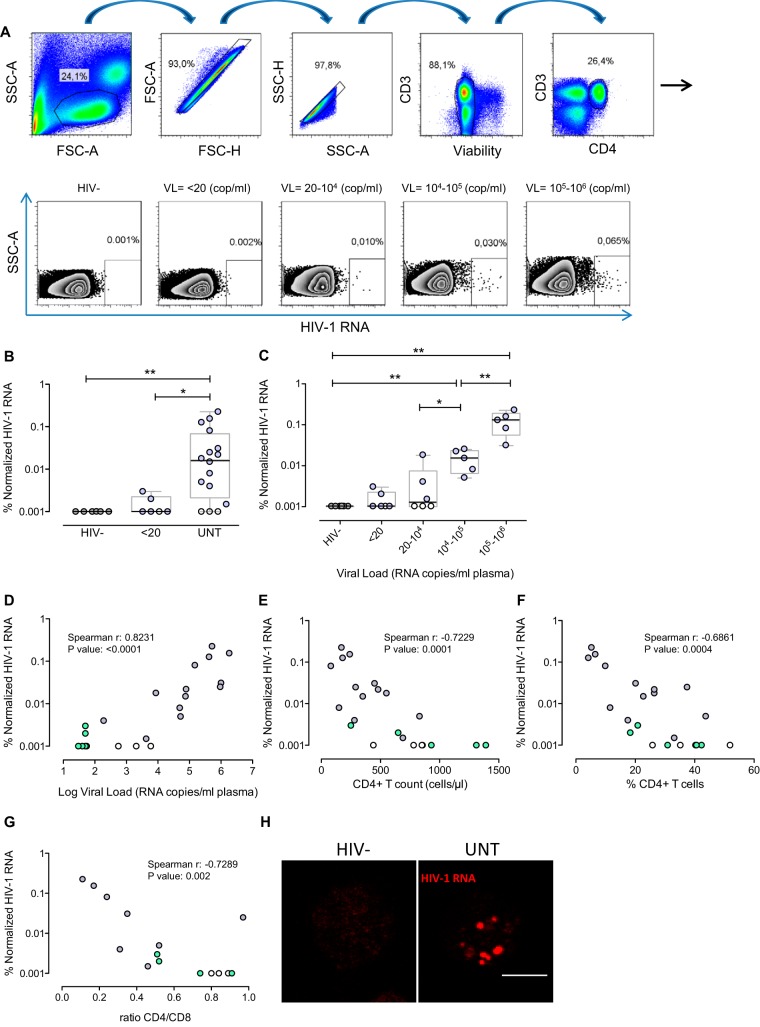
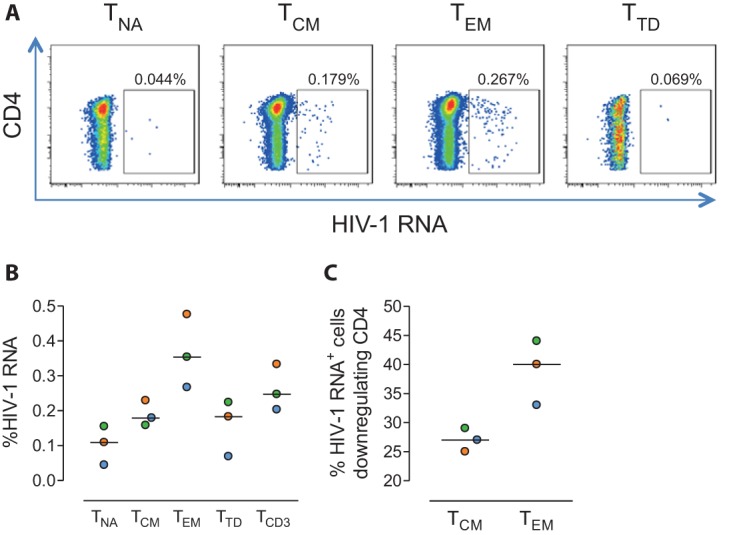
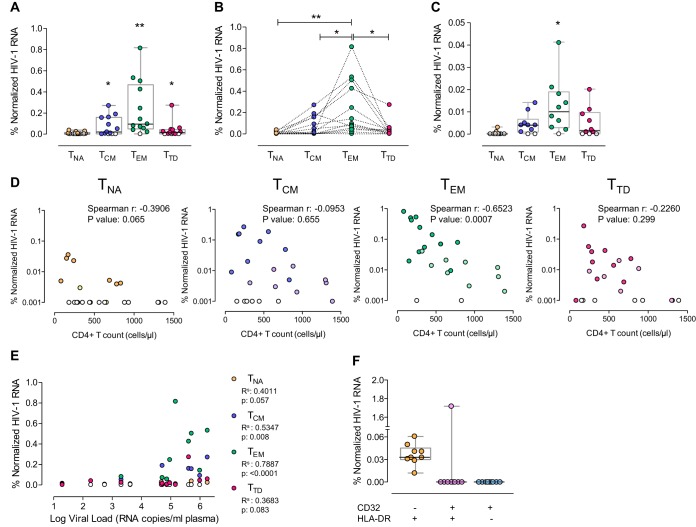
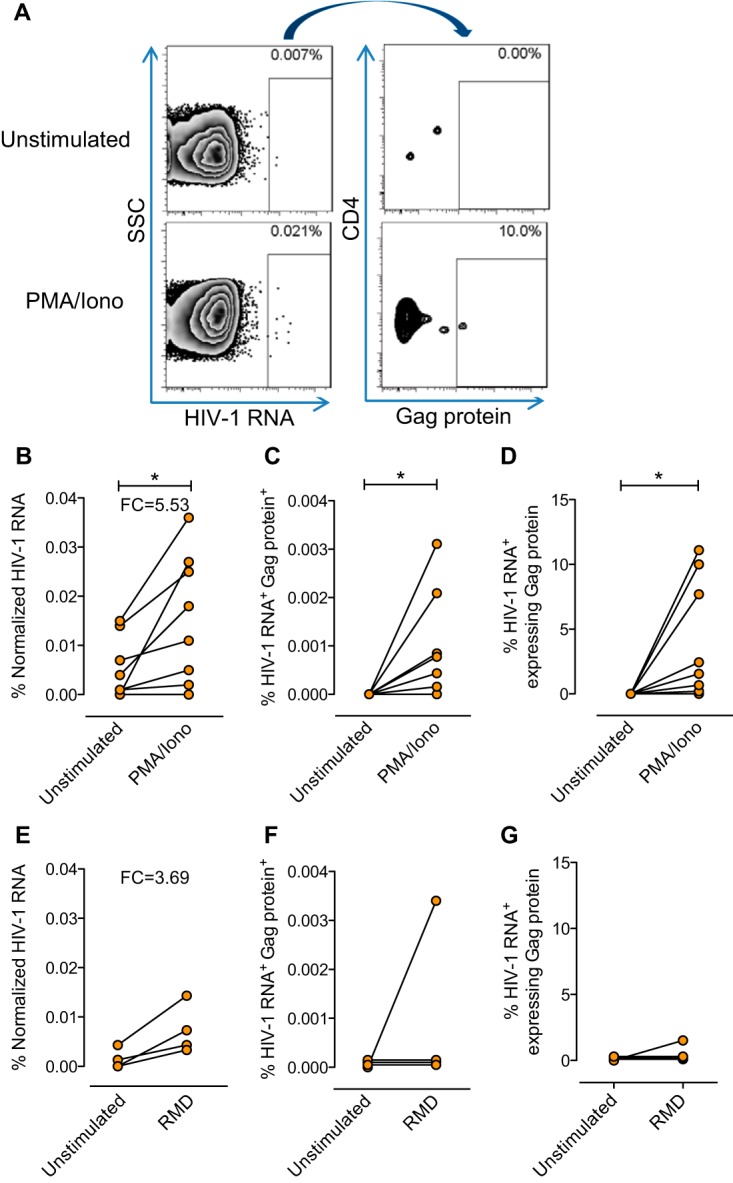
Cells that actively transcribe HIV-1 have been defined as the "active viral reservoir" in HIV-infected individuals. However, important technical limitations have precluded the characterization of this specific viral reservoir during both treated and untreated HIV-1 infections. Here, we used a novel single-cell RNA fluorescence in situ hybridization-flow cytometry (FISH-flow) assay that requires only 15 million unfractionated peripheral blood mononuclear cells (PBMCs) to characterize the specific cell subpopulations that transcribe HIV RNA in different subsets of CD4+ T cells. In samples from treated and untreated HIV-infected patients, effector memory CD4+ T cells were the main cell population supporting HIV RNA transcription. The number of cells expressing HIV correlated with the plasma viral load, intracellular HIV RNA, and proviral DNA quantified by conventional methods and inversely correlated with the CD4+ T cell count and the CD4/CD8 ratio. We also found that after ex vivo infection of unstimulated PBMCs, HIV-infected T cells upregulated the expression of CD32. In addition, this new methodology detected increased numbers of primary cells expressing viral transcripts and proteins after ex vivo viral reactivation with latency reversal agents. This RNA FISH-flow technique allows the identification of the specific cell subpopulations that support viral transcription in HIV-1-infected individuals and has the potential to provide important information on the mechanisms of viral pathogenesis, HIV persistence, and viral reactivation.IMPORTANCE Persons infected with HIV-1 contain several cellular viral reservoirs that preclude the complete eradication of the viral infection. Using a novel methodology, we identified effector memory CD4+ T cells, immune cells preferentially located in inflamed tissues with potent activity against pathogens, as the main cells encompassing the transcriptionally active HIV-1 reservoir in patients on antiretroviral therapy. Importantly, the identification of such cells provides us with an important target for new therapies designed to target the hidden virus and thus to eliminate the virus from the human body. In addition, because of its ability to identify cells forming part of the viral reservoir, the assay used in this study represents an important new tool in the field of HIV pathogenesis and viral persistence.

Keywords: human immunodeficiency virus; viral persistence; viral reactivation; viral reservoirs.


Figures

FIG 1
FIG 1
Detection of HIV transcripts and the viral Gag p24 protein in ex vivo-infected samples by the RNA FISH-flow assay. Unfractionated and unstimulated PBMCs from healthy donors were infected ex vivo with exogenous HIV strain NL4.3. Five days after the initial infection, cells were subjected to the RNA FISH-flow protocol. (A) The graphs on the left are representative flow cytometry plots of HIV transcript detection and CD4 downregulation in Gag p24+ T cells. The graphs on the right show the data summary of CD4 downregulation and the MFI (mean fluorescence intensity) of CD4 expression in cells expressing HIV RNA with and without production of the viral Gag p24 protein. (B) Left, representative flow cytometry plot of the dual staining of T cells for HIV RNA and Gag p24 protein. The graph on the right summaries the percentages of infection of the different combinations of cells costained for detection of HIV RNA and the viral Gag p24 protein in three different infected HIV-negative donors. (C) Left, representative flow cytometry plot of CD32 and HLA-DR coexpression in HIV-infected cells. Infected cells expressing only HIV RNA (red) or expressing viral RNA and Gag p24 protein (blue) are overlaid on the whole live-cell population (gray). The graph in the center shows the MFI of CD32 expression in cells expressing only viral RNA, cells expressing HIV RNA and p24, and uninfected T cells. The graph on the right shows the percentages of infected cells expressing CD32 and the HLA-DR markers.
FIG 2
FIG 2
Detection of CD4+ T cells expressing HIV RNA transcripts in primary samples from HIV-infected patients. Fifteen million PBMCs from healthy donors and HIV-1-infected patients were thawed and subjected to the RNA FISH-flow protocol for viral transcript detection without any previous cell stimulation. (A) Lymphocytes were gated by using the forward and side scatter areas (FSC and SSC, respectively), and the debris was excluded from the analysis. Cell doublets then were removed from the analysis (FSC-A versus FSC-H, followed by SSC-A versus SSC-H), and live cells were selected by live/dead staining. HIV RNA expression was identified in viable CD4+ T cells. Shown are representative flow cytometry plots of HIV RNA detection in CD4+ T cells from a uninfected person (HIV), an ART-treated patient (plasma viral load [VL] = <20 copies [cop]/ml;), and untreated (UNT) patients with different plasma VLs. (B) Summary data of normalized HIV RNA+ frequency in CD4+ T cells in uninfected controls (HIV; n = 6), patients treated with ART (plasma VL of <20 copies/ml; n = 6), and untreated patients (n = 16). (C) Frequency of HIV RNA detection stratified by plasma VLs. (D) Correlation of HIV RNA+ cells and plasma VLs. (E) Correlation of percent HIV RNA+ cells and absolute numbers of CD4+ T cells in blood. (F) Correlation of percent HIV RNA+ cells and percent CD4+ T cells determined by flow cytometry. (G) Correlation of percent HIV RNA+ cells and the CD4/CD8 ratio. (H) Representative micrographs obtained by confocal microscopy of cells from an HIV-negative donor (left) and an untreated HIV-infected patient (right) after the RNA FISH-flow protocol. Staining of HIV RNA transcripts is red. All HIV RNA+ percentages were normalized to those of uninfected donors (obtained by background subtraction) for each independent experiment. White symbols correspond to values below the limit of detection. In panels D to G, values for untreated patients are represented by gray symbols and values for treated patients are represented by green symbols. *, P < 0.05; **, P < 0.01 (Mann-Whitney test). Spearman’s nonparametric correlation coefficients and associated P values are shown. Data for patients 1 to 6 and 25 to 40 are shown in panels B to F; data for patients 1 to 6, 28 to 33, and 36 to 39 are shown in panel G; and data for patient 26 are shown in panel H (Table S1).
FIG 3
FIG 3
Detection of HIV RNA transcripts in different subsets of CD4+ T cells after ex vivo infection of PBMCs. Unfractionated and unstimulated PBMCs from healthy donors were infected ex vivo with exogenous HIV. Cells were subjected to the RNA FISH-flow protocol 5 days after infection. (A) Representative flow cytometry plots of HIV RNA-expressing cells in different subsets of CD4+ T cells (TNA, TCM, TEM, and TTD). (B) Quantification of HIV RNA+ cells in the different CD4+ T cell subsets of three different infected HIV-negative donors. (C) Percentages of HIV-expressing TEM and TCM cells that downregulate the CD4 receptor upon infection.
FIG 4
FIG 4
Identification of CD4+ T cell subsets supporting HIV expression in primary samples from HIV-infected patients. Fifteen million unfractionated and unstimulated PBMCs from HIV-infected patients were subjected to the RNA FISH-flow protocol for viral transcript detection in the different CD4+ T cell subsets (TNA, TCM, TEM, and TTD). (A) Frequencies of HIV RNA-expressing cells in different CD4+ T cell subpopulations of untreated patients (n = 13). The frequency of viral transcription in each subpopulation was compared with that of the HIV-negative control by using the Mann-Whitney test. (B) Paired comparison of HIV RNA+ cells in CD4+ T cell subsets of untreated patients (n = 13). The statistical values shown were obtained with the Wilcoxon signed-rank test with corrected P values for multiple comparisons. (C) Frequency of HIV RNA-expressing cells in CD4+ T cell subsets of treated patients with undetectable plasma viral loads (n = 10). (D) Spearman correlation of HIV RNA frequency in the different CD4+ T cell subpopulations and the absolute CD4+ T cell counts (n = 23). (E) Spearman correlation between plasma viral loads and the percentages of CD4+ T cells expressing HIV RNA in different subsets (n = 23). For all correlations, white symbols represent values below the limit of detection, symbols representing values for untreated patients are in dark colors, and symbols representing values for treated patients are in pale colors. (F) Frequencies of HIV RNA-expressing cells in CD4+ T cells expressing CD32 and HLA-DR. All normalized values were obtained after subtracting the corresponding background signal observed in the HIV-negative control. *, P < 0.05; **, P < 0.01. Data for patients 28 to 40 (Table S1) are shown in panels A and B; those for patients 1 to 6, 10, and 13 to 15 are shown in panel C; those for patients 1 to 6, 10, 13 to 15, and 28 to 40 are shown in panels D and E; and those for patients 7, 10, 11, 16 to 20, and 24 are shown in panel F.
FIG 5
FIG 5
Detection of HIV-1 RNA and Gag p24 protein in primary CD4+ T cells from HIV-infected patients after ex vivo reactivation. CD4+ T cells from treated HIV-infected patients were isolated with magnetic beads. Expression of HIV RNA and the viral Gag p24 protein was detected by the RNA FISH-flow technique after 13 h of reactivation with PMA-Iono or 24 h of reactivation with romidepsin. (A) Representative flow cytometry plots of cells from a treated patient before and after viral reactivation with PMA-Iono. Live cells were identified, and single HIV RNA-expressing cells gated against side scatter (SSC) are shown on the left. Percentages of HIV RNA+ cells that were Gag p24+ are shown on the right. (B, C) Comparisons of HIV-1 RNA+ single cells after viral reactivation with PMA-Iono (B) and HIV-1 RNA+ Gag+ doubly positive cell frequencies before and after viral reactivation (PMA-Iono) (C). (D) Frequencies of HIV-1 RNA+ single cells expressing Gag+ before and after stimulation with PMA-Iono. (E) Comparison of HIV-1 RNA+ single cells after viral activation with romidepsin. (F, G) Comparisons of HIV-1 RNA+ single cells after viral reactivation with romidepsin (F) and doubly positive cells HIV-1 RNA+ Gag+ frequencies before and after viral reactivation (romidepsin) (G). Cells from nine patients were treated with PMA-Iono (patients 5 and 7 to 13 are shown in panels B to D), and cells from four patients were treated with romidepsin (RMD) (patients 7 and 21 to 23 are shown in panels E to G). *, P < 0.05 (paired nonparametric t test). FC, fold change.

Similar articles

Cited by

References

    1. Siliciano RF, Greene WC. 2011. HIV latency. Cold Spring Harb Perspect Med 1:a007096. doi:10.1101/cshperspect.a007096. - DOI - PMC - PubMed
    1. Chun TW, Engel D, Berrey MM, Shea T, Corey L, Fauci AS. 1998. Early establishment of a pool of latently infected, resting CD4(+) T cells during primary HIV-1 infection. Proc Natl Acad Sci U S A 95:8869–8873. doi:10.1073/pnas.95.15.8869. - DOI - PMC - PubMed
    1. Palmer S, Maldarelli F, Wiegand A, Bernstein B, Hanna GJ, Brun SC, Kempf DJ, Mellors JW, Coffin JM, King MS. 2008. Low-level viremia persists for at least 7 years in patients on suppressive antiretroviral therapy. Proc Natl Acad Sci U S A 105:3879–3884. doi:10.1073/pnas.0800050105. - DOI - PMC - PubMed
    1. Chun TW, Justement JS, Murray D, Hallahan CW, Maenza J, Collier AC, Sheth PM, Kaul R, Ostrowski M, Moir S, Kovacs C, Fauci AS. 2010. Rebound of plasma viremia following cessation of antiretroviral therapy despite profoundly low levels of HIV reservoir: implications for eradication. AIDS 24:2803–2808. doi:10.1097/QAD.0b013e328340a239. - DOI - PMC - PubMed
    1. Wong JK, Hezareh M, Günthard HF, Havlir DV, Ignacio CC, Spina CA, Richman DD. 1997. Recovery of replication-competent HIV despite prolonged suppression of plasma viremia. Science 278:1291–1295. doi:10.1126/science.278.5341.1291. - DOI - PubMed

Publication types

MeSH terms