. 2017 Jun 1;31(11):1095-1108.
doi: 10.1101/gad.284661.116. Epub 2017 Jul 11.

Neat1 is a p53-inducible lincRNA essential for transformation suppression

Affiliations

Neat1 is a p53-inducible lincRNA essential for transformation suppression

Stephano S Mello et al. Genes Dev. .

Abstract

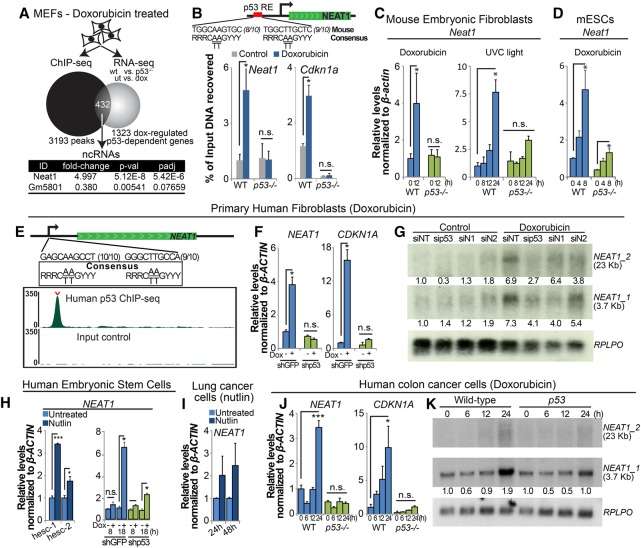
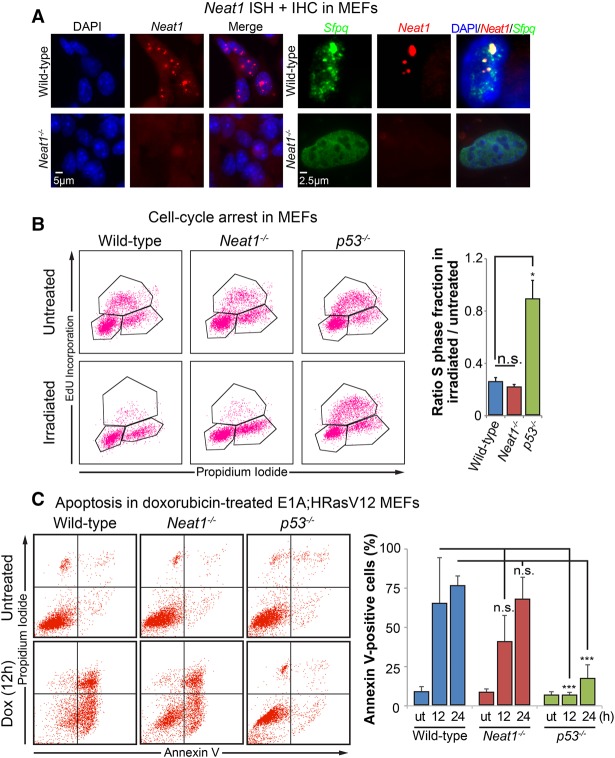
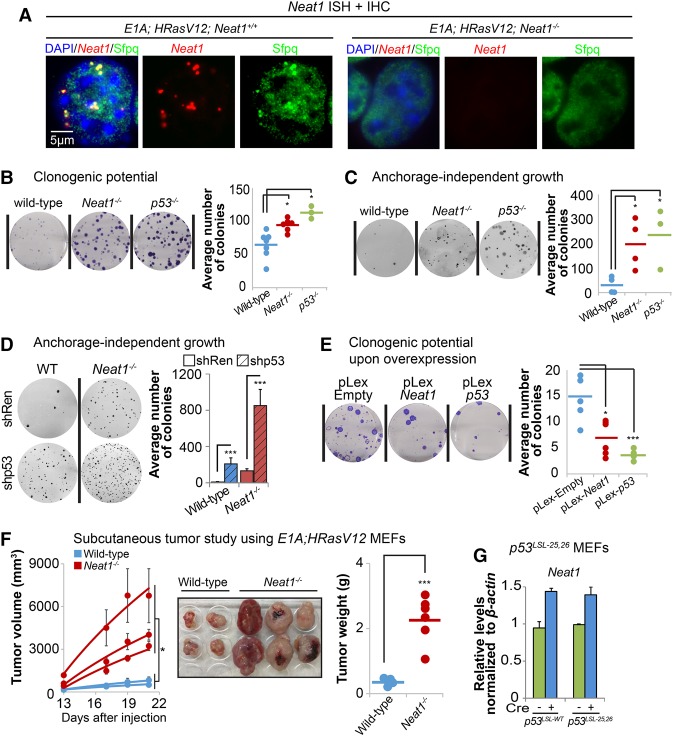
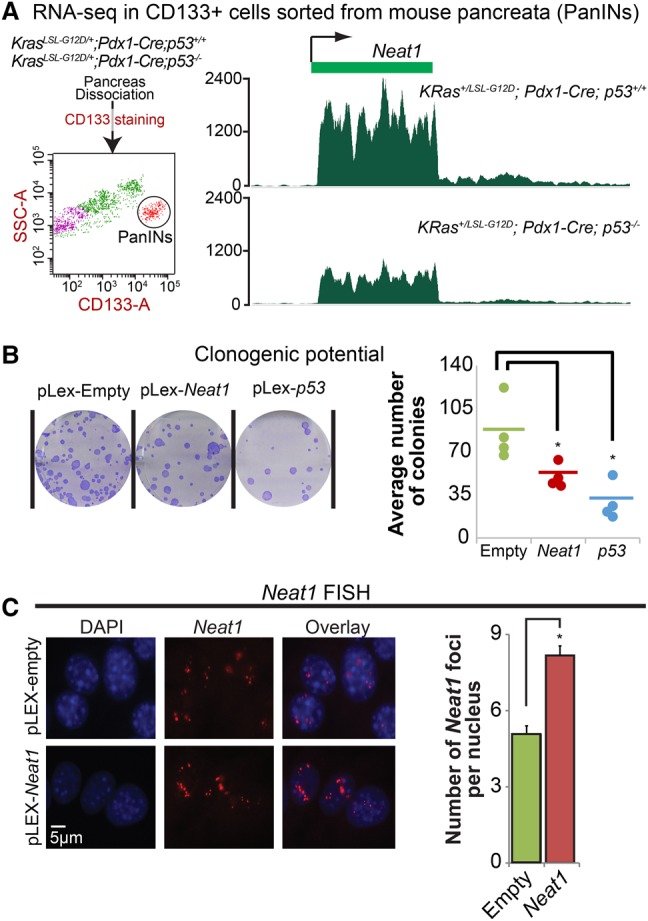
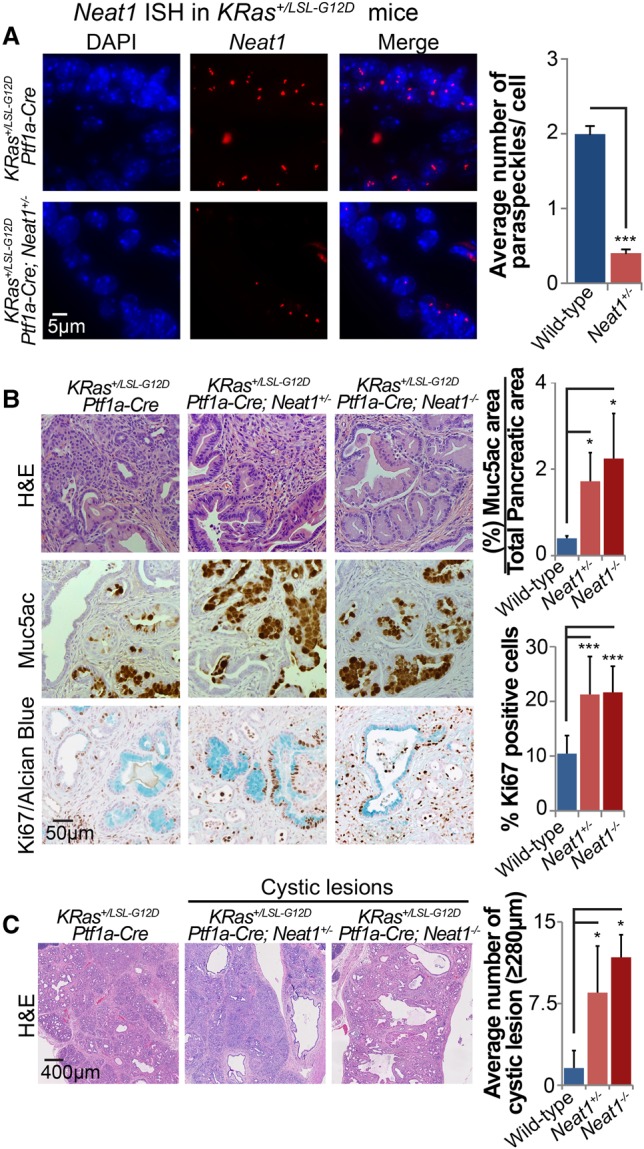
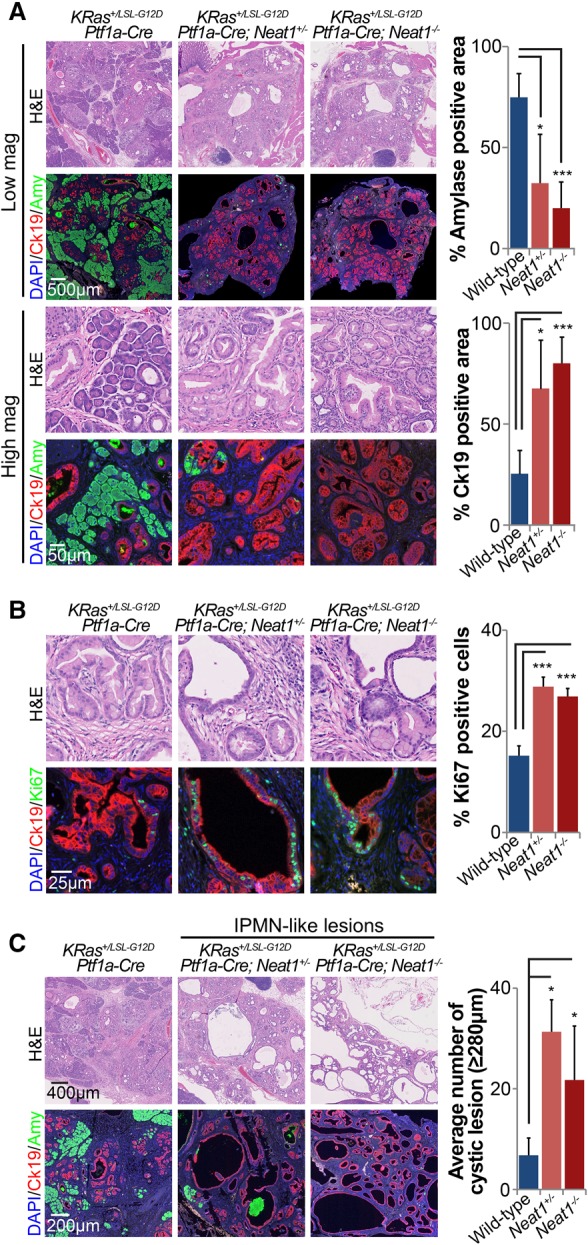
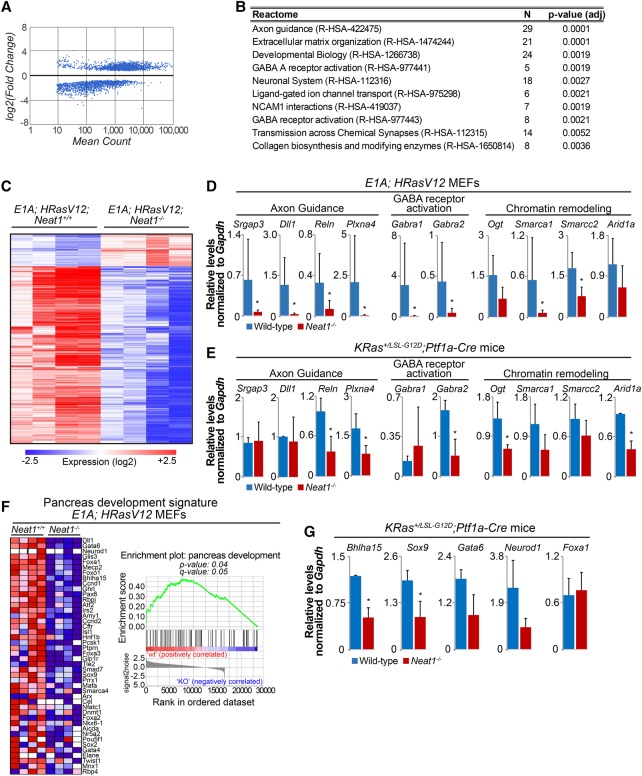
The p53 gene is mutated in over half of all cancers, reflecting its critical role as a tumor suppressor. Although p53 is a transcriptional activator that induces myriad target genes, those p53-inducible genes most critical for tumor suppression remain elusive. Here, we leveraged p53 ChIP-seq (chromatin immunoprecipitation [ChIP] combined with high-throughput sequencing) and RNA-seq (RNA sequencing) data sets to identify new p53 target genes, focusing on the noncoding genome. We identify Neat1, a noncoding RNA (ncRNA) constituent of paraspeckles, as a p53 target gene broadly induced by mouse and human p53 in different cell types and by diverse stress signals. Using fibroblasts derived from Neat1-/- mice, we examined the functional role of Neat1 in the p53 pathway. We found that Neat1 is dispensable for cell cycle arrest and apoptosis in response to genotoxic stress. In sharp contrast, Neat1 plays a crucial role in suppressing transformation in response to oncogenic signals. Neat1 deficiency enhances transformation in oncogene-expressing fibroblasts and promotes the development of premalignant pancreatic intraepithelial neoplasias (PanINs) and cystic lesions in KrasG12D-expressing mice. Neat1 loss provokes global changes in gene expression, suggesting a mechanism by which its deficiency promotes neoplasia. Collectively, these findings identify Neat1 as a p53-regulated large intergenic ncRNA (lincRNA) with a key role in suppressing transformation and cancer initiation, providing fundamental new insight into p53-mediated tumor suppression.

Keywords: Neat1; lincRNA; p53; pancreatic cancer; tumor suppression.


Figures

Figure 1.
Figure 1.
Neat1 is a p53 target gene in mouse and human cells. (A) Experimental outline that led to the discovery of Neat1 as a p53 target gene. Wild-type and p53−/− MEFs were either left untreated or treated with 0.2 µg/mL doxorubicin for 6 h to generate a list of doxorubicin-regulated p53-dependent RNAs using RNA-seq. Wild-type MEFs were also treated with doxorubicin for 6 h prior to ChIP-seq analysis (Kenzelmann-Broz et al. 2013). Four-hundred-thirty-two genes bound and regulated by p53 were defined, and the annotation of long ncRNAs among these pinpointed Neat1 as a novel p53-inducible target gene. (B) ChIP-qPCR testing for p53 binding at a peak identified in Neat1 by ChIP-seq analysis together with Cdkn1a as a positive control. The percentage of immunoprecipitated DNA relative to input is indicated. p53−/− MEFs served as a negative control. (C) qRT–PCR analysis of Neat1 expression in wild-type and p53−/− MEFs treated with 0.2 µg/mL doxorubicin (left) or 20 J/m2 UV light (right) and collected at the indicated time points, normalized to β-actin. (D) qRT–PCR analysis of Neat1 expression in mouse ESCs treated with 0.2 µg/mL doxorubicin for the indicated times, normalized to β-actin. (E) Human p53 ChIP-seq profiles (Younger et al. 2015) in primary human fibroblasts reveal a strong p53-binding site in the promoter of NEAT1. The top track shows the p53 ChIP sample, with the carat indicating the “called” peak as determined by DNANexus. The bottom track shows ChIP-seq input reads. The numbers in parentheses indicate the numbers of base pairs in individual half-sites matching the consensus sequence. (F) qRT–PCR analysis of NEAT1 and CDKN1A in primary human fibroblasts expressing shGFP or shp53 8 h after initiating doxorubicin treatment, normalized to β-ACTIN. (G) Northern blot of doxorubicin-treated (for 24 h) primary human fibroblasts transfected with a scrambled siRNA (siNT), sip53, or either of two different siRNAs against NEAT1 (siN1 and siN2). The numbers below the blots correspond to the expression levels normalized to the RPLPO loading control. (H, left) NEAT1 expression levels by qRT–PCR in two different human ESCs treated with Nutlin3a for 2 d, normalized to β-ACTIN. (Right) NEAT1 expression levels by qRT–PCR in human ESCs expressing shGFP or shp53 and left untreated or treated with doxorubicin for the indicated times, normalized to β-ACTIN. (I) NEAT1 expression levels by qRT–PCR in human A549 lung cancer cells treated with Nutlin3a for 1 or 2 d, normalized to β-ACTIN. (J) qRT–PCR analysis of NEAT1 and CDKN1A in wild-type and p53-null HCT116 cells treated with 0.2 µg/mL doxorubicin for different times, normalized to β-ACTIN. (K) Northern blot of wild-type and p53-null HCT116 cells after doxorubicin treatment for different lengths of time. RPLPO serves as a loading control. The numbers below the blots correspond to the expression levels normalized to RPLPO. Error bars represent ±SD. (*) P ≤ 0.05; (***) P ≤ 0.001; (n.s.) nonsignificant, based on the two-tailed unpaired Student's t-test.
Figure 2.
Figure 2.
Neat1 is dispensable for p53 acute DNA damage responses. (A, left) RNA-FISH using a Quasar 570-labeled complex probe against Neat1 to examine paraspeckles in wild-type and Neat1−/− primary MEFs. Nuclei were stained with DAPI. (Right) High-magnification detail of RNA-FISH against Neat1 (using a Quasar 570-labeled probe) and immunostaining of the paraspeckle protein Sfpq in wild-type and Neat1−/− primary MEFs. Nuclei were stained with DAPI. (B) Cell cycle arrest analysis in MEFs of different genotypes. (Left) Representative FACS analyses of 5-ethynyl-2 deoxyuridine (EdU)-incorporating and propidium iodide (PI)-stained untreated and irradiated (5 Gy) MEFs of different genotypes. (Right) Quantification of G1 arrest response in MEFs, indicated by the ratio of the S-phase fraction in irradiated cells to the S-phase fraction in untreated cells. n = 3. (C) Apoptosis analysis in MEFs of different genotypes. (Left) Representative FACS analyses of Annexin V and PI staining in E1A;HRasV12 MEFs of each genotype. (Right) Quantification of Annexin V-positive E1A;HRasV12 MEFs of different genotypes (wild type, Neat1−/−, and p53−/−) after being either left untreated (ut) or treated with 0.2 µg/mL doxorubicin for 12 or 24 h. n = 6. At least two different MEF lines were used in these experiments. Error bars represent ±SD. (*) P ≤ 0.05; (***) P ≤ 0.001; (n.s.) nonsignificant, based on the two-tailed unpaired Student's t-test.
Figure 3.
Figure 3.
Neat1 suppresses transformation in oncogene-expressing MEFs. (A) RNA-FISH against Neat1 (using a Quasar 570-labeled probe) and immunostaining of the paraspeckle protein Sfpq in E1A;HRasV12 and E1A;HRasV12;Neat1−/− MEFs. Nuclei were stained with DAPI. (B) Clonogenic potential of E1A;HRasV12 MEFs of different genotypes (wild type, Neat1−/−, and p53−/−) assayed using a low-density plating assay. Colonies were stained with crystal violet. (Left) Representative wells from clonogenic assays are shown. (Right) Dots represent average colony numbers from triplicate samples, integrating results from three different experiments using two to four different MEF lines per genotype. (C) Anchorage-independent growth of E1A;HRasV12 MEFs of different genotypes (wild type, Neat1−/−, and p53−/−) in a soft agar colony assay. Colonies were stained with Giemsa. (Left) Representative wells are shown. (Right) Dots represent average colony numbers from triplicate samples. Two independent experiments using two to four MEF lines per genotype were performed. (D) Anchorage-independent growth of E1A;HRasV12 MEFs of different genotypes (wild type and Neat1−/−) upon the introduction of control shRNA or shRNA against p53. Colonies were stained with Giemsa. (Left) Representative wells are shown. (Right) Dots represent average colony numbers for triplicate samples from two independent experiments using two MEF lines per genotype. (E) Clonogenic potential of E1A;HRasV12; p53−/− MEFs after Neat1 or p53 overexpression. pLex-empty served as a negative control. (Left) Representative wells from clonogenic assays are shown. (Right) Dots represent average colony number for triplicate samples from two independent experiments. Independent experiments for BE were performed with both different MEF lines and some MEF lines multiple times to ensure both repetition and representation by multiple MEF lines. (F, left) Average tumor volumes as a function of time in Scid mice injected with E1A;HRasV12-expressing wild-type and Neat1−/− MEFs. The dots represent the average of tumors from the left and right flanks of a given animal. Two different E1A;HRasV12;Neat1+/+ and three different E1A;HRasV12;Neat1−/− MEF lines were used, totaling four and six tumors of each genotype, respectively. (Middle) Images of the tumors at the end of the experiment, 22 d after injection. (Right) Tumor weight at day 22. (G) Neat1 expression levels by qRT–PCR in homozygous p53LSL-wt and p53LSL-25,26 primary MEFs upon adeno-Cre-induced reactivation of p53, normalized to β-actin. Error bars represent ±SD. (*) P ≤ 0.05; (***) P ≤ 0.001, based on the two-tailed unpaired Student's t-test.
Figure 4.
Figure 4.
Neat1 is associated with suppression of pancreatic cancer cell growth. (A) Tracks representing Neat1 expression levels in RNA-seq data from CD133+ FACS-sorted mouse pancreata from KRas+/LSL-G12D;Pdx1-Cre;p53+/+ mice (top) and KRas+/LSL-G12D;Pdx1-Cre;p53−/− mice (bottom). (B) Clonogenic potential of a PDAC cell line derived from KRasG12D;Pdx1-Cre;p53fl/fl mice after Neat1 or p53 overexpression. pLex-empty served as a negative control. (Left) Representative wells from clonogenic assays are shown. (Right) Dots indicate average colony number of triplicates from each independent experiment. n = 4. (*) P < 0.05, based on the two-tailed unpaired Student's t-test. (C) RNA-FISH for Neat1 in p53-null PDAC cells after empty vector or Neat1 transduction. (Left) Representative RNA-FISH images for Neat1. Nuclei were stained with DAPI. (Right) Average number of Neat1 foci ± SEM per nucleus. (*) P ≤ 0.05, based on the two-tailed unpaired Student's t-test.
Figure 5.
Figure 5.
Neat1 suppresses pancreatic cancer initiation in vivo upon pancreatitis. (A) RNA-FISH for Neat1 in pancreas sections of cerulein-treated KRas+/LSL-G12D;Ptf1a-Cre;Neat1+/+ and KRas+/LSL-G12D;Ptf1a-Cre;Neat1+/− mice. (Left) Representative RNA-FISH images for Neat1. Nuclei were stained with DAPI. (Right) Average Neat1 foci ± SD per nucleus (B) Pancreas histology of KRas+/LSL-G12D;Ptf1a-Cre;Neat1+/+ (n = 13), Kras+/LSL-G12D;Ptf1a-Cre;Neat1+/− (n = 6), and Kras+/LSL-G12D;Ptf1a-Cre;Neat1−/− (n = 4) mice with acute pancreatitis 7 d after cerulein treatment. (Left) Representative hematoxylin and eosin (H&E), Muc5ac (PanIN marker), and Ki67/Alcian blue costaining (markers of proliferation and PanINs, respectively) of pancreata from cerulein-treated cohorts. (Top right) Average PanIN area ± SD as a percentage of total pancreas area, as determined by Muc5ac quantification. (Bottom right) Average percentage ± SD of proliferating PanIN cells per mouse pancreas, as determined by the counting of at least 1000 Alcian blue cells. (C, left) Representative low-magnification H&E staining of pancreata from cerulein-treated cohorts, evidencing large cystic lesions reminiscent of human IPMN lesions. (Right) Average number of cystic lesions per mouse ± SD. Cystic lesions are defined by size criteria (diameter ≥280 µm). (*) P ≤ 0.05; (***) P ≤ 0.001, based on the two-tailed unpaired Student's t-test.
Figure 6.
Figure 6.
Neat1 suppresses pancreatic cancer initiation in vivo in aging mice. (A) Pancreas histology of 5-mo-old KRas+/LSL-G12D;Ptf1a-Cre;Neat1+/+ (n = 5), Kras+/LSL-G12D;Ptf1a-Cre;Neat1+/− (n = 3), and Kras+/LSL-G12D;Ptf1a-Cre;Neat1−/− (n = 4) mice. (Left) Representative H&E, amylase + Ck19 double-immunofluorescence staining (specific markers of acinar cells and epithelial cells of ductal origin, respectively) of pancreata from aged cohorts. (Right) Average amylase and Ck19-positive areas ± SD as a percentage of total pancreas area. (B, left) Representative H&E and Ck19 + Ki67 staining (markers of epithelial lesions and proliferation, respectively) of pancreata from aged cohorts. (Right) Percentage ± SD of proliferating Ck19-positive epithelial cells, as determined by counting at least 1000 cells. (C, left) Representative low-magnification H&E staining and amylase + Ck19 double-immunofluorescence staining of pancreata from aged cohorts, evidencing large cystic lesions reminiscent of human IPMN lesions. (Right) Average number of cystic lesions per mouse ± SD. Cystic lesions are defined by size criteria (diameter ≥280 µm) ± SD. (*) P ≤ 0.05; (***) P ≤ 0.001, based on the two-tailed unpaired Student's t-test.
Figure 7.
Figure 7.
Neat1 deficiency triggers global gene expression program changes. (A) Scatter plot of the log2 (fold-change) versus the mean reads count per gene, generated using RNA-seq expression profiling data from E1A;HRasV12;wild-type and E1A;HRasV12;Neat1−/− MEFs. The dots represent differentially expressed genes according to DEseq2 analysis. (B) Table with Reactome categories found down-regulated in E1A;HRasV12;Neat1−/− MEFs. (C) Heat map representing the expression of the top differentially expressed genes in E1A;HRasV12;wild-type and E1A;HRasV12;Neat1−/− MEFs. (D) qRT–PCR analysis of genes involved in axon guidance, GABA receptor activation, and chromatin remodeling in E1A;HRasV12;wild-type and E1A;HRasV12;Neat1−/− MEFs, normalized to Gapdh. n = 6. (E) qRT–PCR analysis of expression of genes involved in axon guidance, GABA receptor activation, and chromatin remodeling in pancreata of KRas+/LSL-G12D;Ptf1a-Cre;Neat1+/+ and KRas+/LSL-G12D;Ptf1a-Cre;Neat1−/− mice 7 d after cerulein treatment, normalized to Gapdh. n = 2. (F) Gene set enrichment analysis heat map of genes contributing to enrichment (left) and enrichment plot of pancreas development genes differentially expressed in E1A;HRasV12;Neat1+/+ and E1A;HRasV12;Neat1−/− MEFs (right). False discovery rate is 0.052. (G) qRT–PCR analysis of pancreas development genes found differentially expressed in E1A;HRasV12 MEFs in pancreata of KRas+/LSL-G12D;Ptf1a-Cre;Neat1+/+ and KRas+/LSL-G12D;Ptf1a-Cre;Neat1−/− mice 7 d after cerulein treatment, normalized to Gapdh. (*) P ≤ 0.05, based on the one-tailed unpaired Student's t-test.

Comment in

  • Cancer biology: A Neat target of p53.
    Zlotorynski E. Zlotorynski E. Nat Rev Mol Cell Biol. 2017 Sep;18(9):532. doi: 10.1038/nrm.2017.80. Epub 2017 Aug 2. Nat Rev Mol Cell Biol. 2017. PMID: 28792010 No abstract available.

Similar articles

Cited by

References

    1. Adriaens C, Standaert L, Barra J, Latil M, Verfaillie A, Kalev P, Boeckx B, Wijnhoven PWG, Radaelli E, Vermi W, et al. 2016. p53 induces formation of NEAT1 lncRNA-containing paraspeckles that modulate replication stress response and chemosensitivity. Nat Med 22: 861–868. - PubMed
    1. Amankwah EK, Thompson RC, Nabors LB, Olson JJ, Browning JE, Madden MH, Egan KM. 2013. SWI/SNF gene variants and glioma risk and outcome. Cancer Epidemiol 37: 162–165. - PMC - PubMed
    1. Arda HE, Benitez CM, Kim SK. 2013. Gene regulatory networks governing pancreas development. Dev Cell 25: 5–13. - PMC - PubMed
    1. Balakrishnan A, Penachioni JY, Lamba S, Bleeker FE, Zanon C, Rodolfo M, Vallacchi V, Scarpa A, Felicioni L, Buck M, et al. 2009. Molecular profiling of the ‘plexinome’ in melanoma and pancreatic cancer. Hum Mutat 30: 1167–1174. - PMC - PubMed
    1. Biankin AV, Waddell N, Kassahn KS, Gingras M-C, Muthuswamy LB, Johns AL, Miller DK, Wilson PJ, Patch A-M, Wu J, et al. 2012. Pancreatic cancer genomes reveal aberrations in axon guidance pathway genes. Nature 491: 399–405. - PMC - PubMed

Publication types

Substances