

Heme Modification Contributes to the Mechanism-Based Inactivation of Human Cytochrome P450 2J2 by Two Terminal Acetylenic Compounds
- PMID: 28698302
- PMCID: PMC5539586
- DOI: 10.1124/dmd.117.075846
Heme Modification Contributes to the Mechanism-Based Inactivation of Human Cytochrome P450 2J2 by Two Terminal Acetylenic Compounds
Abstract
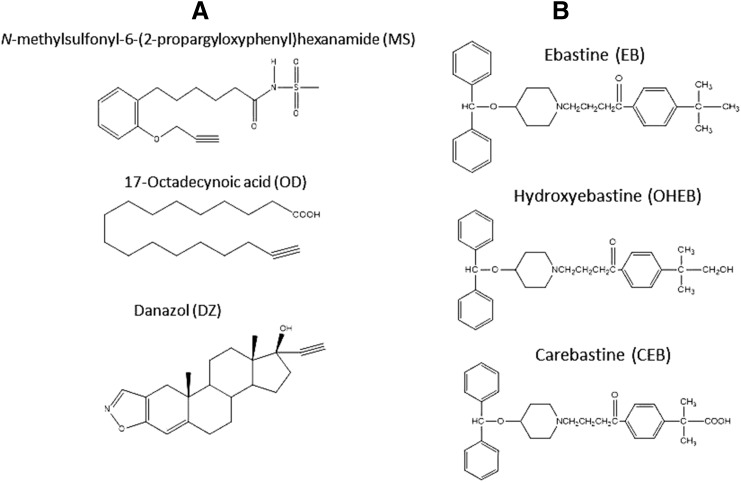
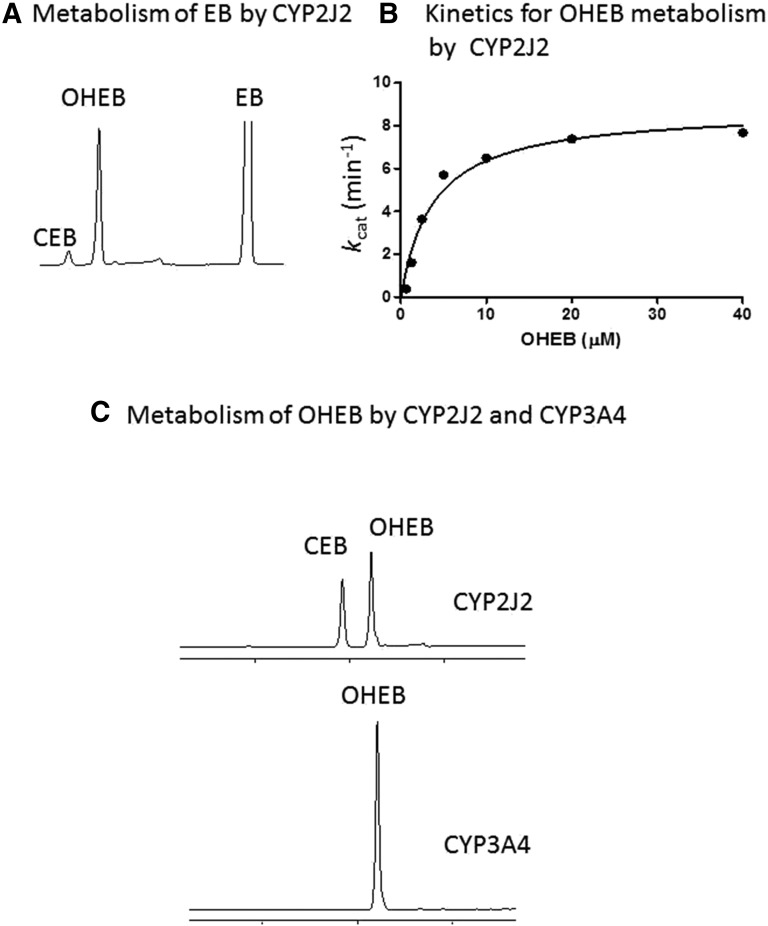
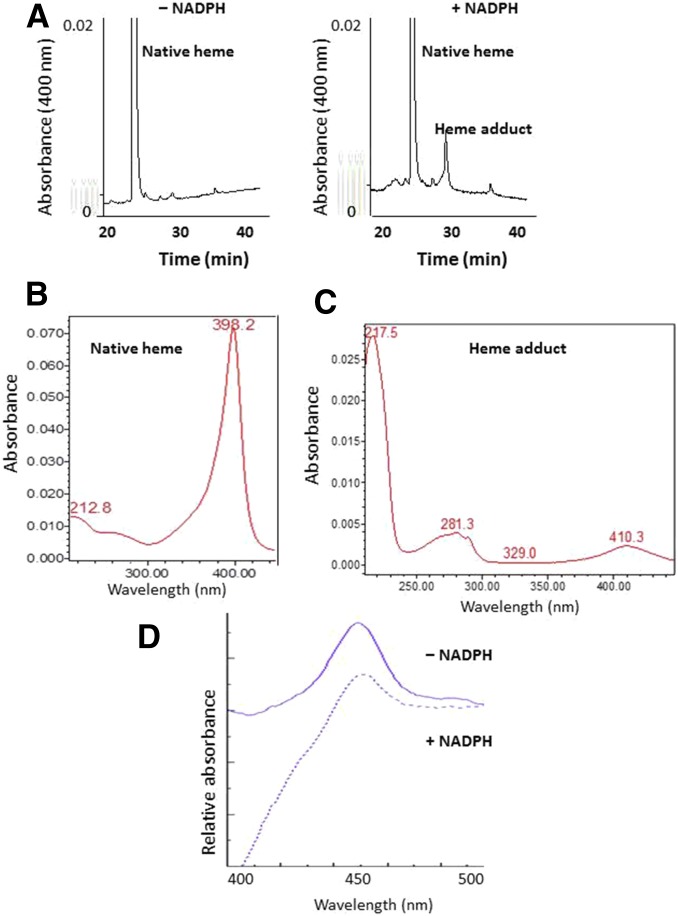
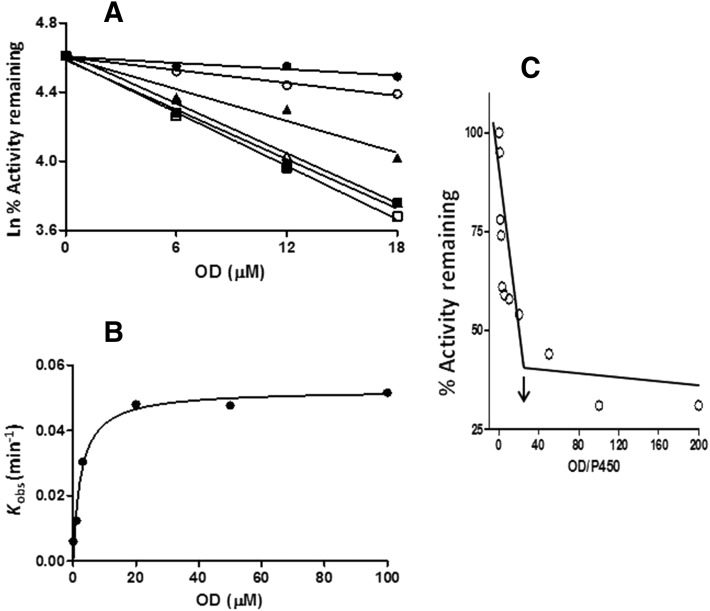
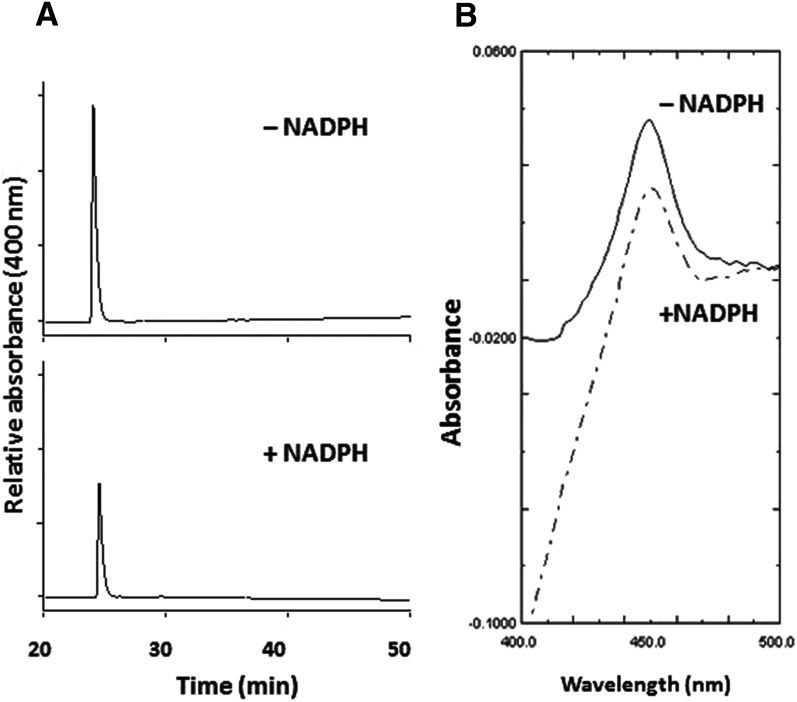
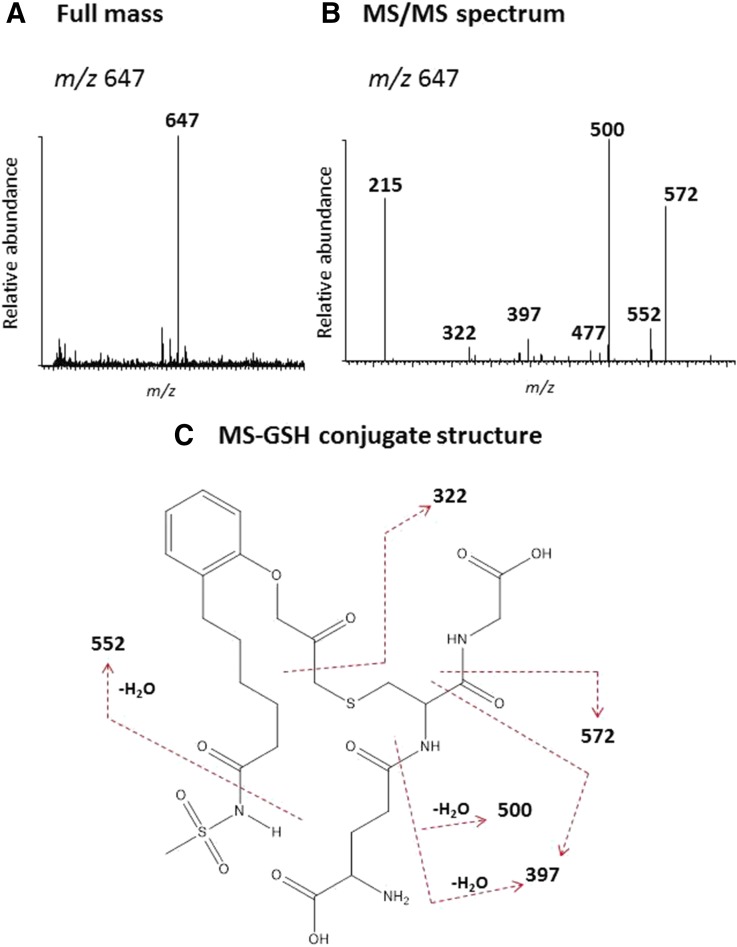
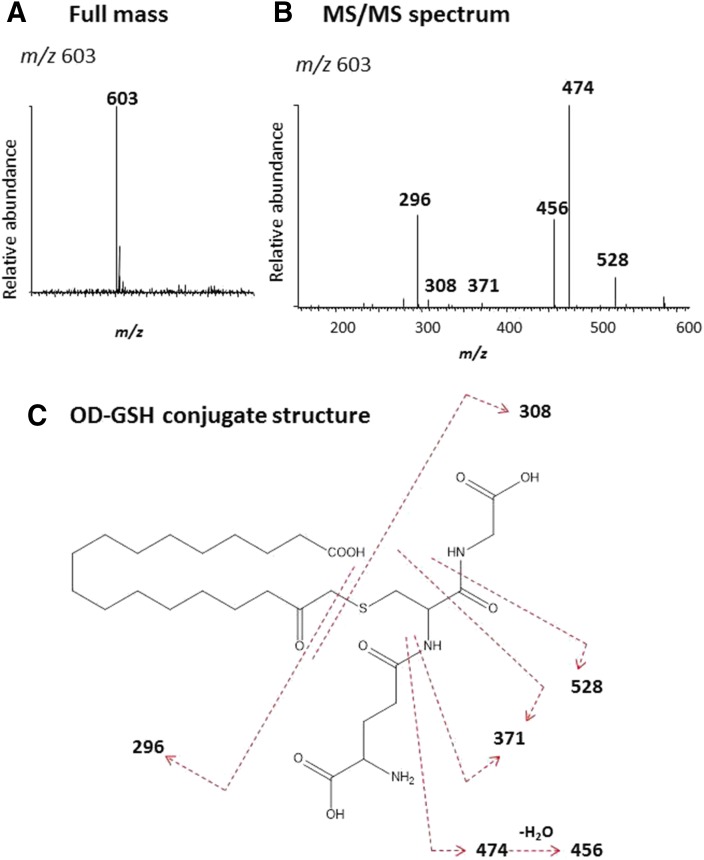
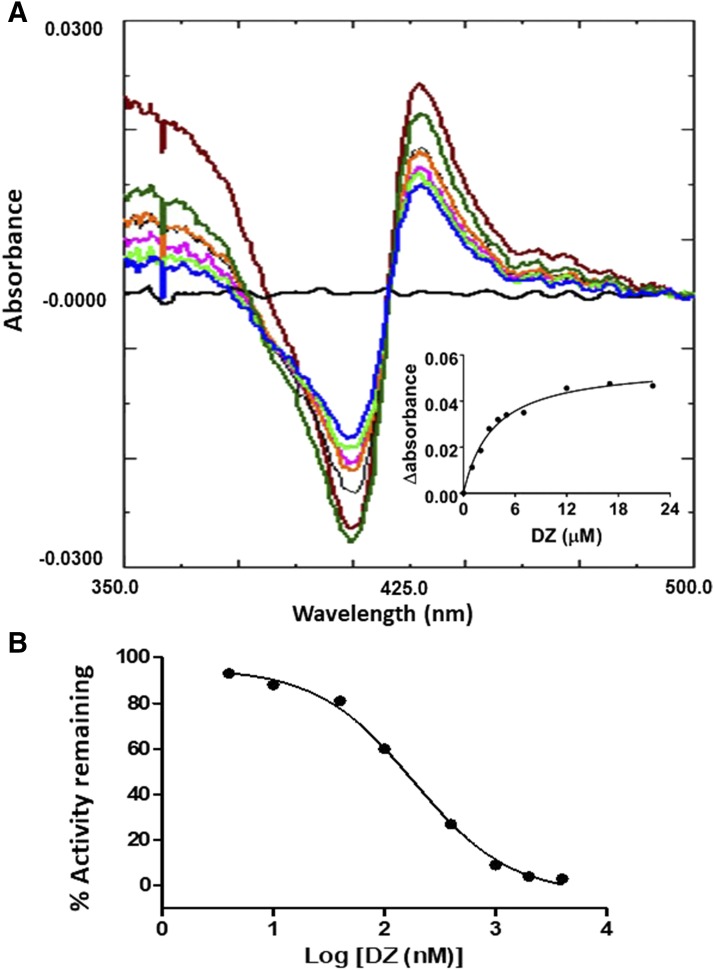
The mechanism-based inactivation of human CYP2J2 by three terminal acetylenic compounds: N-(methylsulfonyl)-6-(2-propargyloxyphenyl)hexanamide (MS), 17-octadecynoic acid (OD), and danazol (DZ) was investigated. The loss of hydroxyebastine (OHEB) carboxylation activity in a reconstituted system was time- and concentration-dependent and required NADPH for MS and OD, but not DZ. The kinetic constants for the mechanism-based inactivation of OHEB carboxylation activity were: KI of 6.1 μM and kinact of 0.22 min-1 for MS and KI of 2.5 μM and kinact of 0.05 min-1 for OD. The partition ratios for MS and OD were ∼10 and ∼20, respectively. Inactivation of CYP2J2 by MS or OD resulted in a loss of the native heme spectrum and a similar decrease in the reduced CO difference spectrum. A heme adduct was observed in the MS-inactivated CYP2J2. The possible reactive metabolite which covalently modified the prosthetic heme was characterized by analysis of the glutathione conjugates formed by MS or OD following oxygenation of the ethynyl moiety. Liquid chromatography-mass spectrometry showed that inactivation by MS or OD did not lead to modification of apoprotein. Interaction of CYP2J2 with DZ produced a type II binding spectrum with a Ks of 2.8 μM and the IC50 for loss of OHEB carboxylation activity was 0.18 μM. In conclusion, heme modification by MS and OD was responsible for the mechanism-based inactivation of CYP2J2. The results suggest that the ethynyl moiety of MS and OD faces the heme iron, whereas the isoxazole ring of DZ is preferentially oriented toward the heme iron of CYP2J2.
Copyright © 2017 by The American Society for Pharmacology and Experimental Therapeutics.
Figures

Similar articles
-
Formation of Both Heme and Apoprotein Adducts Contributes to the Mechanism-Based Inactivation of Human CYP2J2 by 17α-Ethynylestradiol.Drug Metab Dispos. 2018 Jun;46(6):813-822. doi: 10.1124/dmd.118.080903. Epub 2018 Mar 30. Drug Metab Dispos. 2018. PMID: 29602797 Free PMC article.
-
Acetylenes: cytochrome P450 oxidation and mechanism-based enzyme inactivation.Drug Metab Rev. 2019 May;51(2):162-177. doi: 10.1080/03602532.2019.1632891. Epub 2019 Jul 7. Drug Metab Rev. 2019. PMID: 31203694 Free PMC article. Review.
-
The inactivation of cytochrome P450 3A5 by 17alpha-ethynylestradiol is cytochrome b5-dependent: metabolic activation of the ethynyl moiety leads to the formation of glutathione conjugates, a heme adduct, and covalent binding to the apoprotein.J Pharmacol Exp Ther. 2007 Apr;321(1):276-87. doi: 10.1124/jpet.106.117861. Epub 2007 Jan 24. J Pharmacol Exp Ther. 2007. PMID: 17251390
-
Mechanism-based inactivation of CYP2B1 and its F-helix mutant by two tert-butyl acetylenic compounds: covalent modification of prosthetic heme versus apoprotein.J Pharmacol Exp Ther. 2009 Nov;331(2):392-403. doi: 10.1124/jpet.109.158782. Epub 2009 Aug 21. J Pharmacol Exp Ther. 2009. PMID: 19700628 Free PMC article.
-
Investigating the association between CYP2J2 inhibitors and QT prolongation: a literature review.Drug Metab Rev. 2024 Feb-May;56(2):145-163. doi: 10.1080/03602532.2024.2329928. Epub 2024 Mar 20. Drug Metab Rev. 2024. PMID: 38478383 Review.
Cited by
-
Role of Arginine 117 in Substrate Recognition by Human Cytochrome P450 2J2.Int J Mol Sci. 2018 Jul 16;19(7):2066. doi: 10.3390/ijms19072066. Int J Mol Sci. 2018. PMID: 30012976 Free PMC article.
-
Formation of Both Heme and Apoprotein Adducts Contributes to the Mechanism-Based Inactivation of Human CYP2J2 by 17α-Ethynylestradiol.Drug Metab Dispos. 2018 Jun;46(6):813-822. doi: 10.1124/dmd.118.080903. Epub 2018 Mar 30. Drug Metab Dispos. 2018. PMID: 29602797 Free PMC article.
-
Flipside of the Coin: Iron Deficiency and Colorectal Cancer.Front Immunol. 2021 Mar 11;12:635899. doi: 10.3389/fimmu.2021.635899. eCollection 2021. Front Immunol. 2021. PMID: 33777027 Free PMC article. Review.
-
Acetylenes: cytochrome P450 oxidation and mechanism-based enzyme inactivation.Drug Metab Rev. 2019 May;51(2):162-177. doi: 10.1080/03602532.2019.1632891. Epub 2019 Jul 7. Drug Metab Rev. 2019. PMID: 31203694 Free PMC article. Review.
References
-
- Baillie TA, Davis MR. (1993) Mass spectrometry in the analysis of glutathione conjugates. Biol Mass Spectrom 22:319–325. - PubMed
-
- Brand-Schieber E, Falck JF, Schwartzman M. (2000) Selective inhibition of arachidonic acid epoxidation in vivo. J Physiol Pharmacol 51:655–672. - PubMed
-
- CaJacob CA, Chan WK, Shephard E, Ortiz de Montellano PR. (1988) The catalytic site of rat hepatic lauric acid omega-hydroxylase. Protein versus prosthetic heme alkylation in the omega-hydroxylation of acetylenic fatty acids. J Biol Chem 263:18640–18649. - PubMed
-
- Chan WK, Sui Z, Ortiz de Montellano PR. (1993) Determinants of protein modification versus heme alkylation: inactivation of cytochrome P450 1A1 by 1-ethynylpyrene and phenylacetylene. Chem Res Toxicol 6:38–45. - PubMed
-
- Chaudhary KR, Batchu SN, Seubert JM. (2009) Cytochrome P450 enzymes and the heart. IUBMB Life 61:954–960. - PubMed
MeSH terms
Substances
Grants and funding
LinkOut - more resources
Full Text Sources
Other Literature Sources
Miscellaneous
