

Tissue-Specific Control of the Endocycle by the Anaphase Promoting Complex/Cyclosome Inhibitors UVI4 and DEL1
- PMID: 28698355
- PMCID: PMC5580769
- DOI: 10.1104/pp.17.00785
Tissue-Specific Control of the Endocycle by the Anaphase Promoting Complex/Cyclosome Inhibitors UVI4 and DEL1
Abstract
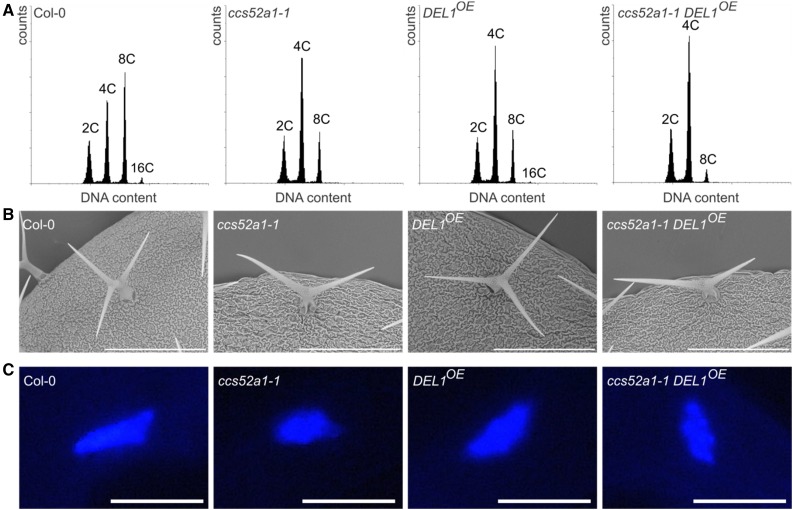
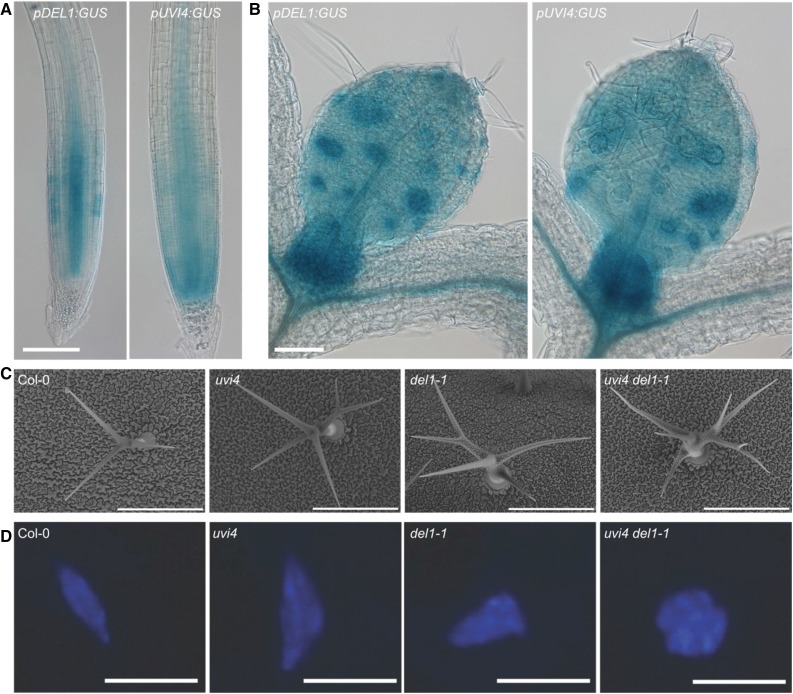
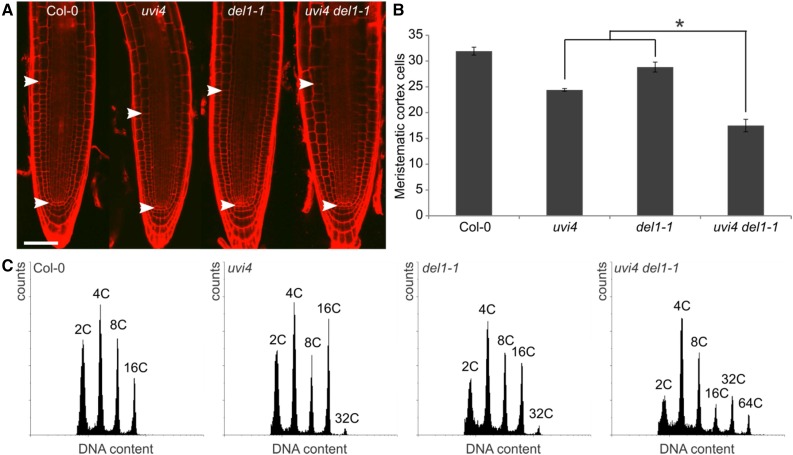
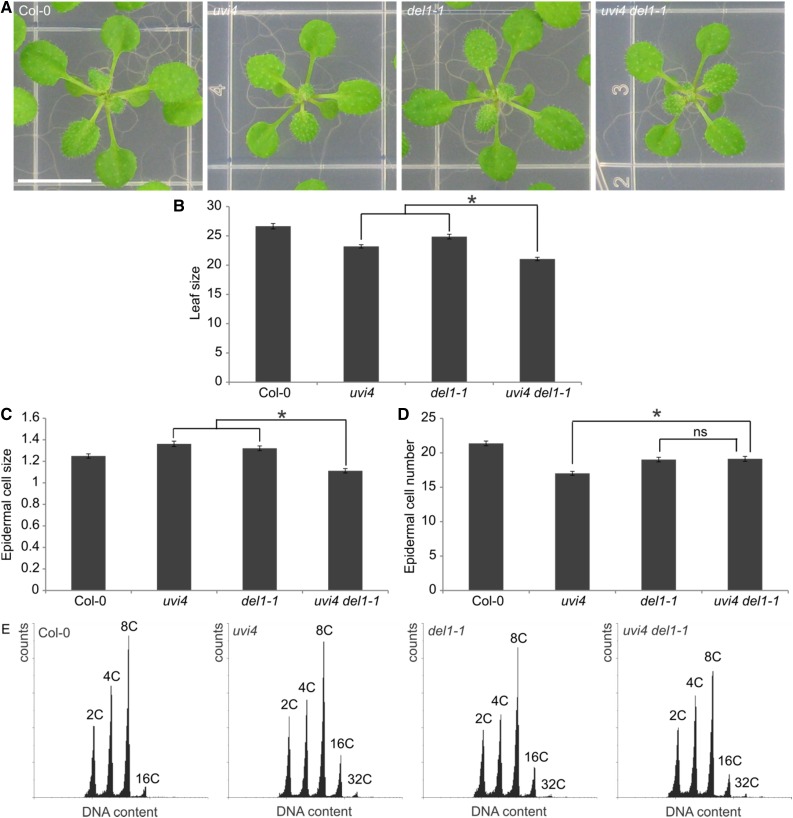
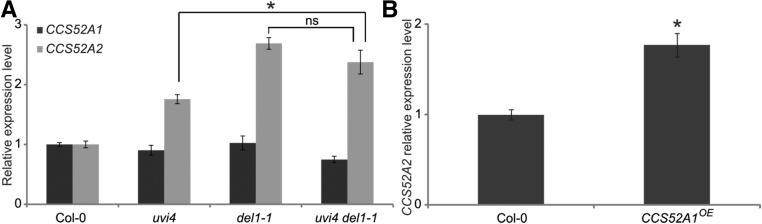
The endocycle represents a modified mitotic cell cycle that in plants is often coupled to cell enlargement and differentiation. Endocycle onset is controlled by activity of the Anaphase Promoting Complex/Cyclosome (APC/C), a multisubunit E3 ubiquitin ligase targeting cell-cycle factors for destruction. CELL CYCLE SWITCH52 (CCS52) proteins represent rate-limiting activator subunits of the APC/C. In Arabidopsis (Arabidopsis thaliana), mutations in either CCS52A1 or CCS52A2 activators result in a delayed endocycle onset, whereas their overexpression triggers increased DNA ploidy levels. Here, the relative contribution of the APC/CCCS52A1 and APC/CCCS52A2 complexes to different developmental processes was studied through analysis of their negative regulators, being the ULTRAVIOLET-B-INSENSITIVE4 protein and the DP-E2F-Like1 transcriptional repressor, respectively. Our data illustrate cooperative activity of the APC/CCCS52A1 and APC/CCCS52A2 complexes during root and trichome development, but functional interdependency during leaf development. Furthermore, we found APC/CCCS52A1 activity to control CCS52A2 expression. We conclude that interdependency of CCS52A-controlled APC/C activity is controlled in a tissue-specific manner.
© 2017 American Society of Plant Biologists. All Rights Reserved.
Figures

Similar articles
-
Arabidopsis ULTRAVIOLET-B-INSENSITIVE4 maintains cell division activity by temporal inhibition of the anaphase-promoting complex/cyclosome.Plant Cell. 2011 Dec;23(12):4394-410. doi: 10.1105/tpc.111.091793. Epub 2011 Dec 13. Plant Cell. 2011. PMID: 22167059 Free PMC article.
-
Atypical E2F activity restrains APC/CCCS52A2 function obligatory for endocycle onset.Proc Natl Acad Sci U S A. 2008 Sep 23;105(38):14721-6. doi: 10.1073/pnas.0806510105. Epub 2008 Sep 11. Proc Natl Acad Sci U S A. 2008. PMID: 18787127 Free PMC article.
-
Arabidopsis anaphase-promoting complexes: multiple activators and wide range of substrates might keep APC perpetually busy.Cell Cycle. 2005 Aug;4(8):1084-92. Epub 2005 Aug 18. Cell Cycle. 2005. PMID: 15970679
-
The Plant Anaphase-Promoting Complex/Cyclosome.Annu Rev Cell Dev Biol. 2022 Oct 6;38:25-48. doi: 10.1146/annurev-cellbio-120420-092421. Epub 2022 Apr 8. Annu Rev Cell Dev Biol. 2022. PMID: 35395166 Review.
-
The anaphase-promoting complex/cyclosome in control of plant development.Mol Plant. 2012 Nov;5(6):1182-94. doi: 10.1093/mp/sss094. Epub 2012 Oct 3. Mol Plant. 2012. PMID: 23034505 Review.
Cited by
-
The Tomato Guanylate-Binding Protein SlGBP1 Enables Fruit Tissue Differentiation by Maintaining Endopolyploid Cells in a Non-Proliferative State.Plant Cell. 2020 Oct;32(10):3188-3205. doi: 10.1105/tpc.20.00245. Epub 2020 Aug 4. Plant Cell. 2020. PMID: 32753430 Free PMC article.
-
The Cyclin CYCA3;4 Is a Postprophase Target of the APC/CCCS52A2 E3-Ligase Controlling Formative Cell Divisions in Arabidopsis.Plant Cell. 2020 Sep;32(9):2979-2996. doi: 10.1105/tpc.20.00208. Epub 2020 Jul 20. Plant Cell. 2020. PMID: 32690720 Free PMC article.
-
The Dynamic Genetic-Hormonal Regulatory Network Controlling the Trichome Development in Leaves.Plants (Basel). 2019 Jul 28;8(8):253. doi: 10.3390/plants8080253. Plants (Basel). 2019. PMID: 31357744 Free PMC article. Review.
-
Transcriptional Repression of the APC/C Activator Genes CCS52A1/A2 by the Mediator Complex Subunit MED16 Controls Endoreduplication and Cell Growth in Arabidopsis.Plant Cell. 2019 Aug;31(8):1899-1912. doi: 10.1105/tpc.18.00811. Epub 2019 Jun 7. Plant Cell. 2019. PMID: 31175173 Free PMC article.
-
Making Epidermal Bladder Cells Bigger: Developmental- and Salinity-Induced Endopolyploidy in a Model Halophyte.Plant Physiol. 2018 Jun;177(2):615-632. doi: 10.1104/pp.18.00033. Epub 2018 May 3. Plant Physiol. 2018. PMID: 29724770 Free PMC article.
References
-
- Baloban M, Vanstraelen M, Tarayre S, Reuzeau C, Cultrone A, Mergaert P, Kondorosi E (2013) Complementary and dose-dependent action of AtCCS52A isoforms in endoreduplication and plant size control. New Phytol 198: 1049–1059 - PubMed
-
- Beemster GTS, Vercruysse S, De Veylder L, Kuiper M, Inzé D (2006) The Arabidopsis leaf as a model system for investigating the role of cell cycle regulation in organ growth. J Plant Res 119: 43–50 - PubMed
MeSH terms
Substances
LinkOut - more resources
Full Text Sources
Other Literature Sources
Molecular Biology Databases
