. 2017 Aug 1;114(31):E6400-E6409.
doi: 10.1073/pnas.1705551114. Epub 2017 Jul 11.

A distinct subpopulation of CD25- T-follicular regulatory cells localizes in the germinal centers

Affiliations

A distinct subpopulation of CD25- T-follicular regulatory cells localizes in the germinal centers

James Badger Wing et al. Proc Natl Acad Sci U S A. .

Abstract

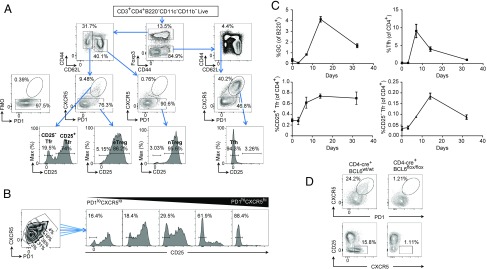
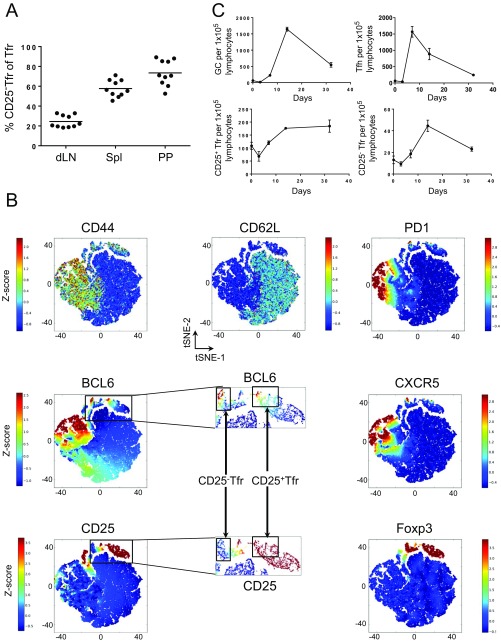
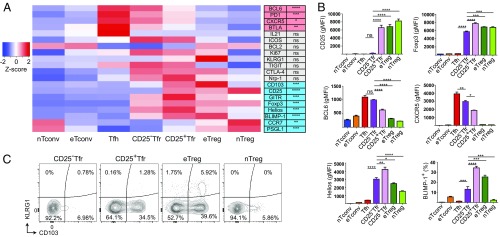
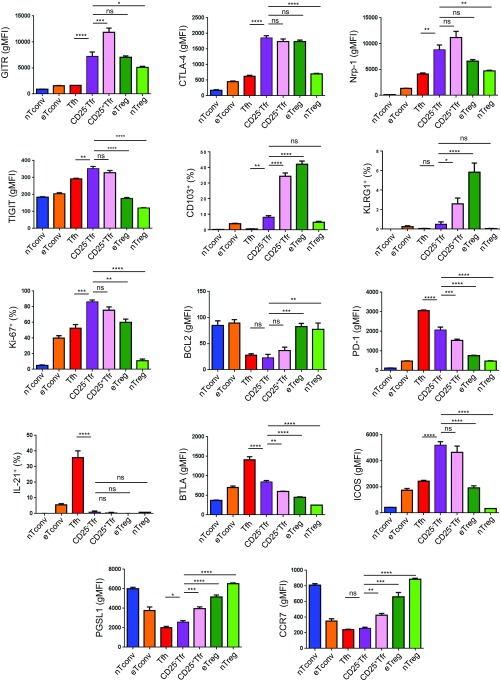
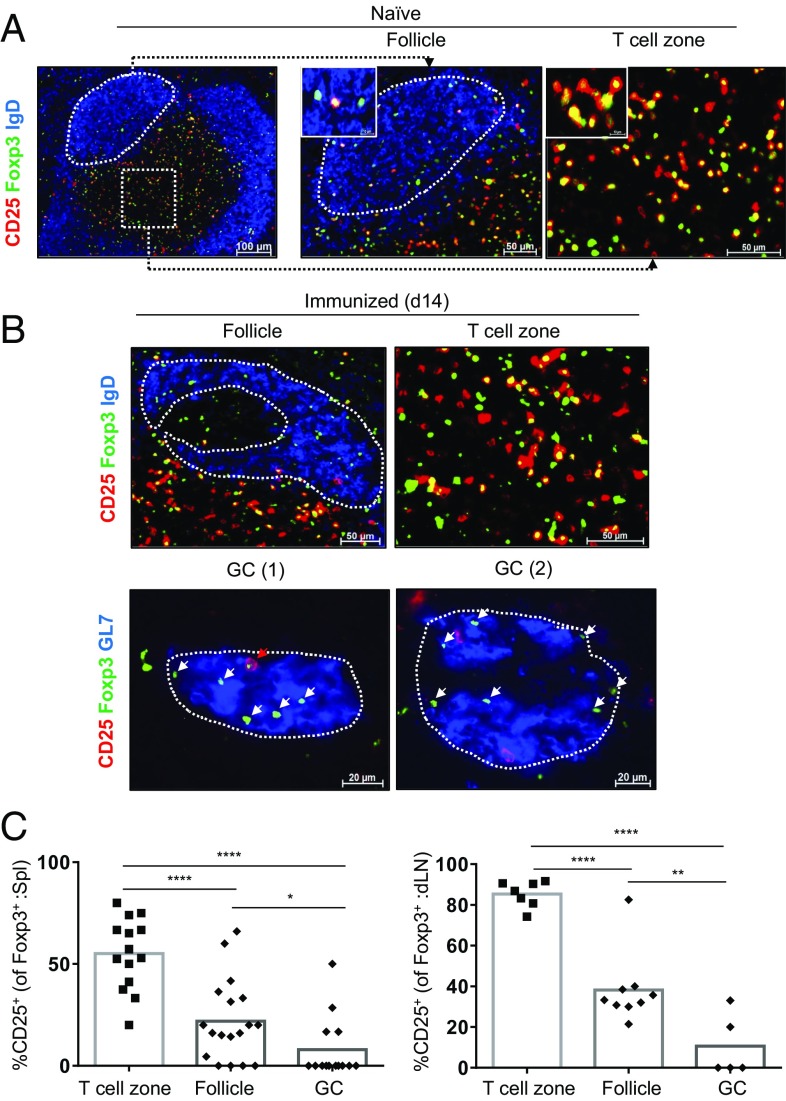
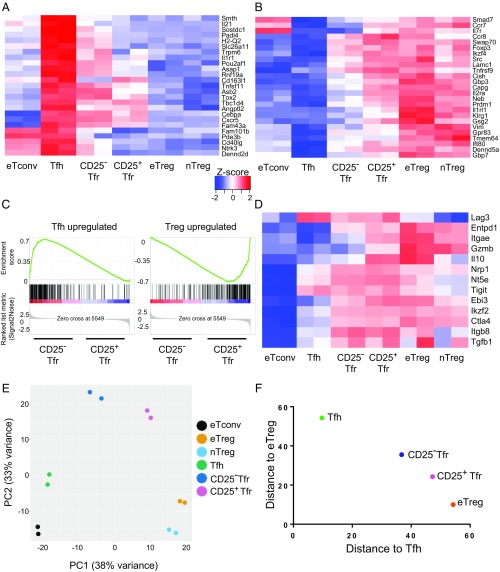
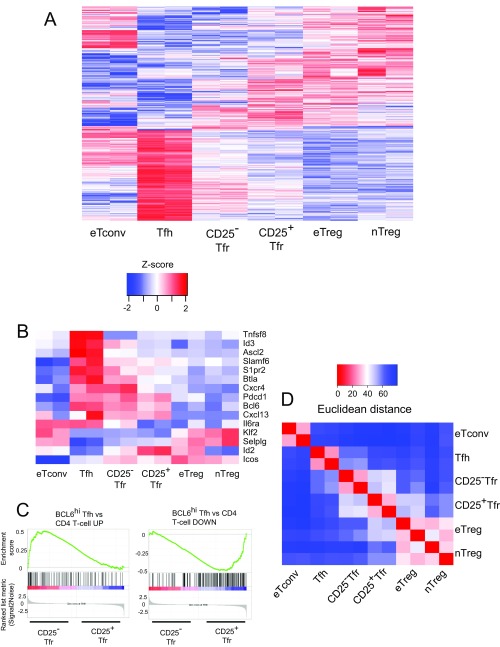
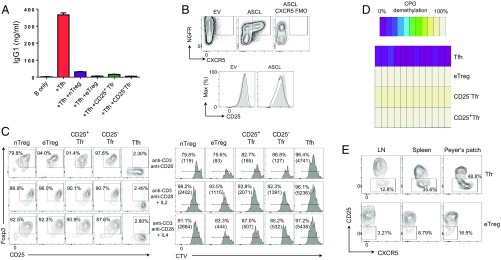
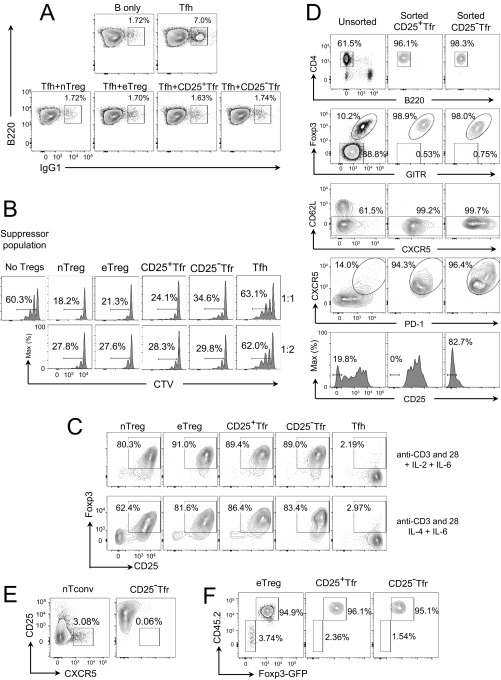
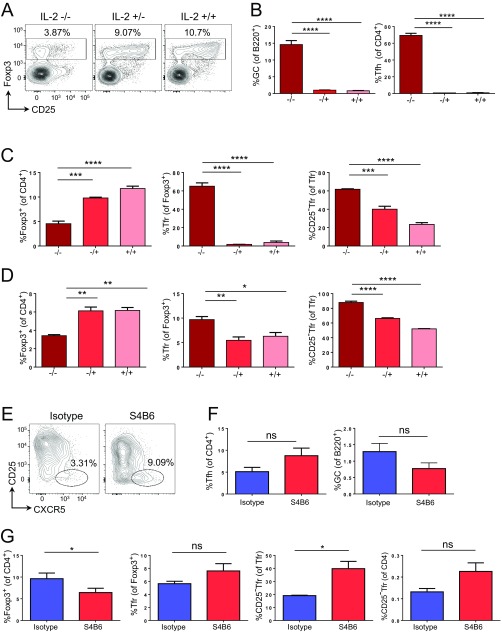
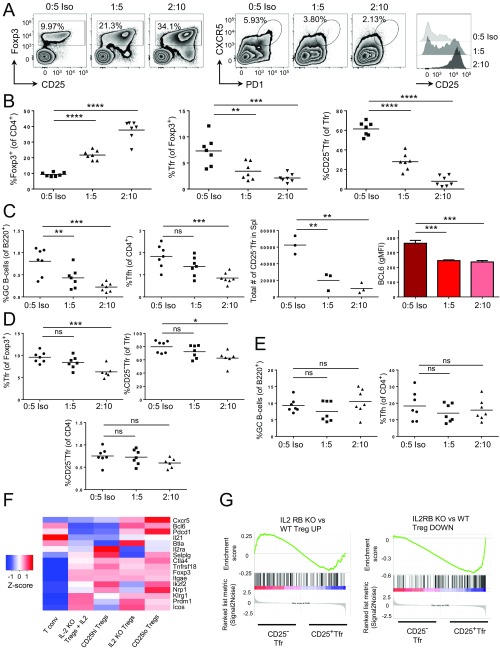
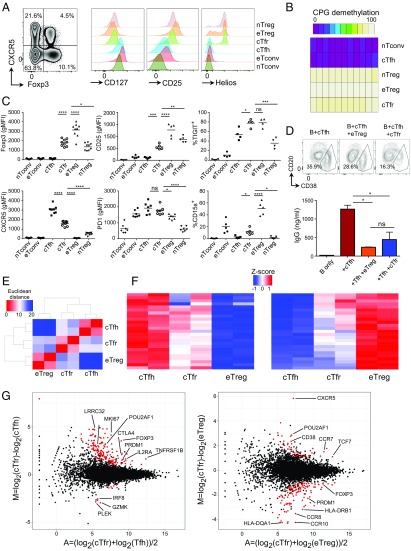
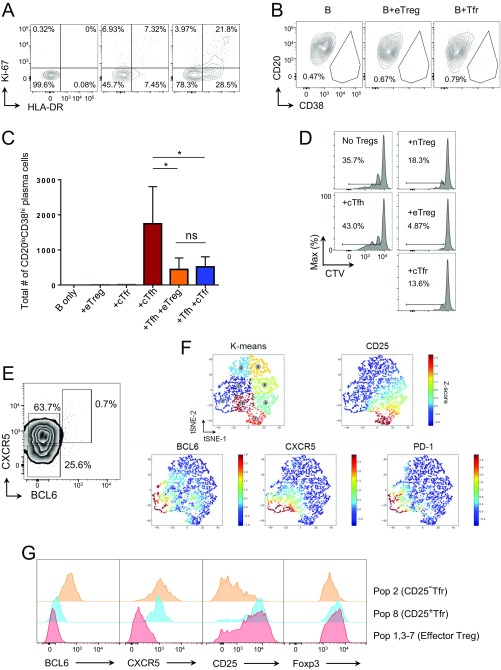
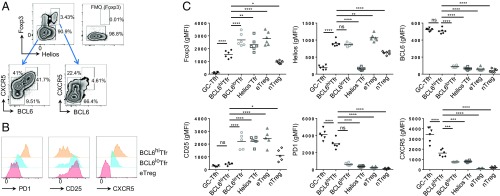
T-follicular helper (Tfh) cells differentiate through a multistep process, culminating in germinal center (GC) localized GC-Tfh cells that provide support to GC-B cells. T-follicular regulatory (Tfr) cells have critical roles in the control of Tfh cells and GC formation. Although Tfh-cell differentiation is inhibited by IL-2, regulatory T (Treg) cell differentiation and survival depend on it. Here, we describe a CD25- subpopulation within both murine and human PD1+CXCR5+Foxp3+ Tfr cells. It is preferentially located in the GC and can be clearly differentiated from CD25+ non-GC-Tfr, Tfh, and effector Treg (eTreg) cells by the expression of a wide range of molecules. In comparison to CD25+ Tfr and eTreg cells, CD25- Tfr cells partially down-regulate IL-2-dependent canonical Treg features, but retain suppressive function, while simultaneously up-regulating genes associated with Tfh and GC-Tfh cells. We suggest that, similar to Tfh cells, Tfr cells follow a differentiation pathway generating a mature GC-localized subpopulation, CD25- Tfr cells.

Keywords: T-follicular regulatory cell; Tfh cell; Tfr cell; Treg cell; germinal center.


Conflict of interest statement

Conflict of interest statement: S.H. and S.S. have independently collaborated with the same laboratory and have therefore appeared as coauthors in a paper published as Garg G, et al. (2017) Unique properties of thymic antigen-presenting cells promote epigenetic imprinting of alloantigen-specific regulatory T cells. Oncotarget 8:35542–35557, although S.S. did so independently and without knowledge of the other's participation in the work, S.H. and S.S. contributed independently to an article regarding nomenclature published as Abbas AK, et al. (2013) Regulatory T cells: Recommendations to simplify the nomenclature. Nat Immunol 14:307–308.

Figures

Fig. 1.
Fig. 1.
Identification of CD25 Tfr cells. Mice were vaccinated s.c. with 100 μg of NP-Ova (Biosearch) in alum, and draining LNs (dLNs) or Peyer’s patches were taken at day 7 or the indicated time. (A) Gating strategy of CD25+ and CD25 Tfr cells. Cells were first gated as CD3+CD4+B220CD11cCD11bLive/Dead-dye before the start of the shown gating. The fluorescence minus one (FMO) control is CD44+CD62L Treg cells with anti-CXCR5 omitted. Data are representative of >10 separate experiments. Max, maximum. (B) Proportion of CD25 cells in gated CXCR5 and PD-1 low to high populations in Peyer’s patch CD44+CD62L Treg cells. Data are representative of >10 separate experiments. (C) Time course of GC, Tfh, CD25+ Tfr, and CD25 Tfr proportions in dLNs following vaccination at day 0. (D) Tfr cells in BCL6flox/flox and BCL6wt/wt CD4-Cre mice, with Peyer’s patch T cells pregated on CD44+CD62L Treg cells. (C and D) Data are pooled from three mice, representative of two separate experiments.
Fig. S1.
Fig. S1.
Identification of CD25 Tfr cells. Mice were vaccinated s.c. and i.p. with 100 μg of NP-Ova in alum, and dLNs, spleens (Spl), or Peyer’s patches (PP) were taken at day 7 or the indicated time. (A) Percentage of CD25 within total Tfr cells from indicated organs. Data are pooled from 10 mice, representative of three separate experiments. (B) ACCENSE analysis of PP CD4+ T cells. PD1, BCL6, CXCR5, Foxp3, and CD25 were used for mapping. CD44 and CD62L clustered on the basis of other parameters. Data are pooled from three mice concatenated into a single flow cytometry standard file, representative of two separate experiments. Scales are Z-scores (±SD from mean). (C) Time course of GC, Tfh, CD25+ Tfr, and CD25 Tfr cell numbers per 1 × 10⁵ lymphocytes in dLNs following vaccination at day 0.
Fig. 2.
Fig. 2.
Protein expression profile of CD25 Tfr cells. Mice were vaccinated s.c. with 100 μg of NP-Ova in alum, and dLNs were taken at day 7 or day 14. (A, Left) Heat map of geometric mean fluorescence intensity (gMFI; unless indicated otherwise) or percent positive (CD103, Ki-67, IL-21, BLIMP-1, KLRG1) of indicated markers. (A, Right) Significant differences between CD25 Tfr and CD25+ Tfr cells. The scale is the Z-score of mean. Data are pooled from three mice, representative of two to four separate experiments. (B) Expression of indicated markers by gMFI or percent positive of indicated markers. Mean ± SEM. Data are pooled from three mice, representative of two to four separate experiments. (C) Contour plots of KLRG1 and CD103 expression by indicated Treg populations. Data are representative of two separate experiments (*P ≤ 0.05, **P ≤ 0.01, ***P ≤ 0.001, ****P ≤ 0.0001). ns, not significant.
Fig. S2.
Fig. S2.
Phenotyping of CD25 Tfr cells. Mice were vaccinated s.c. with 100 μg of NP-Ova in alum, and dLNs were taken at day 7 or day 14. Expression of indicated markers by geometric mean fluorescence intensity (gMFI) or percent positive as assessed by flow cytometry. Mean ± SEM. Data are pooled from three mice, representative of two to four separate experiments (*P ≤ 0.05, **P ≤ 0.01, ***P ≤ 0.001, ****P ≤ 0.0001). ns, not significant.
Fig. 3.
Fig. 3.
Localization of CD25 Tfr cells. Mice were/were not vaccinated s.c. and i.p. with 100 μg of NP-Ova in alum and then killed 14 d later. Spleens and dLNs were taken and fixed in 2% paraformaldehyde. Sections were then stained, and expression of Foxp3, CD25, and IgD or Foxp3, CD25, and GL7 was assessed by immunohistochemistry. (A) Foxp3 and CD25 expression by Treg cells in the follicle and T-cell zones from the spleens of unvaccinated mice. (B) Foxp3 and CD25 expression of Treg cells in the follicle, T-cell zones, and GC from spleens of vaccinated mice. CD25, Foxp3, and IgD expression (Upper) and CD25, Foxp3, and GL7 expression (Lower) are shown. White arrows denote Foxp3+CD25 cells, and the red arrow denotes a Foxp3+CD25+ cell. (C) Proportion of CD25 expression within Foxp3+ cells in the follicle, T-cell zone, and GC from spleens (Spl) (Left) and dLNs (Right). Each data point represents a separate field. Data are pooled from three mice, representative of two separate experiments (*P ≤ 0.05, **P ≤ 0.01, ****P ≤ 0.0001).
Fig. 4.
Fig. 4.
RNA-Seq of CD25 Tfr cells. Mice were vaccinated with NP-Ova in alum, and dLNs were taken at day 7. A total of 1 × 10⁴ cells were sorted by Becton Dickinson (BD) FACSAria-SORP before RNA-Seq. RNA was extracted using RLT buffer (Qiagen), and then subjected to library preparation using the Quartz-Seq protocol and sequenced by Ion Proton (Life Technologies). Heat maps, principal component analysis, and Euclidean distance analysis were produced using R software. Differential gene expression analysis was performed in R by TCC/DEseq2. Genes with a false discovery rate of <0.01 and a fold change of ≥2 were considered DE. Z-scored heat maps of the top 25 up-regulated (A) and top 25 down-regulated (B) Tfh genes are shown. (C) GSEA of CD25 Tfr cells vs. CD25+ Tfr cells with a Tfh vs. eTreg DE gene list. Positive enrichment shows enrichment in CD25 Tfr cells, and negative enrichment shows enrichment in CD25+ Tfr cells. (D) Z-scored heat map of selected Treg suppressor genes. (E) Principal component (PC) analysis (top 500 most variable genes). (F) Euclidean distance to Tfh or eTreg gene expression profile.
Fig. S3.
Fig. S3.
RNA-Seq of CD25 Tfr cells. Mice were vaccinated with NP-Ova in alum, and dLNs were taken at day 7. A total of 1 × 10⁴ cells were sorted by FACS before RNA-Seq. RNA was extracted using RLT buffer, and then subjected to library preparation using the Quartz-Seq protocol and sequenced by Ion Proton. Heat maps, hierarchical clustering, and Euclidean distance analysis were produced using R software. Differential gene expression analysis was performed in R by TCC/DEseq2. Genes with a false discovery rate of <0.01 and a fold change of ≥2 were considered DE. (A) Z-scored heat map of a full list of Tfh vs. eTreg DE genes, with columns and rows hierarchically clustered. (B) Z-scored heat map of selected Tfh-related genes. (C) GSEA of CD25 Tfr vs. CD25+ Tfr cells with the BCL6hi Tfh vs. BCL6lo Tfh gene list from ref. (GEO accession no. GSE24574). Positive enrichment shows enrichment in CD25 Tfr cells, and negative enrichment shows enrichment in Tfr cells. (D) Euclidean distance analysis of gene expression.
Fig. 5.
Fig. 5.
Suppressive function and stability of CD25 Tfr cells. Mice were vaccinated with NP-Ova in alum, and dLNs were taken at day 7. Cells were sorted by BD FACSAria-SORP after negative selection of CD4 by magnetic beads. (A) Total of 1 × 10⁴ B cells were cultured in the presence of 0.5 μg/mL anti-CD3 and 10 μg/mL anti-IgM, and 5 × 10³ Tfh cells were cultured with/without 5 × 10³ of the indicated Treg population for 6 d. (A) Supernatant IgG1 concentrations were determined by ELISA. Mean ± SEM of duplicates. Data are representative of two separate experiments. (B) Total of 1 × 10⁵ nTreg cells were transfected with retrovirus containing EV or ASCL2 by spinfection with viral supernatants, and then cultured in the presence of anti-CD3, anti-CD28 Dynabeads, and 100 U/mL IL-2 for 72 h. CXCR5 expression (Upper) and CD25 expression (Lower) are shown. The filled histogram is NGFR, and the clear histogram is NGFR+. Data are representative of three separate experiments. (C) Total of 2.5 × 10³ purified cells were stained with CellTrace Violet (CTV) and incubated with anti-CD3, anti-CD28 Dynabeads alone (top row), Dynabeads with 100 U/mL IL-2 (middle row), or 20 ng IL-4 (bottom row) for 3 d. (Left) Foxp3-GFP and CD25 expression. (Right) Proliferation and total cell number (in parentheses) of indicated populations. Data are representative of two separate experiments. (D) Total of 1 × 10⁴ cells were assessed for DNA demethylation by bisulfide sequencing. Data are representative of two separate experiments. (E) Total of 1 × 10⁶ CD62L+CD25 nTconv cells from CD45.1 BALB/c mice and 1 × 10⁵ CD62L+CD25+Foxp3GFP+ nTreg cells from CD45.2 BALB/c eFox mice were transferred i.v. into athymic BALB/c nude mice. One day later, mice were vaccinated, and dLNs, spleens, and Peyer’s patches were collected at day 14. CD25 and CXCR5 expression by eTreg cells (Foxp3+CD44+CD62LCXCR5) and Tfr cells (Foxp3+CD44+CD62LCXCR5+PD1+) is shown. Data are pooled from three mice, representative of two separate experiments.
Fig. S4.
Fig. S4.
Suppressive function and stability of CD25 Tfr cells. Mice were vaccinated with NP-Ova in alum, and dLNs were taken at day 7. Cells were sorted by BD FACSAria-SORP (Becton Dickinson) after negative selection of CD4 by magnetic beads. (A) Total of 1 × 10⁴ B cells were cultured in the presence of 0.5 μg/mL anti-CD3, 10 μg/mL anti-IgM, and 5 × 10³ Tfh cells with/without 5 × 10³ of the indicated Treg population for 6 d. Intracellular IgG1 expression is shown. Data are representative of two separate experiments. (B) Total of 5 × 10³ nTconv cells were stained with CTV and incubated for 3 d with 5 × 10³ B cells; 0.5 μg/mL anti-CD3; and 5 × 10³, 2.5 × 10³, or 1.25 × 10³ suppressor cells. Data are representative of two separate experiments. (C) Total of 2.5 × 10³ purified cells were stained with CTV and incubated with Dynabeads with/without the indicated cytokines (100 units of IL-2 + 20 ng of IL-6 or 20 ng of IL-4 + 20 ng of IL-6) for 3 d. Foxp3 and CD25 expression is shown. Data are representative of two separate experiments. (D) CD4-enriched T cells from dLNs before and after sorting by BD FACSAria-SORP. (E and F) Total of 1 × 10⁵ CD45.1 nTconv cells and 1 × 10⁴ CD45.2 eFox CD25 Tfr cells were transferred i.v. into nude mice. One day later, mice were vaccinated, and dLNs were collected at day 14. (E) CD25 and CXCR5 expression by Foxp3 CD45.1 cells (Right) and Foxp3-GFP+ CD45.2 cells (Left). (F) Percentage of CD45.2Foxp3+Foxp3GFP and CD45.2+Foxp3GFP+ cells in eTreg, Tfr, and CD25 Tfr populations. Data are representative of two separate experiments.
Fig. S5.
Fig. S5.
Effect of IL-2 KO and antibody blockade on CD25 Tfr cells. (AD) Four-week-old IL-2 KO homozygous (−/−), heterozygous (−/+), or wild-type (+/+) littermates were killed. (A) Foxp3 and CD25 expression by CD4+ cells in LNs. (B) Summary data of GC and Tfh cells from LNs of indicated mice. (C) Summary data of Treg, Tfr, and CD25 Tfr cells within Tfr cells from LNs of indicated mice. (D) Summary data of Treg, Tfr, and CD25 Tfr cells within Tfr cells from Peyer’s patches of indicated mice. Mean ± SEM. Data are pooled from three mice, representative of two separate experiments. (EG) Mice were given 1 mg of anti–IL-2 (S4B6) or isotype control i.p. at day −1. Mice were then vaccinated s.c. with 100 μg of NP-Ova in alum at day 0. (E) Expression of CD25 and CXCR5 by CD44+CD62L−Foxp3+ Treg cells. (F) Summary data of GC and Tfh cells from LNs of indicated mice. (G) Summary data of Treg, Tfr, and CD25 Tfr cells within Tfr cells or CD4 from LNs of indicated mice. Mean ± SEM. Data are pooled from four mice, representative of two separate experiments (*P ≤ 0.05, **P ≤ 0.01, ***P ≤ 0.001, ****P ≤ 0.0001). ns, not significant.
Fig. S6.
Fig. S6.
Effect of IL-2 complex on CD25 Tfr cells. (AD) Mice were treated at days −1, 1, 2, 3, 4, and 5 with IL-2 complex at a 1:5 or 2:10 ratio of 1 μg of murine IL-2/5 μg of anti–IL-2 (JES6-1A12), or with 5 μg of isotype (Iso) control alone. Mice were vaccinated with NP-Ova in alum at day 0, and spleens taken at day 7. (A) Zebra plots and histograms of Foxp3 and CD25 expression by CD4+ cells (Left), CXCR5 and PD1 expression by Foxp3+ Treg cells (Center), and CD25 expression by Tfr cells (Right). (B) Summary data of Treg, Tfr, and CD25 Tfr cells. Data are pooled from seven mice, representative of two separate experiments. The line indicates mean. (C) Summary data of GC-B cells, Tfh cells, total number of CD25 Tfr cells, and gMFI of BCL6 expression by Tfr cells in spleens (n = 3–7 as indicated). (D) Summary data of Tfr, CD25 Tfr, and CD25 Tfr cells as a proportion of CD4 in Peyer’s patches (one outlier removed from 2:10 group as outlined in Materials and Methods). (E) GC-B cells and Tfh cells in Peyer’s patches (n = 7, line denotes mean). (F) Z-score heat map and clustering dendrogram of microarray gene expression by CD25hi or CD25lo Treg cells from naive mice or Treg cells from IL-2−/− mice with/without peritoneal injections of recombinant IL-2 every 8 h for the 24 h before euthanasia. Microarray data are from Fontenot et al. (12) (GEO accession no. GSE4179). (G) GSEA of CD25 Tfr vs. CD25+ Tfr cells with the gene list from IL-2β KO Treg vs. wild-type Treg cells. Data are from Yu et al. (34), (GEO accession no. GSE14350). Positive enrichment shows enrichment in CD25 Tfr cells, and negative enrichment shows enrichment in CD25+ Tfr cells (*P ≤ 0.05, **P ≤ 0.01, ***P ≤ 0.001, ****P ≤ 0.0001). ns, not significant.
Fig. 6.
Fig. 6.
Human circulating Tfr cells. PBMCs were purified from the blood of healthy donors. (A) Zebra plot of Foxp3 and CXCR5 expression by CD4+CD3+CD45RA T cells (Left) and histograms of CD127, CD25, and Helios expression by the indicated populations (Right), representative of more than five (Left) and two separate (Right) experiments, respectively. (B) Total of 1 × 10⁴ cells were sorted by BD FACSAria-SORP after negative selection of CD4 by magnetic beads as CD45RA+CD127+CD25 nTconv cells, CD45RACD127+CD25CXCR5+ cTfh cells, CD45RA+CD127loCD25+ nTreg cells, CD45RACD127loCD25+CXCR5 eTreg cells, and CD45RACD127loCD25+CXCR5+ cTfr cells, and methylation status was assessed by bisulfide sequencing. Data are representative of two separate experiments. (C) Summary data of protein expression by indicated populations. Data are pooled from four to nine mice, representative of two to four separate experiments. (D) Total of 5 × 10⁴ B cells were cultured in the presence of anti-CD3 and anti-CD28 Dynabeads with/without 1 × 10⁴ cTfh cells and/or 1 × 10⁴ eTreg cells or cTfr cells for 6 d. CD20loCD38hi plasma cell formation (Upper) and IgG concentration in supernatants determined by ELISA (Lower) are shown (mean ± SEM of duplicates). Data are representative of two separate experiments. (EG) Total of 1 × 10⁴ cells were sorted by BD FACSAria-SORP as in B before RNA-Seq. Heat maps, principal component analysis, and Euclidean distance analysis were produced using R software. Differential gene expression analysis was performed in R by TCC/DEseq2. Genes with a false discovery rate of <0.05 and a fold change of ≥2 were considered DE. (E) Euclidean distance analysis of whole-gene expression profile. (F) Z-scored heat maps of the top 25 up-regulated (Left) and the top 25 down-regulated (Right) Tfh genes. (G) Plots of log2-fold change (M) and gene expression (A) between cTfr and Tfh cells (Left) or cTfr and eTreg cells (Right). DE genes are highlighted in red (*P ≤ 0.05, **P ≤ 0.01, ***P ≤ 0.001, ****P ≤ 0.0001). ns, not significant.
Fig. S7.
Fig. S7.
Function and phenotype of Tfr cells in blood and tonsils. (AD) PBMCs were purified from the blood of healthy donors. (A) Expression of HLA-DR and Ki-67 by nTreg (Left), cTfr (Center), and eTreg (Right) cells. Data are representative of three separate experiments. (B and C) Total of 5 × 10⁴ B cells were cultured in the presence of anti-CD3 and anti-CD28 Dynabeads at a 1:32 Dynabead/T-cell ratio (Thermo Fisher Scientific) with/without 1 × 10⁴ Tfh cells and/or 1 × 10⁴ eTreg cells or indicated Tfr cells for 6 d. (B) CD20loCD38hi plasma cell formation. (C) Total number of CD20loCD38hi plasma cells. Mean ± SEM of duplicates. Data are representative of two separate experiments (*P ≤ 0.05; ns, not significant). (D) Total of 1 × 10⁴ nTconv cells from PBMCs were stained with CTV cultured for 6 d with irradiated CD4 PBMCs with 1 μg of anti-CD3 with/without 5 × 10³ of the indicated suppressor cells. Data are representative of two separate experiments. (E and F) Fresh human tonsils were obtained from the National Disease Resource Interchange. (E) BCL6 and CXCR5 expression by Foxp3+Helios cells. (F) ACCENSE analysis of gated CD45RAFoxp3+Helios+ Treg cells. Cells were mapped by CD25, BCL6, CXCR5, and PD1. K-means were used to identify separate regions (Upper Left). (G) Histograms of ACCENSE-identified populations. Population 2, CD25 Tfr cells; population 8, Tfr cells; population 1, 3–7, eTreg cells. Population 1, 3–7 was recombined by concatenation of flow cytometry standard files.
Fig. 7.
Fig. 7.
Human tonsillar Tfr cells. (AC) Fresh human tonsils were obtained from the National Disease Resource Interchange. (A) CD45RACD4+CD3+B220 gated cells were then further dissected to CXCR5BCL6 Foxp3+ as eTreg cells, CXCR5+BCL6loFoxp3 as Tfh cells, CXCR5+BCL6loFoxp3+Helios+ as BCL6lo Tfr cells or Helios Tfr cells (when Helios), and CXCR5+BCL6hi as GC-Tfh (when Foxp3) or BCL6hi Tfr cells (when Foxp3+). (Upper Right) Foxp3 FMO staining is shown. (B) Expression of PD1, CD25, and CXCR5 by indicated populations. (C) Summary data of indicated marker expression. Data are pooled from six mice, representative of two separate experiments (*P ≤ 0.05, **P ≤ 0.01, ****P ≤ 0.0001). ns, not significant.

Similar articles

Cited by

References

    1. Crotty S. T follicular helper cell differentiation, function, and roles in disease. Immunity. 2014;41:529–542. - PMC - PubMed
    1. Johnston RJ, et al. Bcl6 and Blimp-1 are reciprocal and antagonistic regulators of T follicular helper cell differentiation. Science. 2009;325:1006–1010. - PMC - PubMed
    1. Nurieva RI, et al. Bcl6 mediates the development of T follicular helper cells. Science. 2009;325:1001–1005. - PMC - PubMed
    1. Yu D, et al. The transcriptional repressor Bcl-6 directs T follicular helper cell lineage commitment. Immunity. 2009;31:457–468. - PubMed
    1. Sakaguchi S, Yamaguchi T, Nomura T, Ono M. Regulatory T cells and immune tolerance. Cell. 2008;133:775–787. - PubMed

Publication types

MeSH terms