The genetic architecture of water-soluble protein content and its genetic relationship to total protein content in soybean
- PMID: 28698580
- PMCID: PMC5506034
- DOI: 10.1038/s41598-017-04685-7
The genetic architecture of water-soluble protein content and its genetic relationship to total protein content in soybean
Abstract
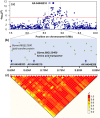
Water-soluble protein content (WSPC) is a critical factor in both soybean protein quality and functionality. However, the underlying genetic determinants are unclear. Here, we used 219 soybean accessions and 152 recombinant inbred lines genotyped with high-density markers and phenotyped in multi-environments to dissect the genetic architectures of WSPC and protein content (PC) using single- and multi-locus genome-wide association studies. In the result, a total of 32 significant loci, including 10 novel loci, significantly associated with WSPC and PC across multi-environments were identified, which were subsequently validated by linkage mapping. Among these loci, only four exhibited pleiotropic effects for PC and WSPC, explaining the low correlation coefficient between the two traits. The largest-effect WSPC-specific loci, GqWSPC8, was stably identified across all six environments and tagged to a linkage disequilibrium block comprising two promising candidate genes AAP8 and 2 S albumin, which might contribute to the high level of WSPC in some soybean varieties. In addition, two genes, Glyma.13G123500 and Glyma.13G194400 with relatively high expression levels at seed development stage compared with other tissues were regarded as promising candidates associated with the PC and WSPC, respectively. Our results provide new insights into the genetic basis of WSPC affecting soybean protein quality and yield.
Conflict of interest statement
The authors declare that they have no competing interests.
Figures


Similar articles
-
Genome-wide association study of four yield-related traits at the R6 stage in soybean.BMC Genet. 2019 Mar 29;20(1):39. doi: 10.1186/s12863-019-0737-9. BMC Genet. 2019. PMID: 30922237 Free PMC article.
-
Identification of novel loci associated with maturity and yield traits in early maturity soybean plant introduction lines.BMC Genomics. 2018 Mar 1;19(1):167. doi: 10.1186/s12864-018-4558-4. BMC Genomics. 2018. PMID: 29490606 Free PMC article.
-
A Combined Linkage and GWAS Analysis Identifies QTLs Linked to Soybean Seed Protein and Oil Content.Int J Mol Sci. 2019 Nov 25;20(23):5915. doi: 10.3390/ijms20235915. Int J Mol Sci. 2019. PMID: 31775326 Free PMC article.
-
Characterization of Disease Resistance Loci in the USDA Soybean Germplasm Collection Using Genome-Wide Association Studies.Phytopathology. 2016 Oct;106(10):1139-1151. doi: 10.1094/PHYTO-01-16-0042-FI. Epub 2016 Jul 11. Phytopathology. 2016. PMID: 27135674 Review.
-
Detection of candidate gene networks involved in resistance to Sclerotinia sclerotiorum in soybean.J Appl Genet. 2022 Feb;63(1):1-14. doi: 10.1007/s13353-021-00654-z. Epub 2021 Sep 11. J Appl Genet. 2022. PMID: 34510383 Free PMC article. Review.
Cited by
-
Linkage and association study discovered loci and candidate genes for glycinin and β-conglycinin in soybean (Glycine max L. Merr.).Theor Appl Genet. 2021 Apr;134(4):1201-1215. doi: 10.1007/s00122-021-03766-6. Epub 2021 Jan 19. Theor Appl Genet. 2021. PMID: 33464377
-
Genome-wide association mapping for protein, oil and water-soluble protein contents in soybean.Mol Genet Genomics. 2021 Jan;296(1):91-102. doi: 10.1007/s00438-020-01704-7. Epub 2020 Oct 2. Mol Genet Genomics. 2021. PMID: 33006666
-
Transgressive Potential Prediction and Optimal Cross Design of Seed Protein Content in the Northeast China Soybean Population Based on Full Exploration of the QTL-Allele System.Front Plant Sci. 2022 Jul 12;13:896549. doi: 10.3389/fpls.2022.896549. eCollection 2022. Front Plant Sci. 2022. PMID: 35903228 Free PMC article.
-
Meta-analysis of QTL reveals the genetic control of yield-related traits and seed protein content in pea.Sci Rep. 2020 Sep 28;10(1):15925. doi: 10.1038/s41598-020-72548-9. Sci Rep. 2020. PMID: 32985526 Free PMC article.
-
Genome-Wide Detection of Major and Epistatic Effect QTLs for Seed Protein and Oil Content in Soybean Under Multiple Environments Using High-Density Bin Map.Int J Mol Sci. 2019 Feb 23;20(4):979. doi: 10.3390/ijms20040979. Int J Mol Sci. 2019. PMID: 30813455 Free PMC article.
References
-
- Newkirk, R. Soybean: Feed industry guide, 1st edition. Canadian International Grains Institute (2010).
-
- Speroni F, et al. Gelation of soybean proteins induced by sequential high-pressure and thermal treatments. Food Hydrocolloids. 2009;23:1433–1442. doi: 10.1016/j.foodhyd.2008.11.008. - DOI
-
- Pednekar M, Das AK, Rajalakshmi V, Sharma A. Radiation processing and functional properties of soybean (Glycine max) Radiat Phys Chem. 2010;79:490–494. doi: 10.1016/j.radphyschem.2009.10.009. - DOI
Publication types
MeSH terms
Substances
LinkOut - more resources
Full Text Sources
Other Literature Sources

