. 2017 Jul 11;7(1):5044.
doi: 10.1038/s41598-017-05405-x.

A Novel Dual Eigen-Analysis of Mouse Multi-Tissues' Expression Profiles Unveils New Perspectives into Type 2 Diabetes

Affiliations

A Novel Dual Eigen-Analysis of Mouse Multi-Tissues' Expression Profiles Unveils New Perspectives into Type 2 Diabetes

Lei M Li et al. Sci Rep. .

Abstract

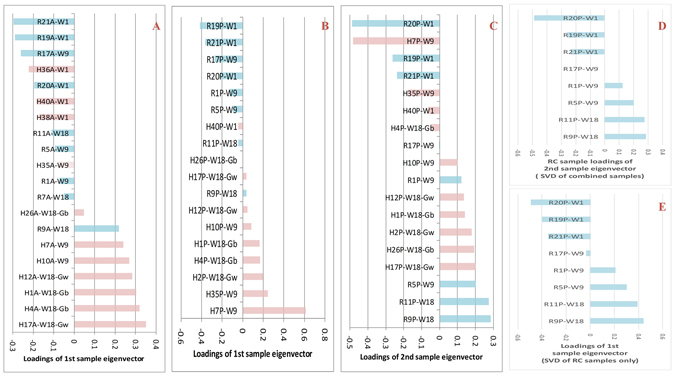
Type 2 diabetes (T2D) is a complex and polygenic disease yet in need of a complete picture of its development mechanisms. To better understand the mechanisms, we examined gene expression profiles of multi-tissues from outbred mice fed with a high-fat diet (HFD) or regular chow at weeks 1, 9, and 18. To analyze such complex data, we proposed a novel dual eigen-analysis, in which the sample- and gene-eigenvectors correspond respectively to the macro- and micro-biology information. The dual eigen-analysis identified the HFD eigenvectors as well as the endogenous eigenvectors for each tissue. The results imply that HFD influences the hepatic function or the pancreatic development as an exogenous factor, while in adipose HFD's impact roughly coincides with the endogenous eigenvector driven by aging. The enrichment analysis of the eigenvectors revealed diverse HFD impact on the three tissues over time. The diversity includes: inflammation, degradation of branched chain amino acids (BCAA), and regulation of peroxisome proliferator activated receptor gamma (PPARγ). We reported that in the pancreas remarkable up-regulation of angiogenesis as downstream of the HIF signaling pathway precedes hyperinsulinemia. The dual eigen-analysis and discoveries provide new evaluations/guidance in T2D prevention and therapy, and will also promote new thinking in biology and medicine.


Conflict of interest statement

The authors declare that they have no competing interests.

Figures

Figure 1
Figure 1
Schemes of the experiment design, dual eigen-analysis and structure of the top eigen-components of the three tissues. (A) The outbred mice were fed with RC or HFD. Three mice were randomly selected from each diet group at week 1, 9, and 18. At week 18, the HFD group was further divided into two subgroups, HFD-Gw and HFD-Gb, according to the GTT/ITT results. The expression profiles of their liver, adipose, and pancreas tissues were measured. (B) The dual eigen-analysis has several steps. (1) According to the SVD structure, for each tissue, compute the SVD of the expression profile of the HFD and RC samples as well as that for the RC samples only; (2) compare the eigenvectors of the two SVDs and identify the similar and different eigen-components; (3) sort the loadings of each principal sample eigenvector, followed by (4) identifying the associated factor; and (5) sort the loadings of the coupling gene eigenvector, followed by (6) identifying the molecular pathways enriched at its two ends. (C) The first and second hepatic eigen-components correspond to the endogenous functional state and the driving impact due to HFD, respectively. Only one meaningful eigen-component was identified for the adipose. The first and second pancreatic eigen-components correspond to the response to the HFD impact and the developmental state respectively.
Figure 2
Figure 2
The sorted loadings of the top hepatic sample eigenvectors and their interpretations. (A,B) The AUC (area under curve) results of GTT and ITT of mouse samples from week 18 were respectively sorted in the ascending order. Shown from top to bottom are the sub-groups of RC, HFD-W18-Gb, and HFD-W18-Gw accordingly. (C) The sorted loadings of the hepatic first sample eigenvector from the SVD of the HFD and RC samples. The samples from week 18 were at the bottom. Similar to the ITT (B) and GTT (A) sorting, the HFD-W18-Gb subgroup located on top of the HFD-W18-Gw subgroup, and even further, on top of the RC samples at week 18. (D) Derived from (C) by keeping only RC samples. (E) When SVD was carried out only for the RC hepatic samples, the sorted loading of its first sample eigenvector displayed a chronological order. The consistency between (D) and (E) indicates that the first eigen-component reflected an endogenous state of the liver. (F) the sorted loadings of the second sample eigenvector from the SVD of the combined samples. The clear-cut separation of the RC and HFD samples indicates that the second hepatic eigen-component reflected the driving impact from HFD.
Figure 3
Figure 3
The sorted loadings of the top sample eigenvectors from the adipose and the pancreas and their interpretations. (A) The adipose top sample eigenvector v1 were highly correlated with the age factor, and after week 9 its correlation with the diet factor becomes more significant. (B) The pancreatic first eigenvector v1 from the SVD of all RC and HFD samples. Most RC samples were at the top half whereas most HFD samples were at the bottom half. It indicates that the pancreatic first eigen-component reflected predominantly the HFD impact. (C) The sorted loading of the pancreatic second eigenvector from the SVD of all RC and HFD samples. (D) Derived from (C) by keeping only RC samples. (E) When SVD was carried out only for the RC pancreatic samples, the sorted loadings of its first sample eigenvector displayed a chronological order. The exact consistency between (D) and (E) indicates that the pancreatic second eigen-component reflected predominantly the pancreatic development over time.
Figure 4
Figure 4
Summarization of the biological processes and molecular functions enriched at the two ends of the top gene eigenvectors. The up-enriched categories are shown on the right in red, whereas the down-enriched ones are shown on the left in green. (A) The hepatic first or endogenous gene eigenvector u1coupled with v1 in Fig. 2C. (B) The hepatic HFD, or second gene eigenvector u2coupled with v2 in Fig. 2F. (C) The adipose first gene eigenvector u1coupled with v1 in Fig. 3A. (D) The pancreatic HFD, or first gene eigenvector u1coupled with v1 in Fig. 3B. (E) The pancreatic development, or second gene eigenvector u2couplded with v2 in Fig. 3C. Notably, the KEGG pathway of valine, leucine and isoleucine degradation were down-enriched at the HFD and mature end of the top adipose eigenvector (C) while up-enriched at both the mature end of the hepatic first/endogenous eigenvector (A) and the mature end of the pancreatic second/development eigenvector (E). The JASPAR motif PPARG::RXR was down-enriched (p-value = 0.0082) at the HFD and mature end of the top adipose eigenvector (C) while up-enriched (p-value = 0.013) at the mature end of the hepatic first/endogenous eigenvector (A).
Figure 5
Figure 5
The loadings of the top gene eigenvectors on the KEGG insulin signaling pathway. (A) The adipose first gene eigenvector. The down-regulated genes at the HFD and mature end are marked in blue and up-regulated ones are marked in red. The most down-regulated critical genes included Insr, Irs1, Glut4, and PGC-1. The top gene eigenvector captured the most distinguished pattern of insulin resistance in the adipose induced by HFD. (B) The hepatic HFD or second gene eigenvector. In contrast, the hepatic HFD eigenvector did not show an obvious down-regulation pattern.
Figure 6
Figure 6
A number of genes including those downstream of HIF-1 signaling pathway were up-regulated in the pancreas in response to HFD. The sorted loadings of pancreatic HFD gene eigenvector demonstrated that the exposure to HFD (A) upregulated the genes downstream of the KEGG HIF-1 signaling pathway (B) Most of these genes are related to increasing oxygen delivery including angiogenesis whereas some others are related to regulation of proliferation and anti-apoptosis. Genes related to angiogenesis other than those in the KEGG HIF-1 signaling pathway such as Ang were also examined, including Adipoq, Cav1 and Ptgis, and others from the Biological Processes of Gene Ontology (GO): Positive Regulation of Angiogenesis and Vasculogenesis. The top ranked gene Car3 in the HFD gene eigenvector was reported to be a target of HIF-1signaling pathway. (C) Whether this kind of up-regulation attributed, at least in part, to the subsequent over-secretion of insulin from the pancreas that results in hyperinsulinemia is worth of future investigations.

Similar articles

Cited by

References

    1. Kahn SE, Cooper ME, Del Prato S. Pathophysiology and treatment of type 2 diabetes: perspectives on the past, present, and future. Lancet. 2014;383:1068–1083. doi: 10.1016/S0140-6736(13)62154-6. - DOI - PMC - PubMed
    1. McArdle MA, Finucane OM, Connaughton RM, McMorrow AM, Roche HM. Mechanisms of obesity-induced inflammation and insulin resistance: insights into the emerging role of nutritional strategies. Front Endocrinol (Lausanne) 2013;4:52. - PMC - PubMed
    1. Chen WS, et al. Leptin deficiency and beta-cell dysfunction underlie type 2 diabetes in compound Akt knockout mice. Mol Cell Biol. 2009;29:3151–3162. doi: 10.1128/MCB.01792-08. - DOI - PMC - PubMed
    1. Muoio DM, Newgard CB. Mechanisms of disease:Molecular and metabolic mechanisms of insulin resistance and beta-cell failure in type 2 diabetes. Nat Rev Mol Cell Biol. 2008;9:193–205. doi: 10.1038/nrm2327. - DOI - PubMed
    1. Li M, Zeng T, Liu R, Chen L. Detecting tissue-specific early warning signals for complex diseases based on dynamical network biomarkers: study of type 2 diabetes by cross-tissue analysis. Brief Bioinform. 2014;15:229–243. doi: 10.1093/bib/bbt027. - DOI - PubMed

Publication types