. 2017 Jul 11;7(1):5057.
doi: 10.1038/s41598-017-05345-6.

Spatial patterns of wet season precipitation vertical gradients on the Tibetan Plateau and the surroundings

Affiliations

Spatial patterns of wet season precipitation vertical gradients on the Tibetan Plateau and the surroundings

Lan Cuo et al. Sci Rep. .

Abstract

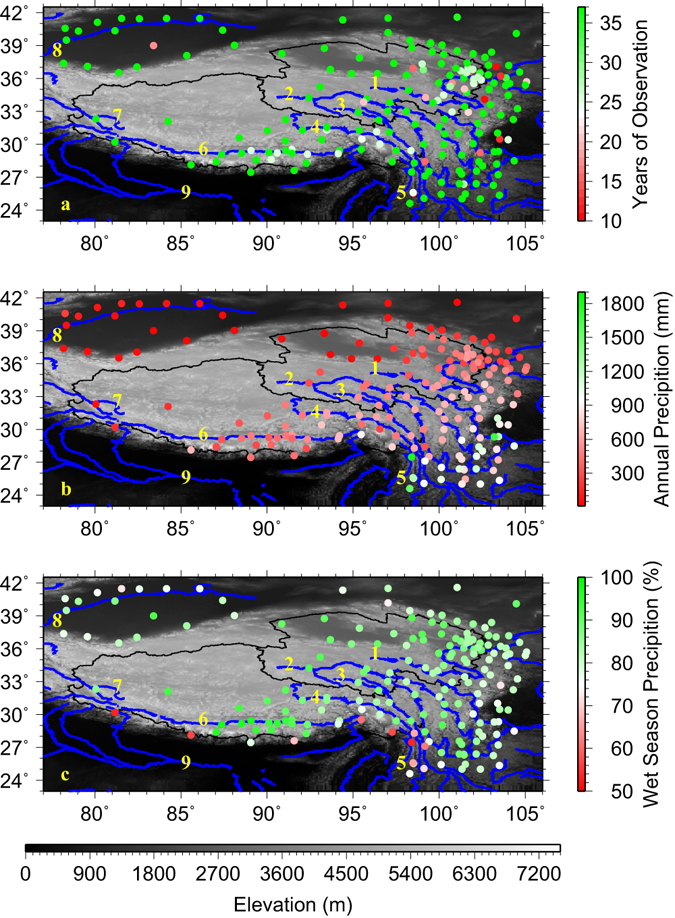
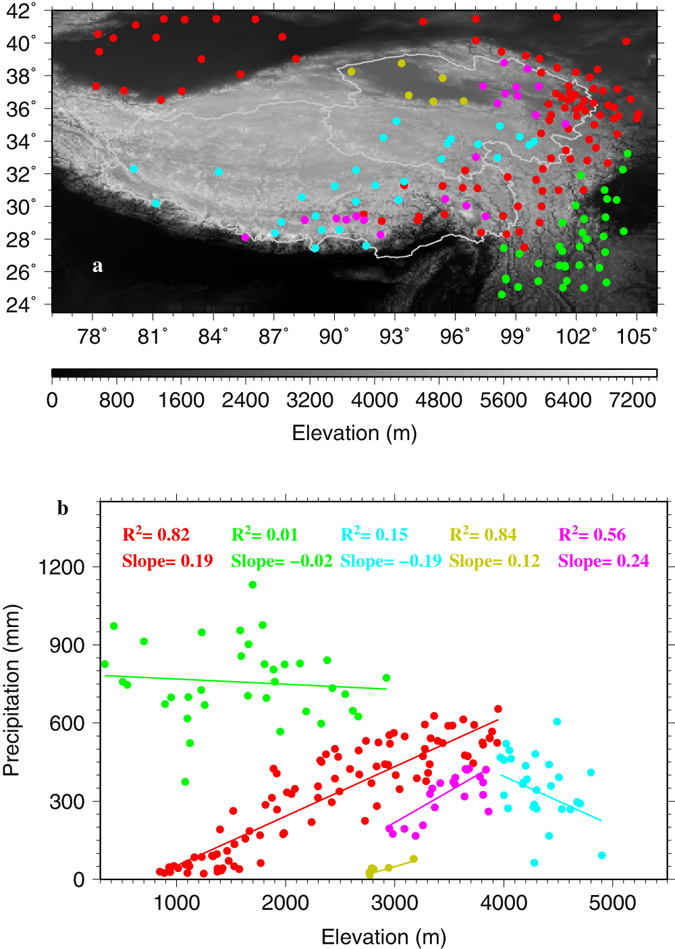
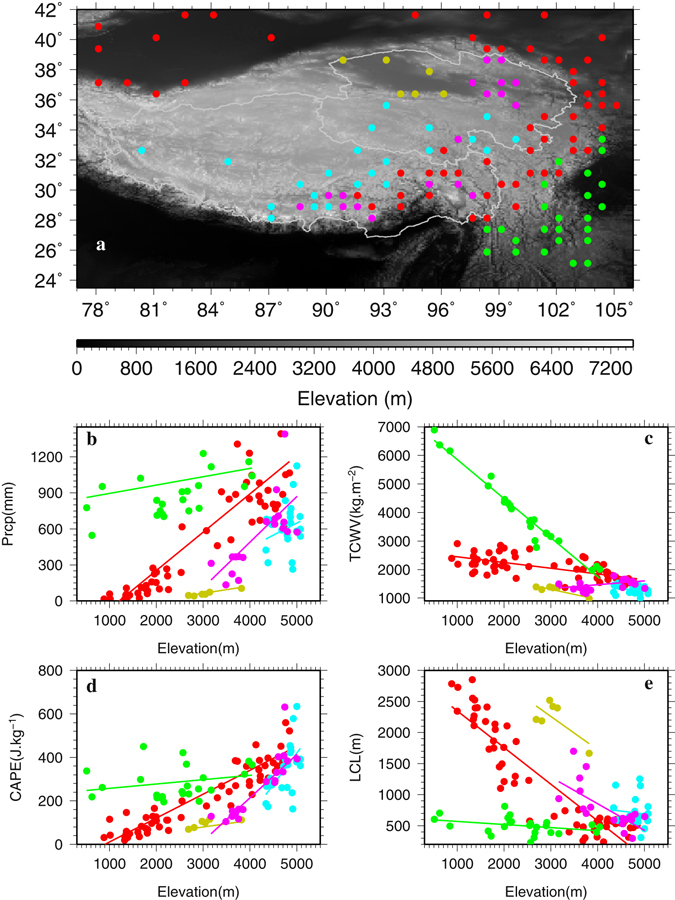
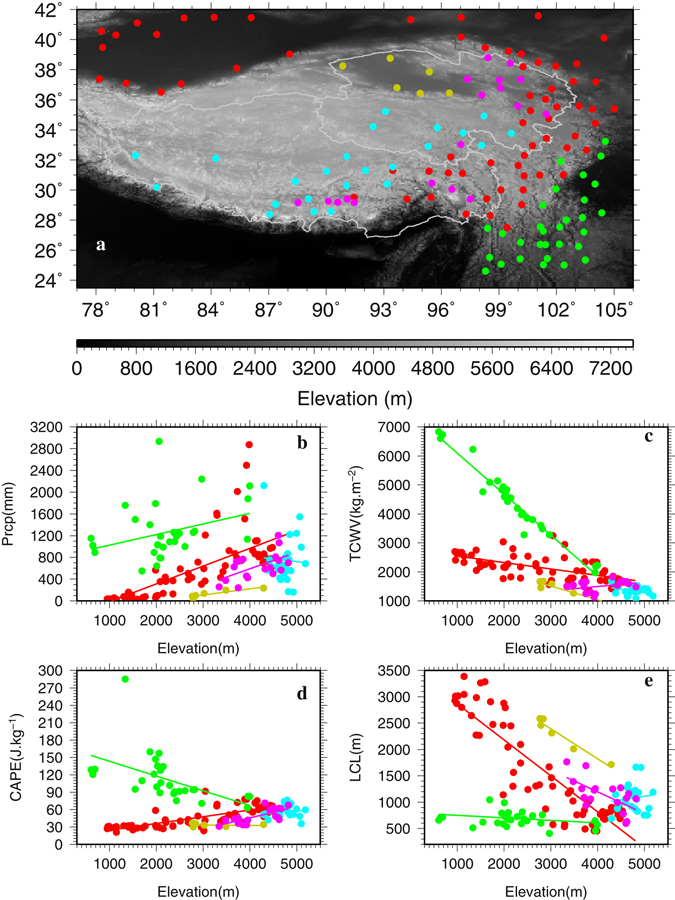
The Tibetan Plateau and the surrounding (TPS) with its vast land mass and high elevation affects regional climate and weather. The TPS is also the headwater of 9 major Asian rivers that provide fresh water for 1.65 billion people and many ecosystems, with wet season (May-September) precipitation being the critical component of the fresh water. Using station observations, ERA-Interim and MERRA2 reanalysis, we find that wet season precipitation displays vertical gradients (i.e., changes with elevation) that vary within the region on the TPS. The decrease of precipitation with elevation occurs in the interior TPS with elevation larger than 4000 m, little or no change over the southeastern TPS, and increase elsewhere. The increase of precipitation with elevation is caused by increasing convective available potential energy (CAPE) and decreasing lifting condensation level (LCL) with elevation overwhelming the effects of decreasing total column water vapor (TCWV) with elevation. The decreasing precipitation with elevation is due to the combined effects of increasing LCL and decreasing TCWV. LCL and CAPE play a more important role than TCWV in determining the spatial patterns. These findings are important for hydrology study in observation scarce mountainous areas, water resources and ecosystem managements in the region.


Conflict of interest statement

The authors declare that they have no competing interests.

Figures

Figure 1
Figure 1
Histogram of elevation in 100 m interval (gray bars) and hypsometric curve (red line) for the Tibetan Plateau and the surroundings (TPS, 25 °N–42 °N and 77 °E–105 °E) based on the 90 m resolution digital elevation map. This figure was plotted using the Generic Mapping Tools (GMT) V4.5.0 (https://www.soest.hawaii.edu/gmt/).
Figure 2
Figure 2
Geographic locations and number of years of observation for 185 stations that have observation periods longer than 10 years during 1979–2015 (a); mean annual precipitation at the 185 stations during 1979–2015 (b); percentage of wet season (May–September) precipitation to annual total precipitation at the 185 stations (c). Black lines denote the boundaries of the Qinghai Province on the northeastern and the Tibetan Autonomous Region on the southwestern TPS. Blue lines and the numerical numbers represent the 9 major rivers that originate from the TPS: 1: the Yellow River, 2: the Yangtze River, 3: the Mekong River, 4: the Salween River, 5: the Irrawaddy River, 6: the Brahmaputra River, 7: the Indus River, 8: the Tarim River, and 9: the Ganges River. This figure was plotted using the Generic Mapping Tools (GMT) V4.5.0 (https://www.soest.hawaii.edu/gmt/).
Figure 3
Figure 3
(a) Locations of 5 groups of stations that display different precipitation gradients with elevation identified in (b) on the TPS. Group Red consists of 94 stations; Group Yellow 6 stations; Group Purple 21 stations; Group Green 35 stations; and Group Blue 28 stations. This figure was plotted using the Generic Mapping Tools (GMT) V4.5.0 (https://www.soest.hawaii.edu/gmt/).
Figure 4
Figure 4
Locations of the ERA-Interim cells whose wet season precipitation is correlated statistically significantly at 90% confidence level with that of the corresponding stations (a). Vertical distributions of wet season precipitation (b), total column water vapor (TCWV) (c), convective available potential energy (CAPE) (d), and lifting condensation level (LCL) (e) with ERA-Interim elevation for the ERA-Interim cells that are separated into the same color-coded 5 groups as for the observations. This figure was plotted using the Generic Mapping Tools (GMT) V4.5.0 (https://www.soest.hawaii.edu/gmt/).
Figure 5
Figure 5
Locations of the MERRA2 cells whose wet season precipitation is correlated statistically significantly at 90% confidence level with that of the corresponding stations (a). Vertical distributions of wet season precipitation (b), total column water vapor (TCWV) (c), convective available potential energy (CAPE) (d), and lifting condensation level (LCL) (e) with MERRA2 elevation for the MERRA2 cells that are separated into the same color-coded 5 groups as for the observations. This figure was plotted using the Generic Mapping Tools (GMT) V4.5.0 (https://www.soest.hawaii.edu/gmt/).

References

    1. Jarvis, A., Reuter, H.I., Nelson, A., & Guevara, E. Hole-filled SRTM for the globe Version 4, available from the CGIAR-CSI SRTM 90 m Database (https://srtm.csi.cgiar.org) (2008).
    1. Manabe S, Broccoli AJ. Mountains and arid climate of middle latitudes. Science. 1990;247:192–195. doi: 10.1126/science.247.4939.192. - DOI - PubMed
    1. Yanai M, Li C, Song Z. Seasonal heating of the Tibetan Plateau and its effects on the evolution of the summer monsoon. J. Meteor. Soc. Japan. 1992;70:319–351. doi: 10.2151/jmsj1965.70.1B_319. - DOI
    1. Molnar P, Boos WR, Battisti DS. Orographic controls on climate and paleoclimate of Asia: thermal and mechanical roles for the Tibetan Plateau. Annual Review of Earth and Planetary Sciences. 2010;38:77–102. doi: 10.1146/annurev-earth-040809-152456. - DOI
    1. Si D, Ding Y. Decadal change in the correlation pattern between the Tibetan Plateau winter snow and the East Asian Summer precipitation during 1979–2011. Journal of Climate. 2013;26:7622–7634. doi: 10.1175/JCLI-D-12-00587.1. - DOI

Publication types

LinkOut - more resources