. 2017 Jul 11;7(1):5040.
doi: 10.1038/s41598-017-05052-2.

The energy disruptor metformin targets mitochondrial integrity via modification of calcium flux in cancer cells

Affiliations

The energy disruptor metformin targets mitochondrial integrity via modification of calcium flux in cancer cells

Camille Loubiere et al. Sci Rep. .

Abstract

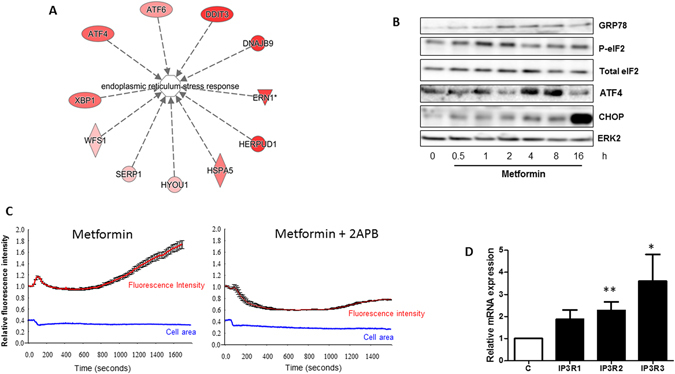
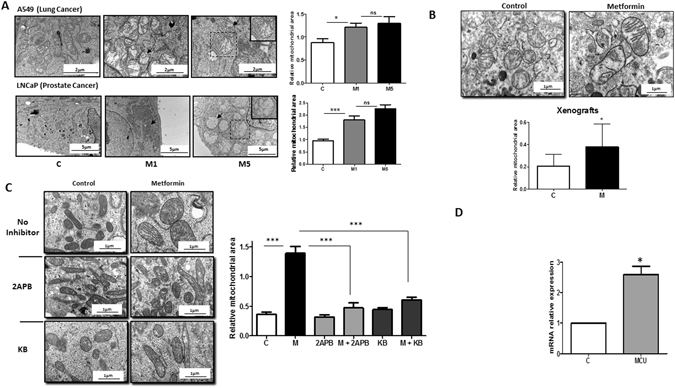
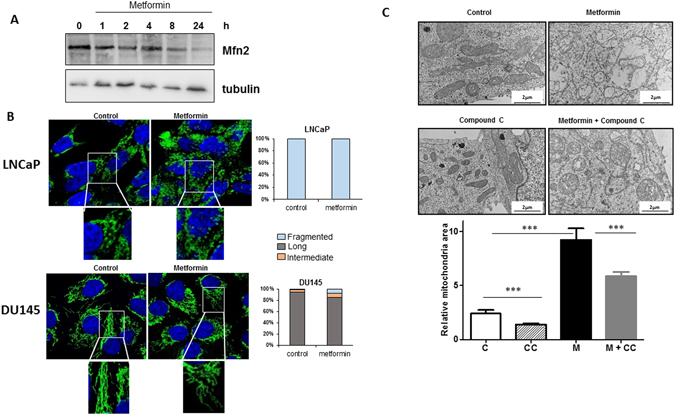
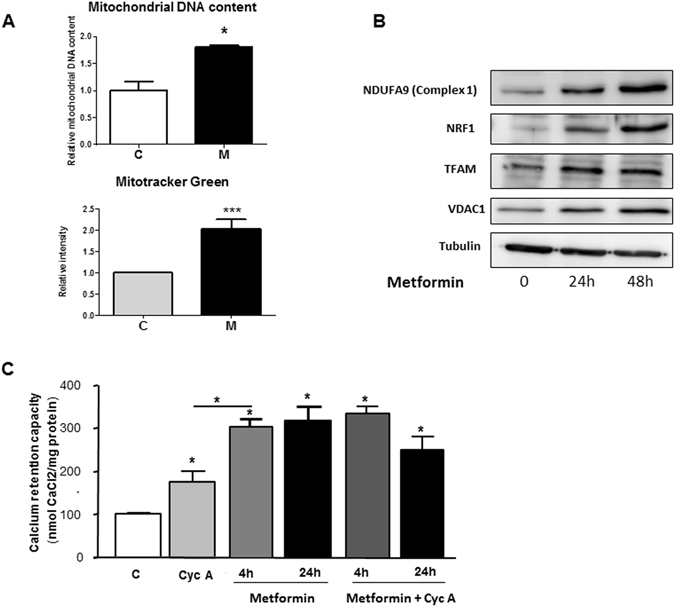
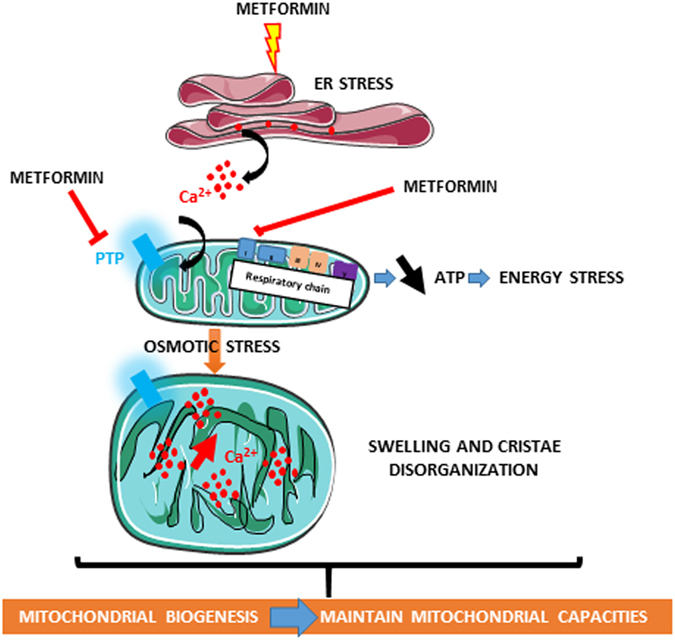
Mitochondrial integrity is critical for the regulation of cellular energy and apoptosis. Metformin is an energy disruptor targeting complex I of the respiratory chain. We demonstrate that metformin induces endoplasmic reticulum (ER) stress, calcium release from the ER and subsequent uptake of calcium into the mitochondria, thus leading to mitochondrial swelling. Metformin triggers the disorganization of the cristae and inner mitochondrial membrane in several cancer cells and tumors. Mechanistically, these alterations were found to be due to calcium entry into the mitochondria, because the swelling induced by metformin was reversed by the inhibition of mitochondrial calcium uniporter (MCU). We also demonstrated that metformin inhibits the opening of mPTP and induces mitochondrial biogenesis. Altogether, the inhibition of mPTP and the increase in mitochondrial biogenesis may account for the poor pro-apoptotic effect of metformin in cancer cells.


Conflict of interest statement

The authors declare that they have no competing interests.

Figures

Figure 1
Figure 1
Metformin induces ER stress and calcium release from the ER. (A) List of genes related to the ER stress pathway and significantly upregulated in LNCaP cells treated with 5 mM metformin for 14 h. (B) Immunoblotting of LNCaP cells treated with 5 mM metformin for the indicated times by using antibodies directed against the indicated proteins implicated in ER stress response. The immunoblot is representative of three independent experiments. The blots represent (C) Relative fluorescence intensity of the Fluo-4AM probe, measured in LNCaP cells. 2-ABP (40 µM) was added 15 min before the addition of 5 mM metformin at time 0. The cellular area was monitored during the experiment (blue line). At least 30 single cells were monitored for each condition. The graph represents the mean fluorescence intensity +/− sem. (D) Quantification of IP3R mRNA in LNCaP cells treated with metformin for 24 h. p < 0.05 (*); p < 0.01 (**).
Figure 2
Figure 2
Metformin induces mitochondrial swelling in cancer cells in vitro and in vivo. (A) Electron microscopy (EM) of LNCaP (PCa) and A549 (lung cancer) cells treated with 1 and 5 mM metformin for 24 h. The graphs represent the mean of the relative mitochondrial area. An example of swollen mitochondria with modifications of the IMM is noted with an arrow. The inset shows a magnified view of a representative mitochondrion. (B) Electron microscopy images of representative mitochondria from tumor xenografts, and quantification of the relative mitochondrial area in the corresponding tumors. The error bars represent the standard error of the mean (sem). (C) Electron microscopy images of LNCaP cells treated with metformin and 40 µM 2-ABP or 10 µM KB-R7943 for 24 h. Quantification of the mitochondrial area is reported in the graph (left panel). For each condition, 60 to 100 mitochondria from several cells were analyzed by EM. (D) Quantification of MCU mRNA in LNCaP cells treated with metformin for 24 h. The differences are significant with p < 0.05 (*) and p < 0.001 (***).
Figure 3
Figure 3
Metformin does not induce fission of the mitochondrial network, and mitochondrial swelling is partially dependent on AMPK. (A) LNCaP cells were treated with metformin for the indicated times, and Mfn2 expression was monitored at different time by immunoblotting. (B) LNCaP and DU145 cells were treated for 24 h with 5 mM metformin and stained with Tom20 for immunofluorescence analysis. Representative IF images are shown with the quantification of the morphology of the mitochondrial network. The data from the counting of at least 100 cells are shown. (C) LNCaP cells were treated with 5 mM metformin for 24 h in the presence or absence of 20 µM of compound C (CC). Representative electronic microscopy images are shown, and the graph represents the mean of the relative mitochondrial area. For each condition, 60 to 100 mitochondria from several cells were analyzed by EM, p < 0.001 (***).
Figure 4
Figure 4
Metformin increases mitochondrial biogenesis in cancer cells and inhibits mitochondrial permeability transition pore. (A) Mitochondrial DNA content and quantification of MitoTracker Green in LNCaP cells treated with metformin for 24 h. The results were obtained from three independent experiments. p < 0.05 (*); p < 0.001 (***). (B) Immunoblotting analyses of proteins and transcription factors implicated in mitochondrial function, after treatment with 5 mM metformin for 24 and 48 h. (C) Calcium retention capacity measured after the incubation of LNCaP cells with 1 µM cyclosporin A for 4 h or 5 mM metformin for 4 h and 24 h.
Figure 5
Figure 5
Schematic representation of the effects of metformin on mitochondrial biology in cancer cells. The illustrations were created by adopting templates from Servier Medical Arts (http://www.servier.fr/smart/banque-dimages-powerpoint) which are free for use under the terms of the Creative Commons 3.0 License.

References

    1. Bost F, Decoux-Poullot AG, Tanti JF, Clavel S. Energy disruptors: rising stars in anticancer therapy? Oncogenesis. 2016;5:e188. doi: 10.1038/oncsis.2015.46. - DOI - PMC - PubMed
    1. Bost F, Ben Sahra I, Le Marchand-Brustel Y, Tanti JF. Metformin and cancer therapy. Curr Opin Oncol. 2012;24:103–108. doi: 10.1097/CCO.0b013e32834d8155. - DOI - PubMed
    1. Zakikhani M, Dowling R, Fantus IG, Sonenberg N, Pollak M. Metformin is an AMP kinase-dependent growth inhibitor for breast cancer cells. Cancer Res. 2006;66:10269–10273. doi: 10.1158/0008-5472.CAN-06-1500. - DOI - PubMed
    1. El-Mir MY, et al. Dimethylbiguanide inhibits cell respiration via an indirect effect targeted on the respiratory chain complex I. J Biol Chem. 2000;275:223–228. doi: 10.1074/jbc.275.1.223. - DOI - PubMed
    1. Bridges HR, Jones AJ, Pollak MN, Hirst J. Effects of metformin and other biguanides on oxidative phosphorylation in mitochondria. Biochem J. 2014;462:475–487. doi: 10.1042/BJ20140620. - DOI - PMC - PubMed

Publication types

MeSH terms

Substances