. 2017 Jul 11;7(1):5094.
doi: 10.1038/s41598-017-05283-3.

Intercellular adhesion molecule-1 augments myoblast adhesion and fusion through homophilic trans-interactions

Affiliations

Intercellular adhesion molecule-1 augments myoblast adhesion and fusion through homophilic trans-interactions

Francis X Pizza et al. Sci Rep. .

Abstract

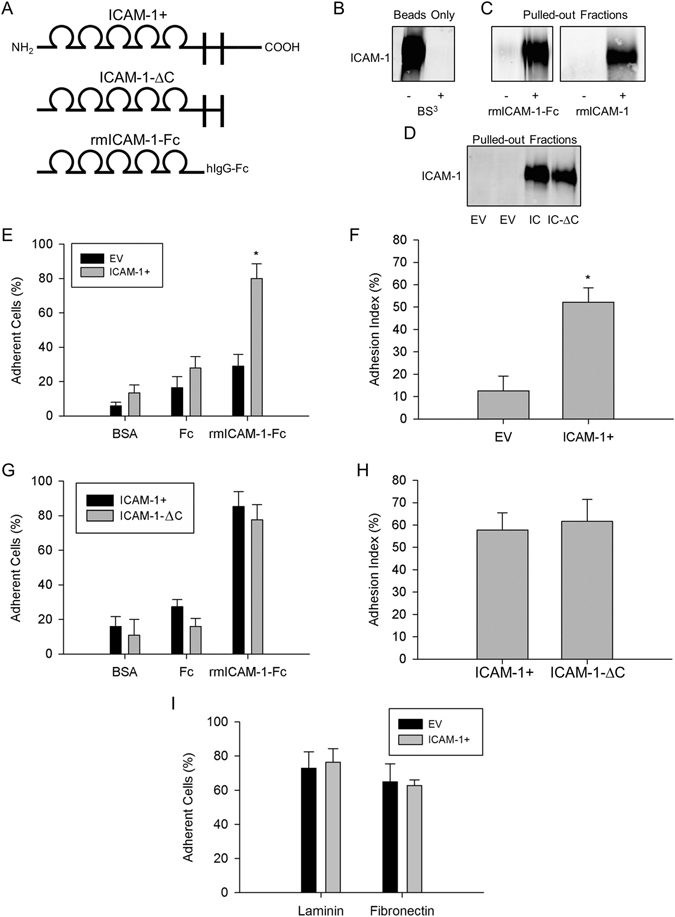
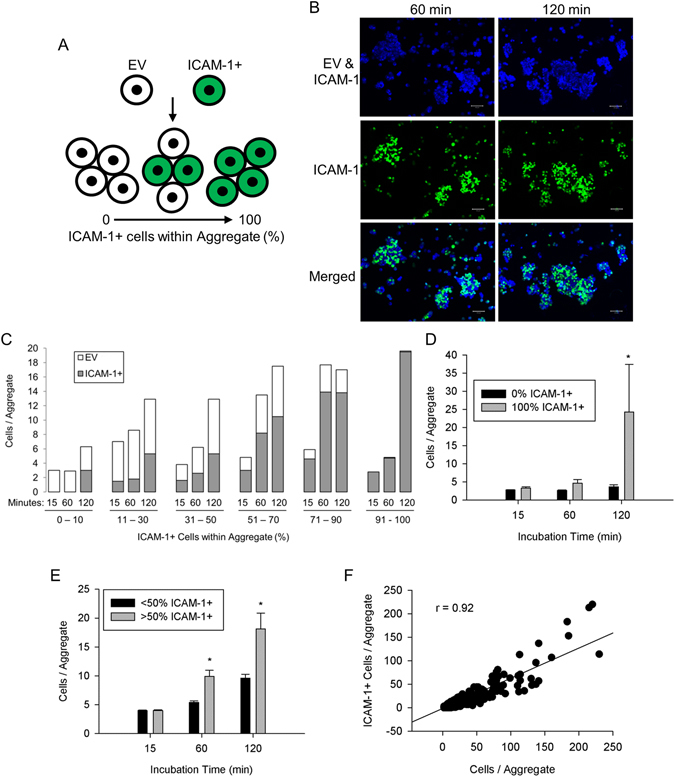
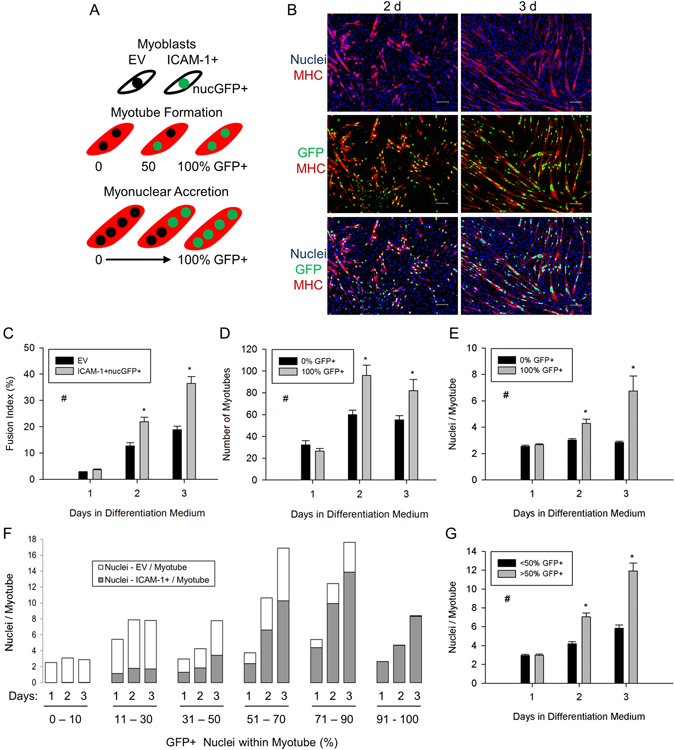
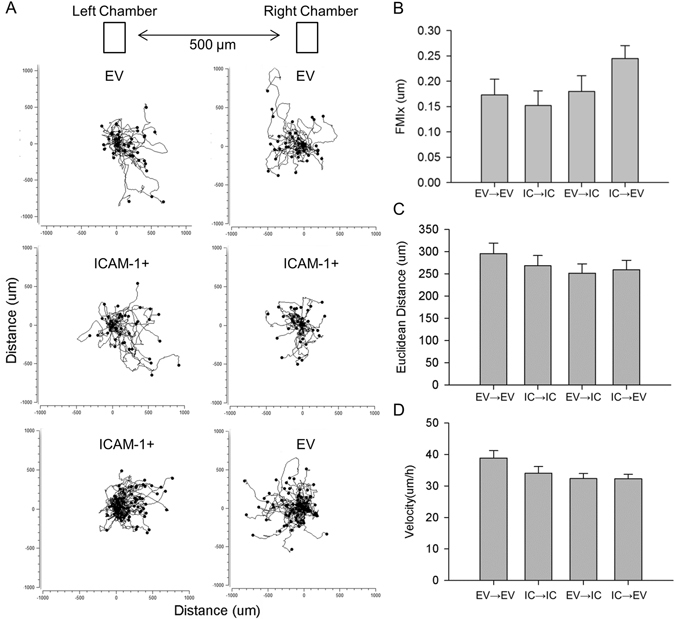
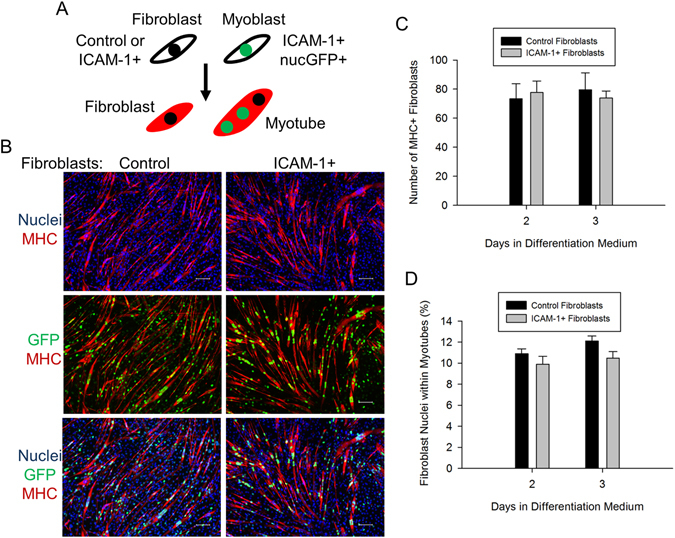
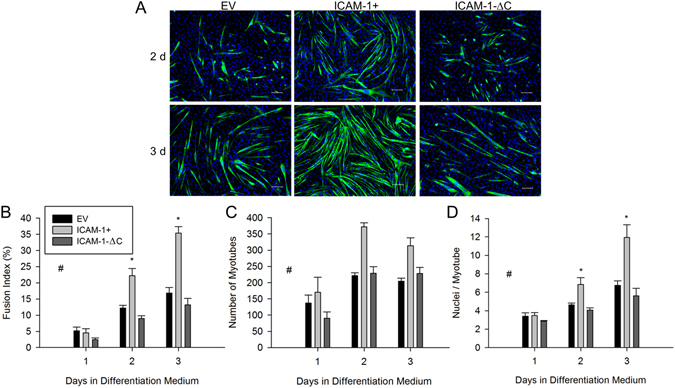
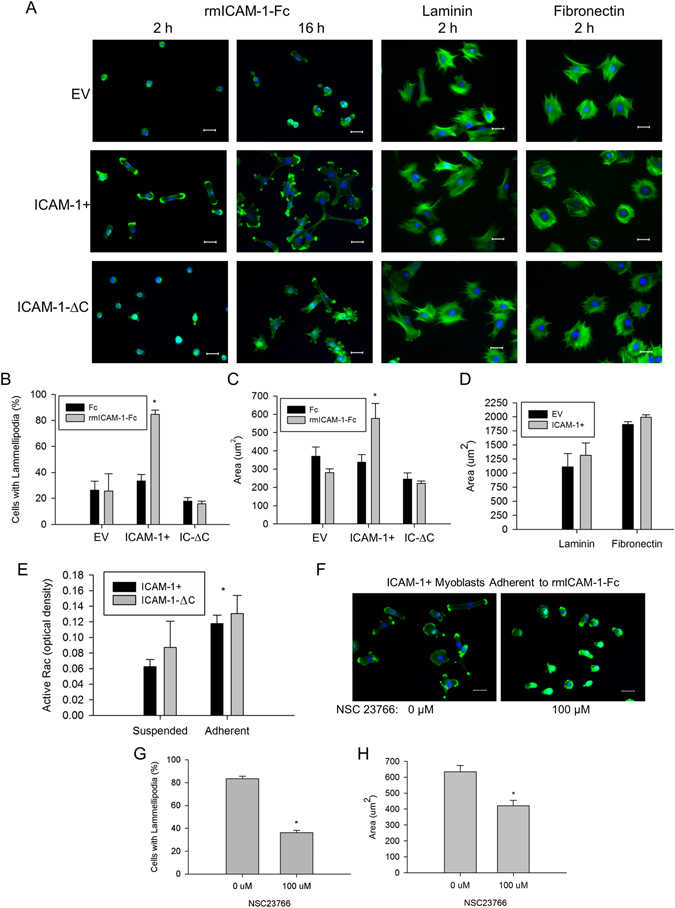
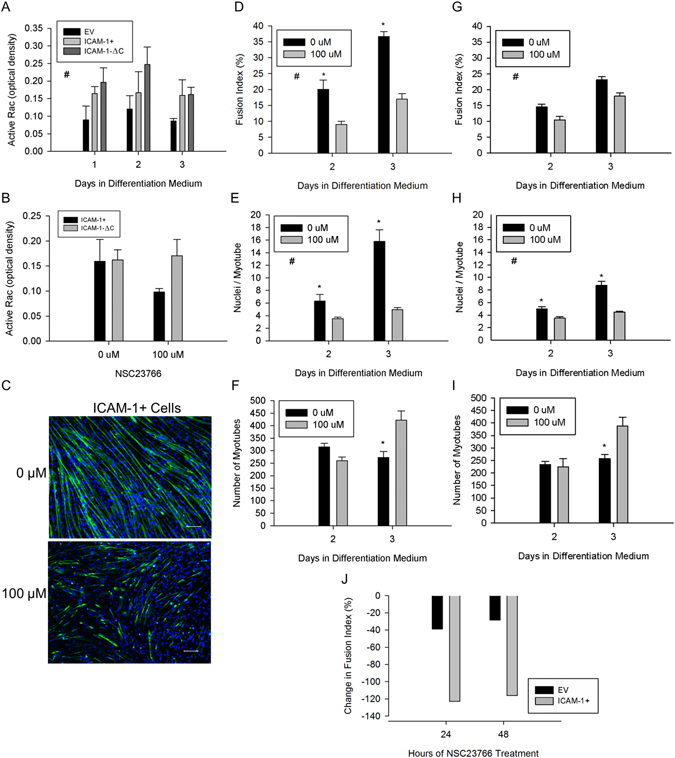
The overall objective of the study was to identify mechanisms through which intercellular adhesion molecule-1 (ICAM-1) augments the adhesive and fusogenic properties of myogenic cells. Hypotheses were tested using cultured myoblasts and fibroblasts, which do not constitutively express ICAM-1, and myoblasts and fibroblasts forced to express full length ICAM-1 or a truncated form lacking the cytoplasmic domain of ICAM-1. ICAM-1 mediated myoblast adhesion and fusion were quantified using novel assays and cell mixing experiments. We report that ICAM-1 augments myoblast adhesion to myoblasts and myotubes through homophilic trans-interactions. Such adhesive interactions enhanced levels of active Rac in adherent and fusing myoblasts, as well as triggered lamellipodia, spreading, and fusion of myoblasts through the signaling function of the cytoplasmic domain of ICAM-1. Rac inhibition negated ICAM-1 mediated lamellipodia, spreading, and fusion of myoblasts. The fusogenic property of ICAM-1-ICAM-1 interactions was restricted to myogenic cells, as forced expression of ICAM-1 by fibroblasts did not augment their fusion to ICAM-1+ myoblasts/myotubes. We conclude that ICAM-1 augments myoblast adhesion and fusion through its ability to self-associate and initiate Rac-mediated remodeling of the actin cytoskeleton.


Conflict of interest statement

The authors declare that they have no competing interests.

Figures

Figure 1
Figure 1
ICAM-1-ICAM-1 interactions in myoblast adhesion. (A) Structure of ICAM-1 in ICAM-1+ and ICAM-1-∆C cells, as well as rmICAM-1-Fc. Cartoon depicts the 5 extracellular IgG-like domains, transmembrane segment, and the cytoplasmic domain of ICAM-1. (B) Western blot for ICAM-1 in beads coated with rmICAM-1-Fc. BS3 was used to covalently link rmICAM-1-Fc to beads. The cropped area corresponds to 150–100 kDa and the ICAM-1 band appeared at ~110 kDa. (C) Beads crosslinked with ICAM-1 were incubated with PBS-T, rmICAM-1-Fc or rmICAM-1. ICAM-1 was detected in pulled-out fractions via western blotting. (D) Western blots for ICAM-1 in pulled-out fractions of EV, ICAM-1+ (IC), and ICAM-1-∆C (IC-∆C) myoblasts. (E) The percentage of EV and ICAM-1+ myoblast that adhere to bovine serum albumin (BSA), rhIgG1-Fc (Fc), or rmICAM-1-Fc. *Higher for ICAM-1+ compared to EV myoblasts for rmICAM-1-Fc (interaction effect; p < 0.005). (F) Adhesion index for EV and ICAM-1+ myoblasts. *Higher (p < 0.005) for ICAM-1+ compared to EV myoblasts. (G) The percentage of ICAM-1+ and ICAM-1-∆C myoblasts that adhere to BSA, Fc, and rmICAM-1-Fc. (H) Adhesion index for ICAM-1+ and ICAM-1-∆C myoblasts. (I) The percentage of EV and ICAM-1+ myoblasts that adhere laminin and fibronectin (p = 0.56). n = 4 replicates for each experimental condition and data set.
Figure 2
Figure 2
ICAM-1-ICAM-1 interactions in myoblast-myoblast adhesion. (A) ICAM-1+ myoblasts were labeled with CellTracker™ Green, mixed with EV myoblasts in equal number, and the number of EV and ICAM-1+ myoblasts within aggregates was quantified. (B) Images of wheat germ agglutinin (WGA; blue), which delineated both EV and ICAM-1+ myoblasts, and ICAM-1+ myoblasts (green) at 60 and 120 min of incubation (scale bar = 100 µm). (C) Frequency distribution of the average number of EV and ICAM-1+ myoblasts within aggregates as a function of the percentage of ICAM-1+ myoblasts within the aggregate. The number of aggregates analyzed was 1818, 1336, and 948 at 15, 60, and 120 min of incubation, respectively. (D) The average number of myoblasts/aggregate for aggregates that contained only EV (0% ICAM-1+) or ICAM-1+ (100% ICAM-1+) myoblasts. *Higher for 100% ICAM-1+ compared to 0% ICAM-1+ at 120 min of incubation (interaction effect; p < 0.001). (E) The average number of myoblasts/aggregate for aggregates that contained primarily ICAM-1+ (>50% ICAM-1+) or EV myoblasts (≤50% ICAM-1+). *Higher for >50% ICAM-1+ compared to ≤ 50% ICAM-1+ at 60 and 120 min of incubation (interaction effect; p < 0.001). (F) Scatter plot of the number of ICAM-1+ myoblasts/aggregate vs. the number myoblasts/aggregate (n = 2232 aggregates at 60 and 120 min of incubation). A high Pearson-product moment correlation was observed (r = 0.92; p < 0.001).
Figure 3
Figure 3
ICAM-1-ICAM-1 interactions in myoblast fusion. (A) EV and ICAM-1+ nucGFP+ myoblasts were mixed in equal number, and myotube indices were quantified through 3 d of differentiation. MHC expression (red) was used a marker of myogenic cell differentiation. (B) Images of DAPI+ nuclei (blue) of EV and ICAM-1+ nucGFP+ myoblasts, MHC (red), and nuclei of ICAM-1+ nucGFP+ myoblasts (green) at 2 and 3 d of differentiation (scale bar = 100 µm). (C) Fusion index for EV and ICAM-1+ nucGFP+ myoblasts. #Higher for ICAM-1+ nucGFP+ compared to EV cells throughout 3 d of differentiation (main effect for cell line; p < 0.001). *Higher for ICAM-1+ nucGFP+ compared to EV cells at indicated day of differentiation (interaction effect; p < 0.001). (D and E) Myotube number (D) and the average number of nuclei within myotubes (E) that contained nuclei from only EV (0% GFP+) or ICAM-1+ nucGFP+ (100% GFP+) myoblasts. #Higher for 100% GFP+ compared to 0% GFP+ throughout 3 d of differentiation (main effect for cell line; p < 0.001). *Higher for 100% GFP+ compared to 0% GFP+ at indicated day of differentiation (interaction effect; p < 0.05). (F) Frequency distribution of the average number of nuclei from EV and ICAM-1+ nucGFP+ myoblasts within individual myotubes as a function of the percentage of GFP+ nuclei within a myotube. The number of myotubes analyzed was 425, 1845, and 1741 at 1, 2, and 3 d of differentiation, respectively. (G) The average number of nuclei/myotube for myotubes that contained nuclei primarily from ICAM-1+ nucGFP+ (>50% GFP+) or EV myoblasts (≤50% GFP+). #Higher for >50% GFP+ compared to ≤50% GFP+ throughout 3 d of differentiation (main effect for cell line; p < 0.005). *Higher for >50% GFP+ compared to ≤50% GFP+ at indicated day of differentiation (interaction effect; p < 0.005). n = 4–6 replicates at each day of differentiation.
Figure 4
Figure 4
Directed migration of myoblasts. EV or ICAM-1+ myoblasts were seeded into the left and/or right chamber, treated with differentiation medium for 1 d, and their migratory paths were tracked for 20 h after removing the chamber from wells. (A) Migratory paths of EV and ICAM-1+ (IC) myoblasts towards EV or ICAM-1+ myoblasts. (BD) FMIx (B; p = 0.12), Euclidean distance (C), and velocity (D) of migratory paths. A total of 80 myoblasts for each cell line were analyzed in 4 independent experiments.
Figure 5
Figure 5
ICAM-1-ICAM-1 interactions in the myogenic conversion of fibroblasts. (A) Control or ICAM-1+ fibroblasts were mixed in equal number with ICAM-1+ nucGFP+ myoblasts and the number of fibroblasts expressing MHC (red) and the number of fibroblast nuclei within myotubes were quantified. (B) Images of DAPI+ nuclei of fibroblasts and myoblasts (blue), MHC (red), and nuclei of ICAM-1+ nucGFP+ myoblasts (green) at 3 d of differentiation (scale bar = 100 µm). (C,D) Average number of MHC+ fibroblasts (C) and the percentage of fibroblast nuclei within myotubes (D). n = 6 replicates per group.
Figure 6
Figure 6
Cytoplasmic domain of ICAM-1 in myoblast fusion. (A) Images of MHC (green) and nuclei (blue) in EV, ICAM-1+, and ICAM-1-∆C cells at 2 and 3 d of differentiation (scale bar = 100 µm). (B–D) Fusion index (B), myotube number (C), and average number of nuclei within myotubes (D). #Higher for ICAM-1+ compared to EV and ICAM-1-∆C cells throughout 3 d of differentiation (main effect for cell line; p < 0.001). *Higher for ICAM-1+ compared to EV and ICAM-1-∆C cells at indicated day of differentiation (interaction effect; p < 0.003). n = 4–6 replicates per group.
Figure 7
Figure 7
Adhesion-induced alterations in the actin cytoskeleton and Rac activity. (A) Images of F-actin (green) and nuclei (blue) in myoblasts adherent to rmICAM-1-Fc, laminin, or fibronectin (scale bar = 25 µm). (B) Percentage of cells with one of more prominent lamellipodium 2 h after myoblasts to wells coated with hIgG-Fc (Fc) and rmICAM-1-Fc. *Higher for ICAM-1+ compared to EV and ICAM-1-∆C myoblasts (interaction effect; p < 0.001). n = 4 replicates per group. A total of 149–406 myoblasts for each cell line were analyzed. (C) Cytoplasmic area 2 h after adding myoblasts to Fc and rmICAM-1-Fc coated wells. A total of 154–326 myoblasts for each cell line were analyzed. *Higher for ICAM-1+ compared to EV and ICAM-1-∆C myoblasts (interaction effect; p < 0.001). n = 4 replicates per group. (D) Cytoplasmic area 2 h after adding myoblasts to laminin and fibronectin coated wells. n = 4 replicates per group. A total of 261–291 myoblasts for each cell line were analyzed. (E) Active Rac in ICAM-1+ and ICAM-1-∆C myoblasts in suspension and adherent to rmICAM-1-Fc. *Higher for adherent compared to suspended myoblasts (main effect; p < 0.05). n = 4 replicates per group. (F) Images of F-actin (green) and nuclei (blue) of ICAM-1+ myoblasts adherent to rmICAM-1-Fc after a 2 treatment with NSC23766. (G) Percentage of cells with one of more prominent lamellipodium after a 2 treatment with NSC23766. A total of 583–604 ICAM-1+ myoblasts were analyzed. *Lower for 100 µM compared to 0 µM (p < 0.001). n = 6 replicates per group. (H) Cytoplasmic area for ICAM-1+ myoblasts adherent to rmICAM-1-Fc after a 2 h treatment with NSC23766. A total of 365–495 ICAM-1+ myoblasts were analyzed. *Lower for 100 µM compared to 0 µM (p < 0.003). n = 6 replicates per group.
Figure 8
Figure 8
Rac activity in ICAM-1 mediated myoblast fusion. (A) Active Rac through 3 d of differentiation. #Higher for ICAM-1+ and ICAM-1-∆C compared to EV cells throughout 3 d of differentiation (main effect for cell line; p = 0.004). n = 4 replicates per group. (B) Active Rac after treating ICAM-1+ and ICAM-1-∆C cells at 1 d of differentiation with NSC23766 (100 µM) for 48 h. n = 4 replicates per group. (C) Representative images of MHC (green) and nuclei (blue) in ICAM-1+ cells after treating them at 1 d of differentiation with NSC23766 (100 µM) for 48 h. (D–F) Fusion index (D), average number of nuclei within myotubes (E), and myotube number (F) in ICAM-1+ cells after a 24 or 48 h treatment with NSC23766 (100 µM). #Significant (p < 0.001) main effect for concentration of NSC23766. *Significant (p < 0.05) interaction effect at specified day of differentiation. n = 4–6 replicates per group. (GI) Fusion index (G), average number of nuclei within myotubes (H), and myotube number (I) in EV cells after a 24 or 48 h treatment with NSC23766 (100 µM). #Significant (p < 0.001) main effect for concentration of NSC23766. *Significant (p < 0.05) interaction effect at specified day of differentiation. n = 4–6 replicates per group. (J) Percent change in the group mean for fusion index in EV and ICAM-1+ cells treated with NSC23766 (100 µM).

Similar articles

Cited by

References

    1. Pavlath, G. K. Current Progress Towards Understanding Mechanisms of Myoblast Fusion in Mammals. (Springer-Verlag Berlin, Heidelberger Platz 3, D-14197 Berlin, Germany, 2011).
    1. Krauss RS. Regulation of promyogenic signal transduction by cell-cell contact and adhesion. Experimental cell research. 2010;316:3042–3049. doi: 10.1016/j.yexcr.2010.05.008. - DOI - PMC - PubMed
    1. Nowak SJ, Nahirney PC, Hadjantonakis AK, Baylies MK. Nap1-mediated actin remodeling is essential for mammalian myoblast fusion. Journal of cell science. 2009;122:3282–3293. doi: 10.1242/jcs.047597. - DOI - PMC - PubMed
    1. Goh Q, et al. Intercellular adhesion molecule-1 expression by skeletal muscle cells augments myogenesis. Experimental cell research. 2015;331:292–308. doi: 10.1016/j.yexcr.2014.09.032. - DOI - PMC - PubMed
    1. Lepper C, Partridge TA, Fan CM. An absolute requirement for Pax7-positive satellite cells in acute injury-induced skeletal muscle regeneration. Development. 2011;138:3639–3646. doi: 10.1242/dev.067595. - DOI - PMC - PubMed

Publication types

MeSH terms

LinkOut - more resources