Observational Study
. 2017 Jul 11;7(1):5108.
doi: 10.1038/s41598-017-05374-1.

Metabolomic similarities between bronchoalveolar lavage fluid and plasma in humans and mice

Affiliations
Observational Study

Metabolomic similarities between bronchoalveolar lavage fluid and plasma in humans and mice

Charmion Cruickshank-Quinn et al. Sci Rep. .

Abstract

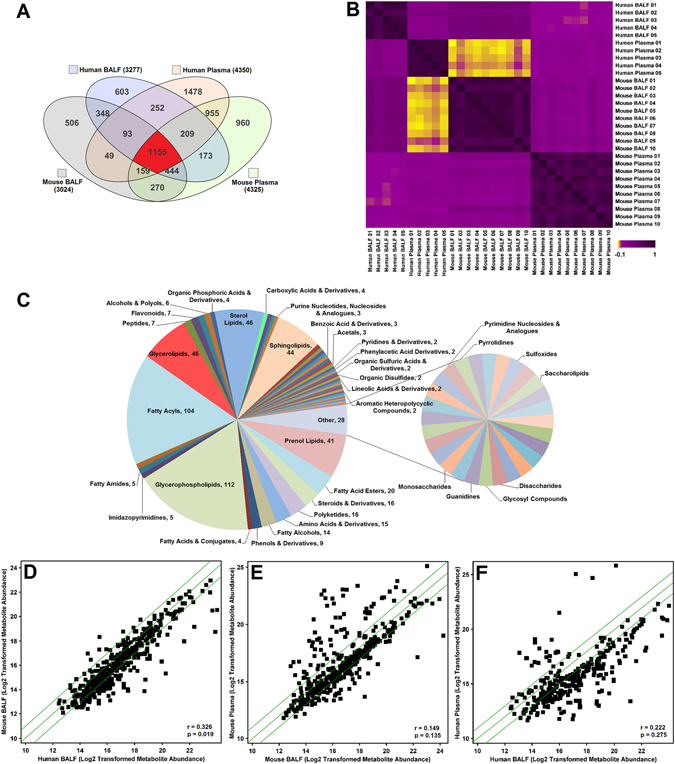
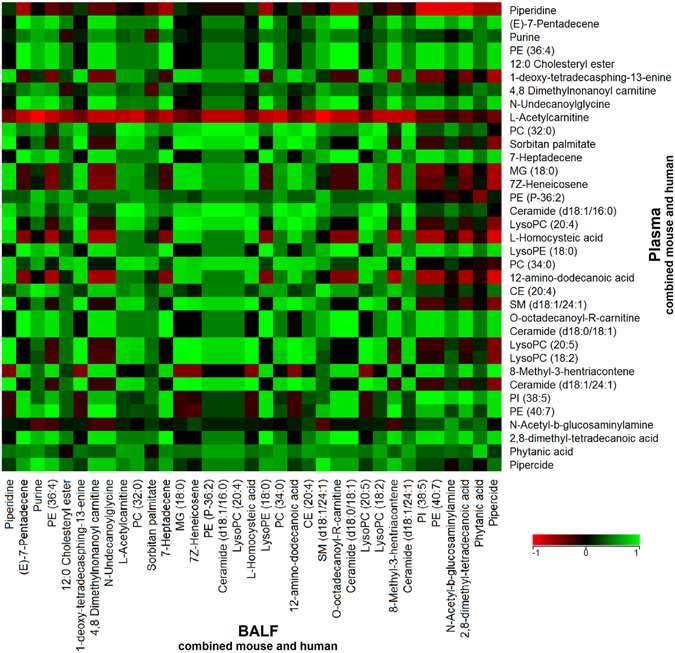
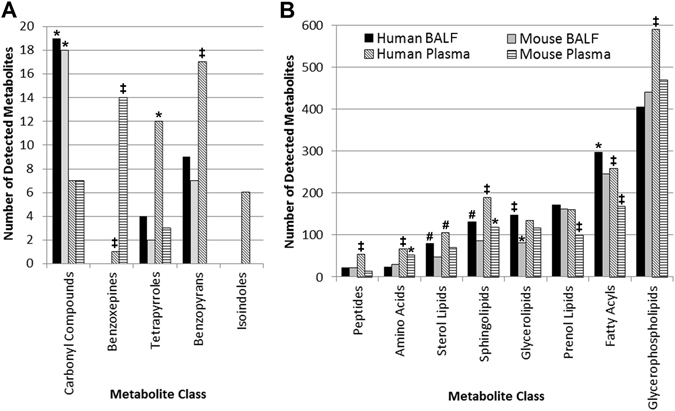
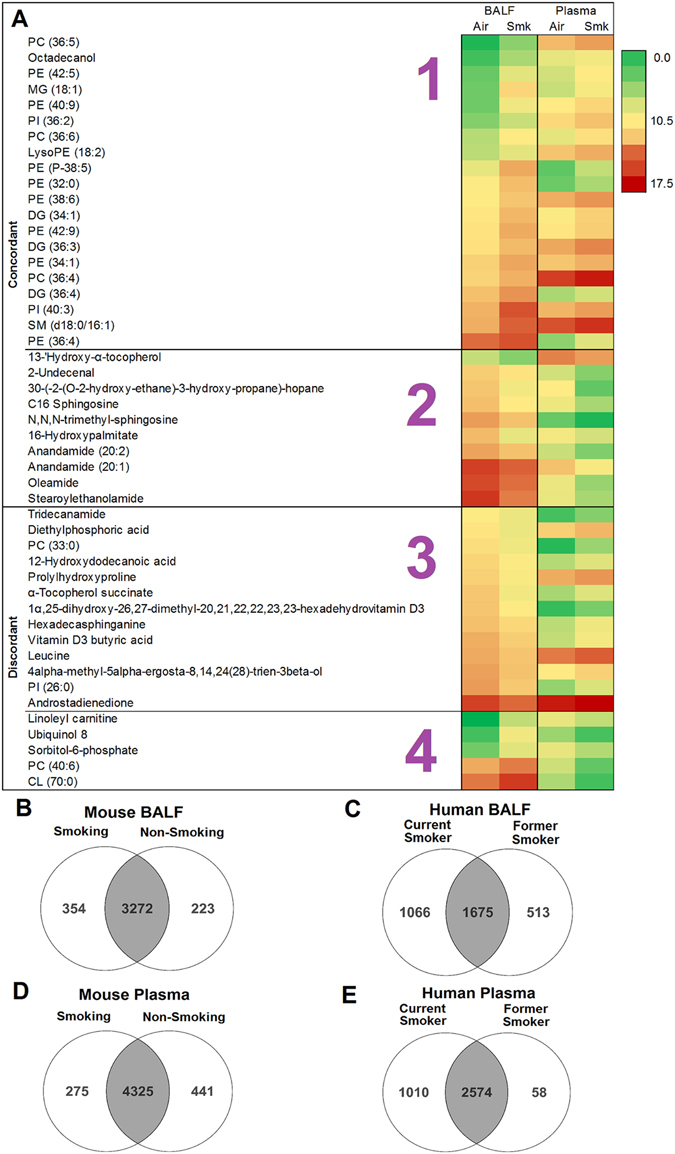
This observational study catalogues the overlap in metabolites between matched bronchoalveolar lavage fluid (BALF) and plasma, identifies the degree of congruence between these metabolomes in human and mouse, and determines how molecules may change in response to cigarette smoke (CS) exposure. Matched BALF and plasma was collected from mice (ambient air or CS-exposed) and humans (current or former smokers), and analyzed using mass spectrometry. There were 1155 compounds in common in all 4 sample types; fatty acyls and glycerophospholipids strongly overlapped between groups. In humans and mice, more than half of the metabolites present in BALF were also present in plasma. Mouse BALF and human BALF had a strong positive correlation with 2040 metabolites in common, suggesting that mouse models can be used to interrogate human lung metabolome changes. While power was affected by small sample size in the mouse study, the BALF metabolome appeared to be more affected by CS than plasma. CS-exposed mice showed increased plasma and BALF glycerolipids and glycerophospholipids. This is the first report cataloguing the metabolites present across mouse and human, BALF and plasma. Findings are relevant to translational studies where mouse models are used to examine human disease, and where plasma may be interrogated in lieu of BALF or lung tissue.


Conflict of interest statement

The authors declare that they have no competing interests.

Figures

Figure 1
Figure 1
Metabolite relationships across species and biofluids. (A) Overlap of metabolites represented with a venn diagram of metabolites identified in both aqueous and lipid fractions filtered for presence in at least 2 samples within each group. (B) Spearman correlation matrix of species and biofluid based on detected lipids in the samples, with yellow (r = −0.1) representing a negative correlation, and purple (r = 1) representing a positive correlation. (C) Distribution of biochemical classes represented by metabolites that were detected in human and mouse, BALF and plasma (1155) from Fig. 1A. Classes were based on Lipid Maps and HMDB classifications. The number of metabolites corresponding to the overlap is indicated next to the name of the class. (D) Scatter plot showing a positive correlation in metabolites between mouse BALF and human BALF. (E) Scatter plot showing a positive correlation in metabolites between mouse plasma and mouse BALF. (F) Scatter plot showing a positive correlation in metabolites between human plasma and human BALF. In the scatterplots, each square represents an individual metabolite. The metabolites along the diagonal green lines show the strongest positive correlations. The average abundance of each metabolite is scaled between 10 and 24.
Figure 2
Figure 2
Metabolite correlations across BALF and plasma. Data from the mouse and human BALF and plasma samples were combined to identify metabolites that correlated across both biofluids using Spearman rank correlation. Out of 298 annotated metabolites, a subset of 35 metabolites was selected based on their detected high abundances in BALF and plasma. Red indicates a negative correlation (r = −1) across BALF and plasma, green indicates a positive correlation (r =+1), and black indicates no correlation (r = 0) between BALF and plasma.
Figure 3
Figure 3
Metabolite coverage based on compound class for BALF and plasma in mouse and human samples. Indicated classes passed a proportional test used to analyze the metabolites in each of the four indicated groups; *p < 0.05; #p < 0.01; p < 0.001. Metabolite class categories were determined using the Human Metabolome Database (HMDB) and Lipid Maps classifications. (A) Metabolite classes with less than 20 detected metabolites. (B) Metabolite classes with >20–600 detected metabolites.
Figure 4
Figure 4
Metabolome changes in response to cigarette smoke. (A) Heat map of statistically significant and differentially regulated metabolites in mouse BALF and plasma in response to cigarette smoke compared to air control groups (n = 7/group). Metabolite abundances range from 0 (green) to 17.5 (red). Statistical analysis was performed in Mass Profiler Professional 13.1 (Agilent) using Storey with Bootstrapping q ≤ 0.1 and fold change ≥1.5. CL: cardiolipin, PE: phosphatidylethanolamine, PC: phosphatidylcholine, PI: phosphatidylinositol, SM: sphingomyelin, MG: monoglyceride, DG: diglyceride. The four sections of the heat map are as follows: 1 – metabolites are up-regulated in both BALF and plasma, 2 – metabolites are down-regulated in both BALF and plasma, 3 – metabolites are down-regulated in BALF and up-regulated in plasma, 4 – metabolites are up-regulated in BALF and down-regulated in plasma in response to CS-exposure. (B) Overlap of metabolites in BALF from smoking and non-smoking mice. (C) Overlap of metabolites in human BALF from current and former smokers. (D) Overlap of metabolites in plasma from smoking and non-smoking mice. (E) Overlap of metabolites in human plasma from current and former smokers.

Similar articles

Cited by

References

    1. Kazachkov MY, Muhlebach MS, Livasy CA, Noah TL. Lipid-laden macrophage index and inflammation in bronchoalveolar lavage fluids in children. Eur. Respir. J. 2001;18:790–795. doi: 10.1183/09031936.01.00047301. - DOI - PubMed
    1. Tufvesson E, Ekberg M, Bjermer L. Inflammatory Biomarkers in Sputum Predict COPD Exacerbations. Lung. 2013;191:413–416. doi: 10.1007/s00408-013-9473-5. - DOI - PubMed
    1. Chow S, Thomas PS, Malouf M, Yates DH. Exhaled breath condensate (EBC) biomarkers in pulmonary fibrosis. Journal of Breath Research. 2012;6:016004. doi: 10.1088/1752-7155/6/1/016004. - DOI - PubMed
    1. Little FF, et al. Salivary Inflammatory Mediator Profiling and Correlation to Clinical Disease Markers in Asthma. PLoS ONE. 2014;9:e84449. doi: 10.1371/journal.pone.0084449. - DOI - PMC - PubMed
    1. Röpcke S, et al. Repeatability of and Relationship between Potential COPD Biomarkers in Bronchoalveolar Lavage, Bronchial Biopsies, Serum, and Induced Sputum. PLoS ONE. 2012;7:e46207. doi: 10.1371/journal.pone.0046207. - DOI - PMC - PubMed

Publication types

Substances