. 2017 Jul 11;7(1):5096.
doi: 10.1038/s41598-017-05028-2.

Precise spatio-temporal control of rapid optogenetic cell ablation with mem-KillerRed in Zebrafish

Affiliations

Precise spatio-temporal control of rapid optogenetic cell ablation with mem-KillerRed in Zebrafish

C Buckley et al. Sci Rep. .

Abstract

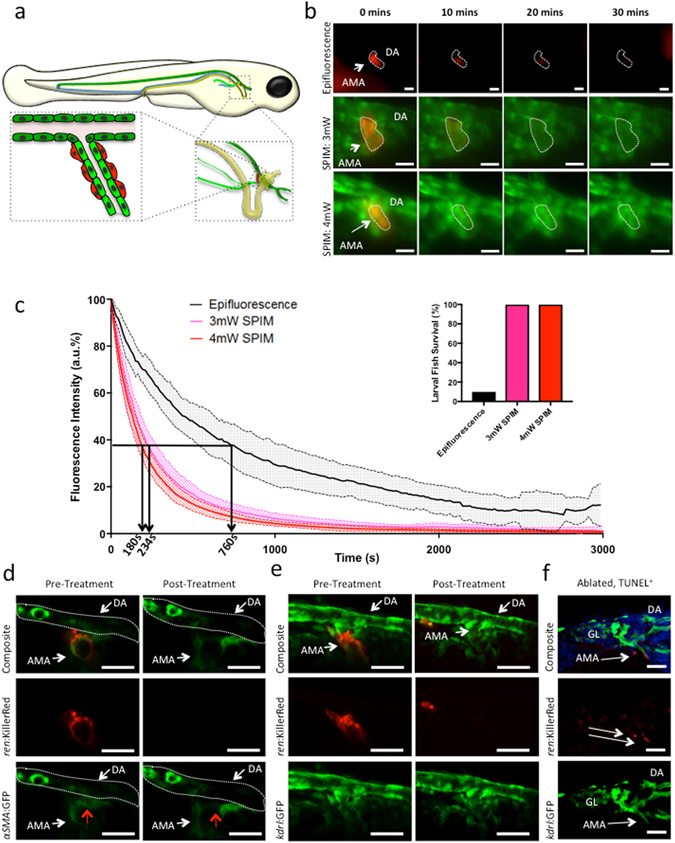
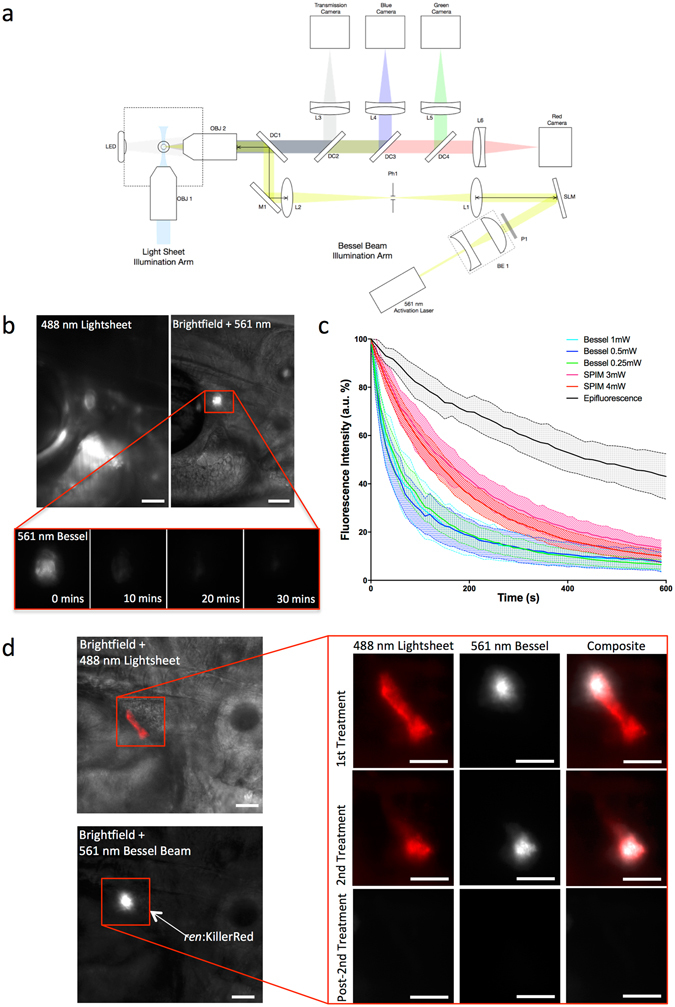
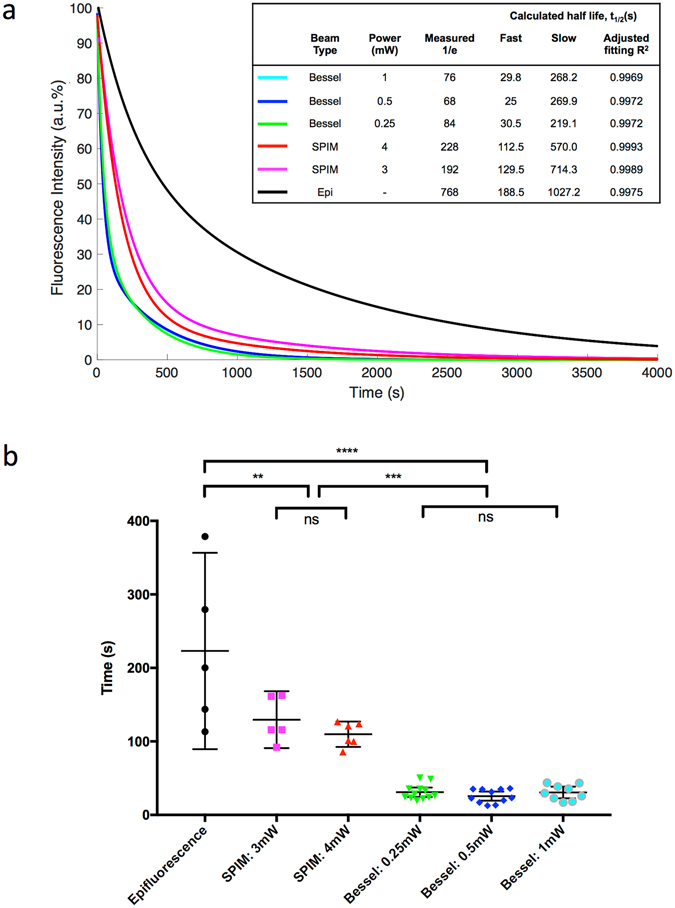
The ability to kill individual or groups of cells in vivo is important for studying cellular processes and their physiological function. Cell-specific genetically encoded photosensitizing proteins, such as KillerRed, permit spatiotemporal optogenetic ablation with low-power laser light. We report dramatically improved resolution and speed of cell targeting in the zebrafish kidney through the use of a selective plane illumination microscope (SPIM). Furthermore, through the novel incorporation of a Bessel beam into the SPIM imaging arm, we were able to improve on targeting speed and precision. The low diffraction of the Bessel beam coupled with the ability to tightly focus it through a high NA lens allowed precise, rapid targeting of subsets of cells at anatomical depth in live, developing zebrafish kidneys. We demonstrate that these specific targeting strategies significantly increase the speed of optoablation as well as fish survival.


Conflict of interest statement

The authors declare that they have no competing interests.

Figures

Figure 1
Figure 1
Evaluation of KillerRed optical targeting in vivo using epifluorescence and SPIM. (a) Schematic showing perivascular renin cell location in 3 dpf zebrafish. Mural renin cells are shown in red, arterial vessels in green, veins in blue, and the glomerulus (GL), nephron and cloaca in yellow. The dorsal aorta (DA) is distinguished from the anterior mesenteric artery (AMA) by using dark and light green to represent them, respectively. (b) ren:mem-KillerRed cells along the AMA budding off the DA in 3 dpf ren:mem-KillerRed;kdrl:GFP fish were illuminated using either an epifluorescence microscope (top panel, mCherry filter, 1hr), or the SPIM light-sheet at 3 mW or 4 mW (bottom panels, maximum intensity projections, 561 nm laser, 1hr). Representative images from 0, 10, 20 and 30 min illumination are shown. (c) Graphs showing the fluorescence intensity as a percentage of maximum intensity (arbitrary fluorescence, a.u.), plotted against time and averaged over n = 6 fish (with 95% confidence intervals, indicated by the filled dashed lines). Arrows and rotated times at foot of arrows indicate the 1/e value. Inset: percentage of fish surviving following illumination by epifluorescence or light-sheet microscopy for 1 hr (n = 18). (d) Morphological changes of ren:mem-KillerRed cells were assessed using multiphoton microscopy (MPM). MPM images of 3 dpf ren:mem-KillerRed;αSMA:GFP renin-expressing cells were taken prior to- and post-treatment using the SPIM light-sheet. Images are presented as single depth slices. Red arrows indicate renin cells. (e) Endothelial cell structure prior to- and post-light treatment using the SPIM light-sheet was assessed using MPM in 3 dpf ren:mem-KillerRed;kdrl:GFP fish. Images are presented as maximum intensity projections. (f) Apoptosis of ren:mem-KillerRed cells was confirmed using an Apop-Tag in-situ TUNEL staining kit on 15 μm sections of 3 dpf ren:mem-KillerRed;kdrl:GFP larvae illuminated with the SPIM and fixed immediately. White arrows designate apoptosis-positive post-treatment KillerRed+ cells. Images show a maximum intensity projection over 5 μm using confocal light scanning microscopy. All scale bars represent 30 μm.
Figure 2
Figure 2
Introduction of a Bessel beam into the imaging path of the SPIM set up allows rapid, localised targeting of KillerRed-expressing cells in vivo. (a) Schematic diagram of the imaging path of the SPIM system, for fluorescence imaging, with the integrated Bessel beam for cell targeting. OBJ1, OBJ2 are objective lenses; LED, light emitting diode; DC1, DC2, DC3, DC4, dichroic mirrors; L1, L2, L3, L4, L5, L6, lenses; SLM, spatial light modulator; BE1, beam expander; P1, polarizer; Ph1, pin hole; M1, mirror. Coloured lines shown in light blue, blue, green, red, grey and yellow represent light paths for the incident SPIM light-sheet, excited blue fluorescence, excited green fluorescence, excited red fluorescence, imaged transmission light and incident Bessel beam illumination, respectively. (b) KillerRed cells in 3 dpf ren:mem-KillerRed larvae (indicated by the red box) were located using low power, low frame-rate 488 nm light-sheet excitation (top left panel). The 561 nm Bessel beam was translated to the correct position and superimposed with brightfield illumination for a single frame (top right panel). Brightfield illumination was then turned off and a fluorescence emission image acquired every 10 s using the Bessel illumination until the fluorescence intensity had decreased to the background level approximately 10 min later (representative images shown in bottom panel). (c) Graphs showing the fluorescence intensity as a percentage of the maximum intensity (arbitrary fluorescence units, a.u.), plotted against time and averaged (with 95% confidence intervals, indicated by the filled dashed lines). Cells were targeted using the Bessel beam with incident powers of 1 mW, 0.5 mW or 0.25 mW (as measured at the back aperture of OBJ2). The fluorescence intensity measured from acquired images and represented as a percentage of the maximum value, averaged over between n = 10 and n = 12 fish. This is represented individually for each power, and as a comparison between the three different targeting methods: epifluorescence illumination, SPIM light sheet illumination and Bessel beam illumination. Data has been truncated at 600 s to clearly show the initial rapid decay when using Bessel illumination. (d) SPIM image showing subsets of KillerRed-expressing cells, which were targeted using the Bessel beam. A representative example is given where the correct location of cells was confirmed using the 488 nm light-sheet, and the 561 nm Bessel beam translated to the dorsal end of the AMA. Relative location within the fish is demonstrated by co-localising fluorescence signal with a brightfield image. Light treatment was performed, targeting a subset of cells (shown before 1st Treatment in the top panel) along the AMA and the decrease in fluorescence intensity confirmed using the light-sheet (shown before 2nd Treatment in the second panel). The remaining cells, which showed no decrease in fluorescence intensity after the first treatment, were then targeted for a second treatment. No evidence of KillerRed expression remained after the second light treatment (shown in the bottom Post-2nd Treatment panel). All scale bars represent 30 μm.
Figure 3
Figure 3
Fitting of decay curves highlights distinction between targeting speed. (a) Averaged fluorescence intensity profiles for each group were fitted to two-term exponential functions. The calculated fast and slow decay curve half-lives were calculated and are show, along with the measured time for the curve to reach 1/e. The curve fitting precision is represented by the adjusted R2 value. (b) Individual fluorescence intensity decay curves were fitted to two-term exponential functions for each sample. KillerRed photobleaching follows this two-term decay curve extremely well, comprising a fast and a slow decay component. The half-life was calculated from the fast term of each fitted curve, and averaged for each group. Individual points are plotted, with error bar designating the 95% confidence intervals. **p < 0.01, ****p < 0.0001.

References

    1. Cui W, Gusterson B, Clark AJ. Nitroreductase-mediated cell ablation is very rapid and mediated by a p53-independent apoptotic pathway. Gene Ther. 1999;6:764–770. doi: 10.1038/sj.gt.3300873. - DOI - PubMed
    1. Curado S, et al. Conditional targeted cell ablation in zebrafish: a new tool for regeneration studies. Dev. Dynam. 2007;236:1025–1035. doi: 10.1002/dvdy.21100. - DOI - PubMed
    1. Huang J, et al. A zebrafish model of conditional targeted podocyte ablation and regeneration. Kidney Int. 2013;83:1193–1200. doi: 10.1038/ki.2013.6. - DOI - PMC - PubMed
    1. Teh C, et al. Optogenetic in vivo cell manipulation in KillerRed-expressing zebrafish transgenics. BMC Dev. Biol. 2010;10:110. doi: 10.1186/1471-213X-10-110. - DOI - PMC - PubMed
    1. Bulina ME, et al. A genetically encoded photosensitizer. Nat. Biotechnol. 2006;24:95–99. doi: 10.1038/nbt1175. - DOI - PubMed

Publication types

Substances

LinkOut - more resources