. 2017:2017:1351945.
doi: 10.1155/2017/1351945. Epub 2017 Jun 18.

Modulatory Effect of Monochromatic Blue Light on Heat Stress Response in Commercial Broilers

Affiliations

Modulatory Effect of Monochromatic Blue Light on Heat Stress Response in Commercial Broilers

Safaa E Abdo et al. Oxid Med Cell Longev. 2017.

Abstract

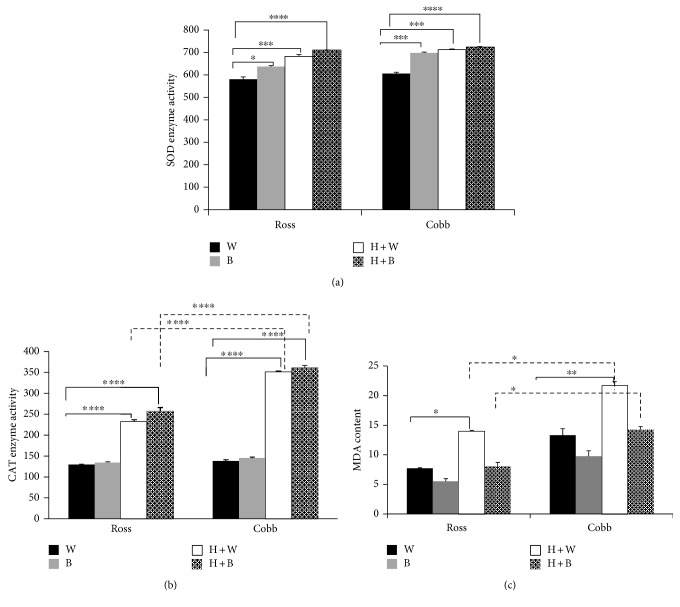
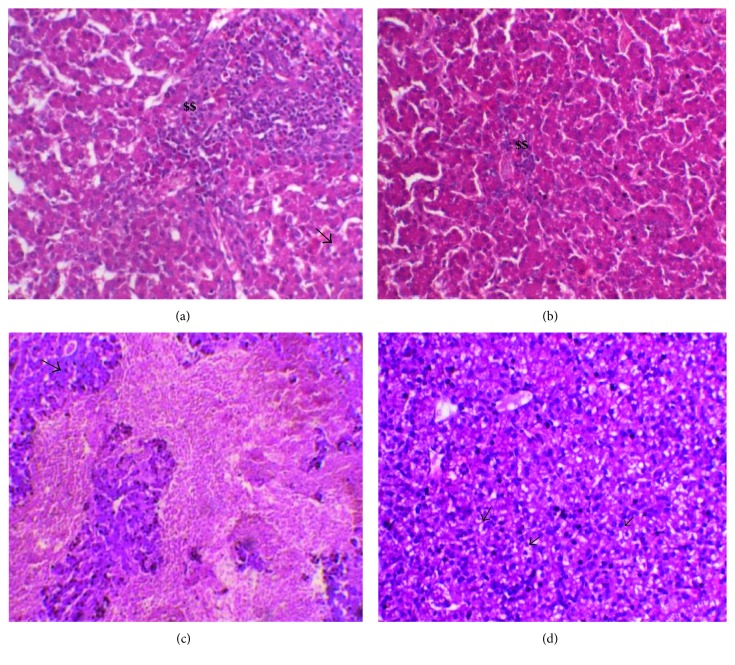
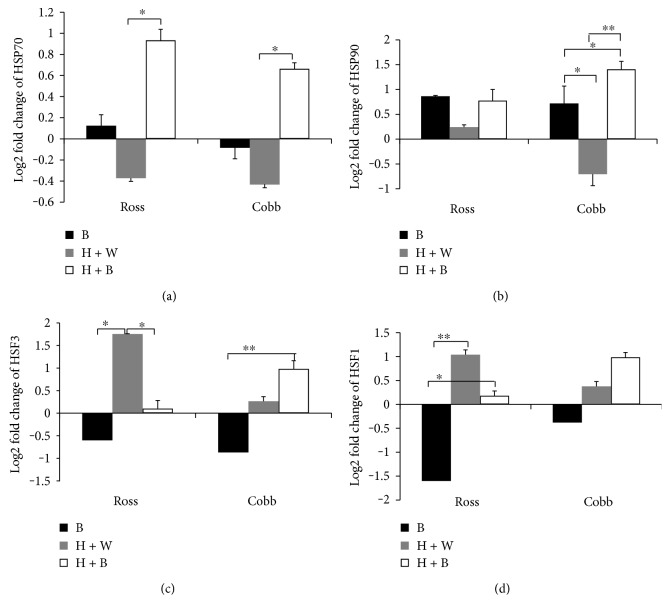
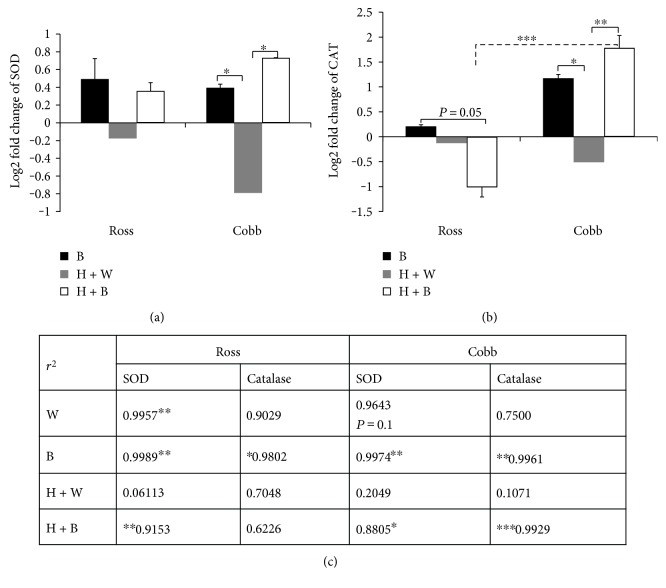
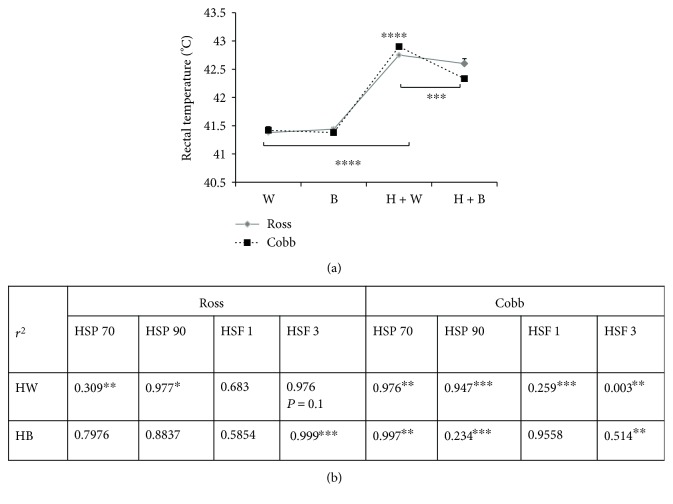
In a novel approach, monochromatic blue light was used to investigate its modulatory effect on heat stress biomarkers in two commercial broiler strains (Ross 308 and Cobb 500). At 21 days old, birds were divided into four groups including one group housed in white light, a second group exposed to blue light, a 3rd group exposed to white light + heat stress, and a 4th group exposed to blue light + heat stress. Heat treatment at 33°C lasted for five h for four successive days. Exposure to blue light during heat stress reduced MDA concentration and enhanced SOD and CAT enzyme activities as well as modulated their gene expression. Blue light also reduced the degenerative changes that occurred in the liver tissue as a result of heat stress. It regulated, though variably, liver HSP70, HSP90, HSF1, and HSF3 gene expression among Ross and Cobb chickens. Moreover, the Cobb strain showed better performance than Ross manifested by a significant reduction of rectal temperature in the case of H + B. Furthermore, a significant linear relationship was found between the lowered rectal temperature and the expression of all HSP genes. Generally, the performance of both strains by most assessed parameters under heat stress is improved when using blue light.


Figures

Figure 1
Figure 1
Blue light significantly increases antioxidant enzyme activities and lowers MDA concentration in the liver of two broiler strains (Ross 308 and Cobb 500). Chickens were reared in white light for 3 weeks and after that exposed to cyclic chronic heat stress with white and blue light (H + W and H + B), respectively. Liver samples were collected in sterile PBS for SOD and CAT as well as MDA measurement following the manufacture's protocol. (a) represents SOD enzyme activity. CAT enzyme activity and MDA cellular content were shown in (b) and (c), respectively. Mean ± SEM is shown. , ∗∗, and ∗∗∗ denote statistical significance (two-way ANOVA) with a p < 0.05, p < 0.01 and p < 0.001, respectively.
Figure 2
Figure 2
Hematoxylin and eosin staining of liver sections of Ross 308 and Cobb 500: (a) Ross exposed to white light during heat stress H + W and (b) Ross housed with blue light during heat stress H + B. (c, d) The same treatment in the case of Cobb, respectively. $$ refers to mononuclear cell infiltration. Arrows point the fatty changes.
Figure 3
Figure 3
Blue light significantly modulates liver HSP70, HSP90, HSF1, and HSF3 gene expression in the chicken liver. The relative gene expression levels of HSP70, HSP90, HSF3, and HSF1in the liver of Ross and Cobb exposed to blue light, heat stress in white light, and heat stress in blue light (B, H + W, and H + B, resp.) were measured. The gene expression levels were normalized against control (W) and against two housekeeping genes (β-actin and GAPDH). The expression levels were presented as log2 fold change and shown in the figure as mean ± SEM. , ∗∗, and ∗∗∗ denote statistical significance (two-way ANOVA) with a p < 0.05, p < 0.01, and p < 0.001, respectively.
Figure 4
Figure 4
Variations of SOD and CAT antioxidant enzyme activities could be predicted from their respective gene expression. The relative gene expression levels of antioxidant enzymes SOD and CAT in Ross and Cobb in the three groups, blue light (B), heat stressed with white light (H + W), and heat stressed with blue light (H + B) compared to the control group which kept at 24°C and white light. Two housekeeping genes (β-actin and GAPDH) were used to normalize the gene expression level. The expression levels were presented as log2 fold change and shown in the figure as mean ± SEM. , ∗∗, and ∗∗∗ in (a) and (b) denote statistical significance (two-way ANOVA) with a p < 0.05, p < 0.01, and p < 0.001, respectively. (c) represents regression analysis of the association between antioxidant enzyme activities and their gene expressions. The analysis was performed at 90% confidence level. The r2 values are shown. , ∗∗, and ∗∗∗ denote statistical significance at p < 0.1, p < 0.05, and p < 0.01, respectively.
Figure 5
Figure 5
Blue light significantly regulates bird's temperature during heat stress which could be associated with change in heat shock biomarker genes. (a) represents mean ± SEM of the bird's temperature in the case of W, B, H + W, and H + B. , ∗∗, and ∗∗∗ denote statistical significance (two-way ANOVA) with a p < 0.05, p < 0.01, and p < 0.001, respectively. (b) represents regression analysis of the association between the gene expression level (fold change) of heat shock protein and heat shock factor HSP70, HSP90, HSF3, and HSF1, respectively, and bird's temperature. Analysis was performed at 90% confidence level. The r2 values are shown. , ∗∗, and ∗∗∗ denote statistical significance at p < 0.1, p < 0.05, and p < 0.01, respectively.

References

    1. Allen C. D., Macalady A. K., Chenchouni H., et al. A global overview of drought and heat-induced tree mortality reveals emerging climate change risks for forests. Forest Ecology and Management. 2010;259(4):660–684. - PubMed
    1. Akbarian A., Michiels J., Degroote J., Majdeddin M., Golian A., De Smet S. Association between heat stress and oxidative stress in poultry; mitochondrial dysfunction and dietary interventions with phytochemicals. Journal of Animal Science and Biotechnology. 2016;7(37):1–14. doi: 10.1007/s13197-016-2361-2. - DOI - PMC - PubMed
    1. Halliwell B., Whiteman M. Measuring reactive species and oxidative damage in vivo and in cell culture: how should you do it and what do the results mean? British Poultry Science. 2004;142(2):231–255. doi: 10.1038/sj.bjp.0705776. - DOI - PMC - PubMed
    1. Feng J., Zhang M., Zheng S., Xie P., Ma A. Effects of high temperature on multiple parameters of broilers in vitro and in vivo. Poultry Science. 2008;87(10):2133–2139. doi: 10.3382/ps.2007-00358. - DOI - PubMed
    1. Estévez M. Oxidative damage to poultry: from farm to fork. Poultry Science. 2015;94(6):1368–1378. doi: 10.3382/ps/pev094. - DOI - PubMed

Substances