. 2017 Oct;16(5):1043-1050.
doi: 10.1111/acel.12632. Epub 2017 Jul 11.

Analysis of individual cells identifies cell-to-cell variability following induction of cellular senescence

Affiliations

Analysis of individual cells identifies cell-to-cell variability following induction of cellular senescence

Christopher D Wiley et al. Aging Cell. 2017 Oct.

Abstract

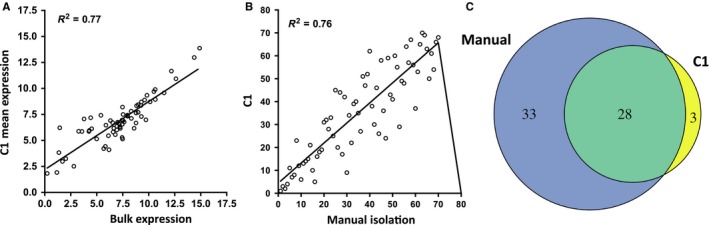
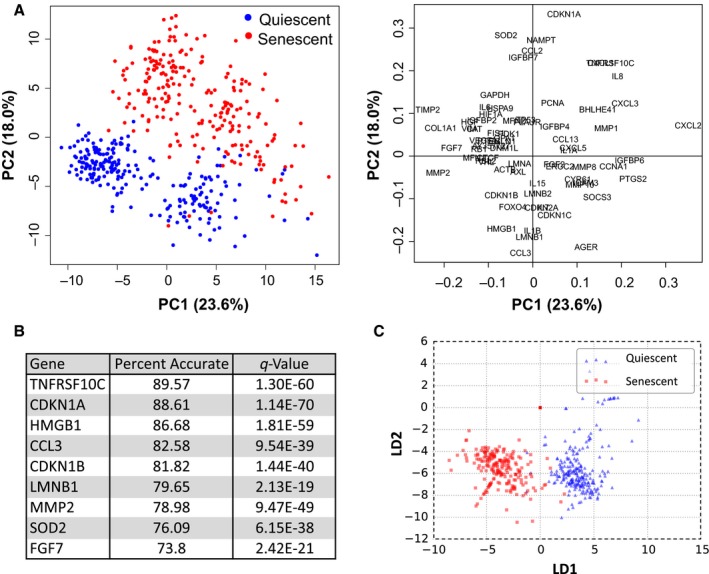
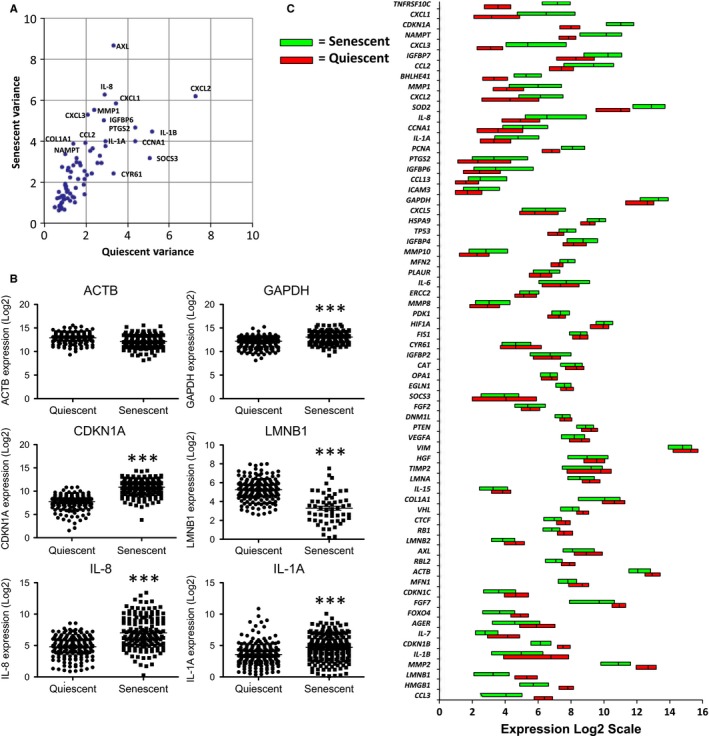
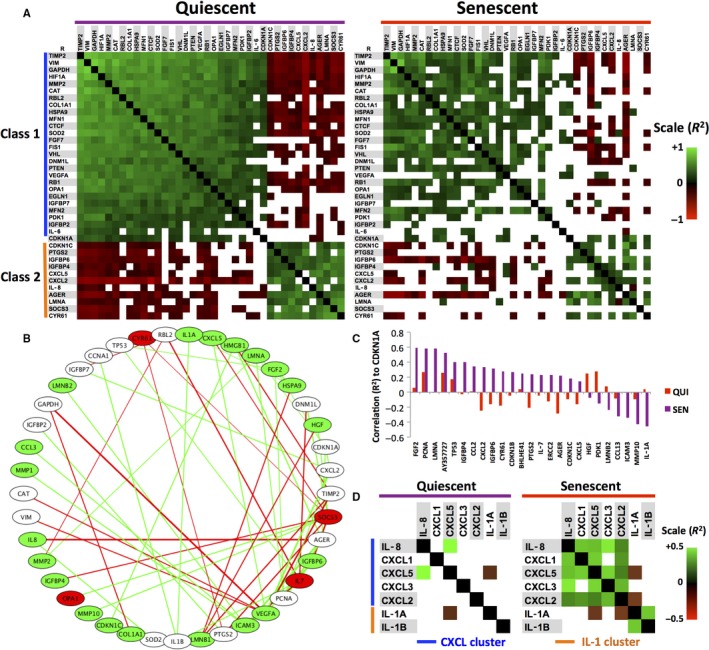
Senescent cells play important roles in both physiological and pathological processes, including cancer and aging. In all cases, however, senescent cells comprise only a small fraction of tissues. Senescent phenotypes have been studied largely in relatively homogeneous populations of cultured cells. In vivo, senescent cells are generally identified by a small number of markers, but whether and how these markers vary among individual cells is unknown. We therefore utilized a combination of single-cell isolation and a nanofluidic PCR platform to determine the contributions of individual cells to the overall gene expression profile of senescent human fibroblast populations. Individual senescent cells were surprisingly heterogeneous in their gene expression signatures. This cell-to-cell variability resulted in a loss of correlation among the expression of several senescence-associated genes. Many genes encoding senescence-associated secretory phenotype (SASP) factors, a major contributor to the effects of senescent cells in vivo, showed marked variability with a subset of highly induced genes accounting for the increases observed at the population level. Inflammatory genes in clustered genomic loci showed a greater correlation with senescence compared to nonclustered loci, suggesting that these genes are coregulated by genomic location. Together, these data offer new insights into how genes are regulated in senescent cells and suggest that single markers are inadequate to identify senescent cells in vivo.

Keywords: aging; cellular senescence; cytokines; single cell; transcriptomics.


Figures

Figure 1
Figure 1
Comparison of normalized mRNA levels in C1 and manually isolated (MI) cells. (A) Mean values of C1 (single‐cell auto prep system) gene expression (Log2) compared to bulk populations for all 71 genes analyzed in senescent cells. Each point is a single gene. (B) Rank‐order analysis for all 71 genes for either C1 (y‐axis) or MI (x‐axis) method. (C) Venn diagram showing number of genes significantly changed in senescent cells relative to quiescent cells by C1 or MI methods.
Figure 2
Figure 2
Gene expression signatures that identify senescent cells. (A) Principal component analysis of gene expression data. Plot of all quiescent (blue) and senescent (red) cells using 70 genes (left panel). Variables factor map shows genes used and their contributions to PC1 and PC2 (right panel). (B) Table listing the strongest predictors of senescent cells calculated by linear discriminant analyses (LDA). (C) LDA plot using five genes (CDKN1A, CDKN1B, LMNB1, TNFRS10C, and CCL3) for quiescent (blue) and senescent (red) cells.
Figure 3
Figure 3
Increased gene expression variability in senescent cells. (A) Plot of coefficients of variation of senescent (y‐axis) vs. quiescent (x‐axis) cells for each gene analyzed. Noteworthy genes are labeled in the figure. (B) Expression plots of each cell analyzed for control genes (ACTB and GAPDH), a p53‐inducible senescence gene (CDKN1A), a p53‐repressed senescence gene (LMNB1), and two SASP genes (IL‐8 and CXCL3). *** = < 0.0001 (C) Box plots showing the first quartile, median, and third quartile of the expression level for each gene analyzed in senescent (green) and quiescent (red) cells.
Figure 4
Figure 4
Gene expression correlations in quiescent and senescent cells. (A) Heat maps of Pearson's coefficients (R2) between clusters of coexpressed genes in quiescent (left panel) and senescent (right panel) cells. Green indicates positive correlations, red indicates negative correlations, and empty cells indicate nonsignificant (> 0.01) correlations. Two classes of directly (green) and indirectly (red) correlated expression patterns (labeled Class 1 and Class 2) appear across multiple genes. (B) Circular node network indicating changes in correlations between quiescent and senescent cells. Number of altered correlations increases from left to right. Green nodes indicate genes with increased variability in senescent cells, while red nodes indicate decreased variability; white nodes indicate no change. Connecting lines indicate whether correlations increase (green) or decrease (red) between genes. (C) Correlation (R2) levels of multiple genes relative to CDKN1A. Violet bars indicate quiescent cells, whereas red bars indicate senescent cells. (D) Heat map of correlations (R2) between genes in the CXCL (blue) and IL‐1 (orange) clusters in quiescent (left) and senescent (right) cells, as in A.

Similar articles

Cited by

References

    1. Aird KM, Iwasaki O, Kossenkov AV, Tanizawa H, Fatkhutdinov N, Bitler BG, Le L, Alicea G, Yang TL, Johnson FB, Noma KI, Zhang R (2016) HMGB2 orchestrates the chromatin landscape of senescence‐associated secretory phenotype gene loci. J. Cell Biol. 215, 325–334. - PMC - PubMed
    1. Bahar R, Hartmann CH, Rodriguez KA, Denny AD, Busuttil RA, Dolle ME, Calder RB, Chisholm GB, Pollock BH, Klein CA, Vijg J (2006) Increased cell‐to‐cell variation in gene expression in ageing mouse heart. Nature 441, 1011–1014. - PubMed
    1. Baker DJ, Childs BG, Durik M, Wijers ME, Sieben CJ, Zhong J, Saltness RA, Jeganathan KB, Verzosa GC, Pezeshki A, Khazaie K, Miller JD, van Deursen JM (2016) Naturally occurring p16(Ink4a)‐positive cells shorten healthy lifespan. Nature 530, 184–189. - PMC - PubMed
    1. Beausejour CM, Krtolica A, Galimi F, Narita M, Lowe SW, Yaswen P, Campisi J (2003) Reversal of human cellular senescence: roles of the p53 and p16 pathways. EMBO J. 22, 4212–4222. - PMC - PubMed
    1. Campisi J (2013) Aging, cellular senescence, and cancer. Annu. Rev. Physiol. 75, 685–705. - PMC - PubMed

Publication types

MeSH terms