. 2017 Jul 12:8:16040.
doi: 10.1038/ncomms16040.

BCAT1 controls metabolic reprogramming in activated human macrophages and is associated with inflammatory diseases

Affiliations

BCAT1 controls metabolic reprogramming in activated human macrophages and is associated with inflammatory diseases

Adonia E Papathanassiu et al. Nat Commun. .

Abstract

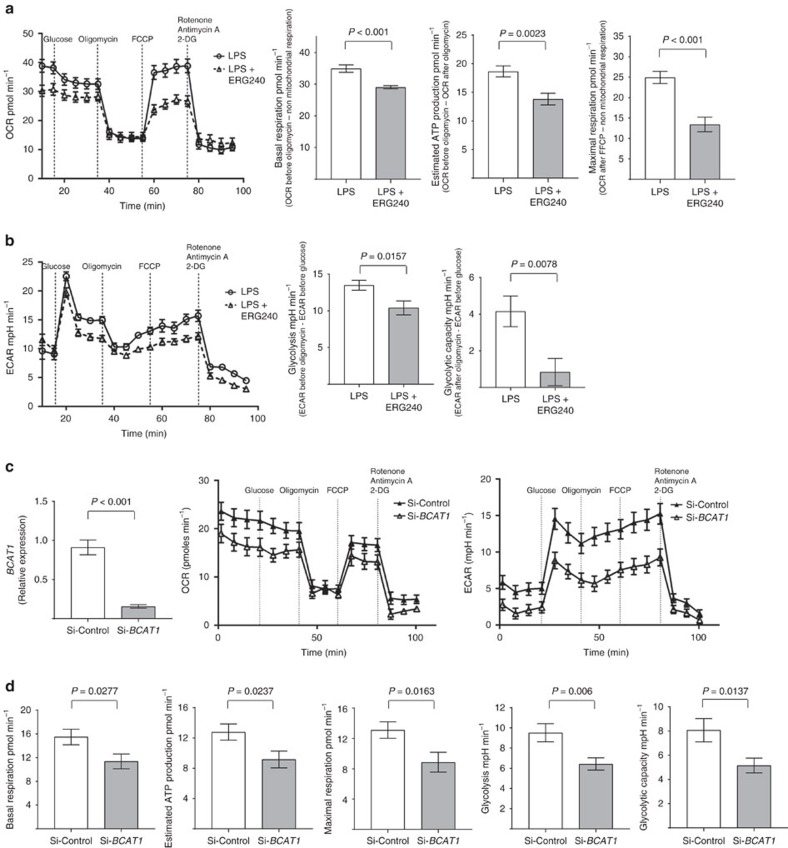
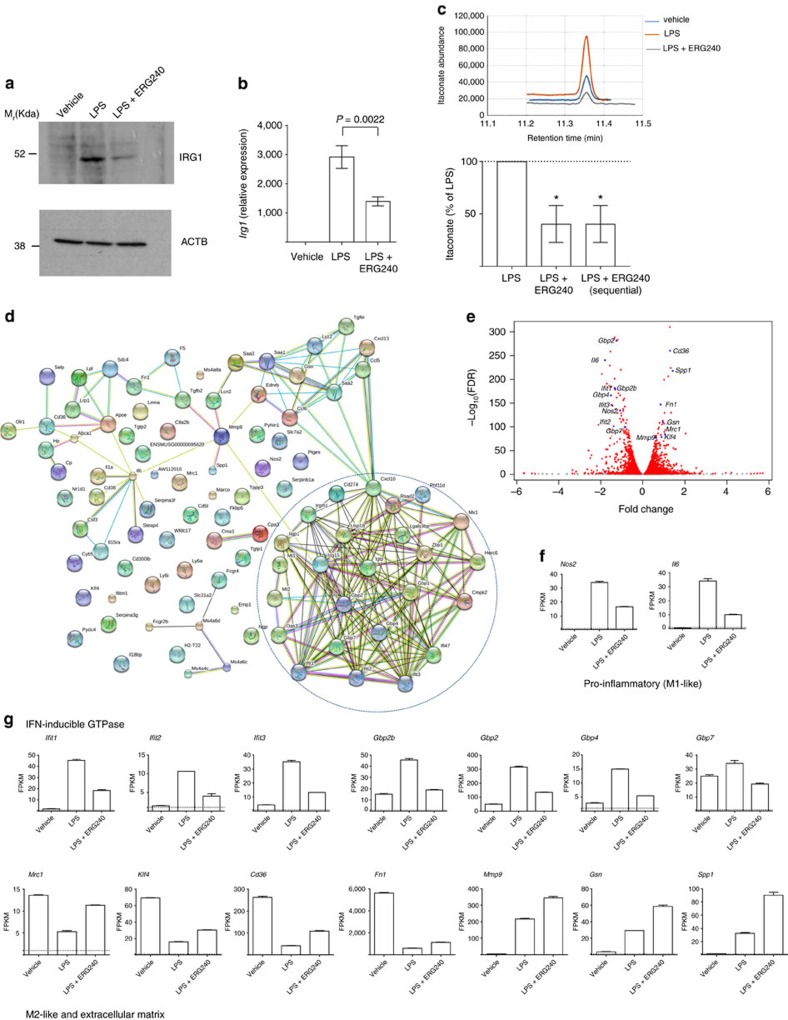
Branched-chain aminotransferases (BCAT) are enzymes that initiate the catabolism of branched-chain amino acids (BCAA), such as leucine, thereby providing macromolecule precursors; however, the function of BCATs in macrophages is unknown. Here we show that BCAT1 is the predominant BCAT isoform in human primary macrophages. We identify ERG240 as a leucine analogue that blocks BCAT1 activity. Selective inhibition of BCAT1 activity results in decreased oxygen consumption and glycolysis. This decrease is associated with reduced IRG1 levels and itaconate synthesis, suggesting involvement of BCAA catabolism through the IRG1/itaconate axis within the tricarboxylic acid cycle in activated macrophages. ERG240 suppresses production of IRG1 and itaconate in mice and contributes to a less proinflammatory transcriptome signature. Oral administration of ERG240 reduces the severity of collagen-induced arthritis in mice and crescentic glomerulonephritis in rats, in part by decreasing macrophage infiltration. These results establish a regulatory role for BCAT1 in macrophage function with therapeutic implications for inflammatory conditions.


Conflict of interest statement

A.E.P. is an employee of Ergon Pharmaceuticals Ltd. The remaining authors declare no competing financial interests.

Figures

Figure 1
Figure 1. BCAT1 expression and inhibition in human macrophages.
(a) RNA-sequencing in human monocyte-derived macrophages (hMDMs) shows mRNA copies of BCAT enzymes in normalized counts. n=14 healthy donor hMDMs were used for RNA-seq. (b) Chemical structure of ERG240 and leucine. (c) Enzymatic activity of recombinant human BCAT1 and BCAT2 in presence of ERG240. (d) Relative expression of IRG1, HIF1A and IL1B measured by qRT-PCR in control, ERG240-treated (20 mM, 3 h), LPS treated (100 ng ml−1, 3 h), and LPS+ERG240 treated (LPS, 100 ng ml−1; ERG240, 20 mM for 3 h) hMDMs. ns, non-significant. All expression values are normalized to those obtained for HPRT gene expression. n=3 healthy donor hMDMs were used in each group. (e) Western blot analysis of IRG1, IL-1β, HIF-1α and beta-actin (ACTB) in control (untreated), ERG240-treated (20 mM, 3 h), LPS treated (100 ng ml−1, 3 h) and LPS+ERG240 treated (LPS, 100 ng ml−1; ERG240, 20 mM for 3 h) hMDMs. The experiment is representative of three independent experiments using n=3 healthy donor hMDMs each. (f) GC/MS results showing itaconic acid production in hMDMs in presence or absence of ERG240 (20 mM). LPS treatment was for 8 h (100 ng ml−1). GC/MS plot for each donor is shown separately where itaconate abundance denotes arbitrary units. Error bars are s.e.m. Significance was tested using two-tailed Student’s t-test or one-way ANOVA. * P<10−3 following two-way ANOVA.
Figure 2
Figure 2. BCAT1 inhibition reduces oxygen consumption and glycolysis in human macrophages.
(a) Real-time extracellular OCR measurements in hMDMs (left panel) that were previously treated with either LPS (100 ng ml−1) or LPS+ERG240 (20 mM) for 3 h. OCR values were recorded following sequential treatments with glucose (5 mM), oligomycin A (0.5 μM), carbonyl cyanide 4-(trifluoromethoxy) phenyl- hydrazine (FCCP, 1 μM) and a combination of 2-deoxy-D-glucose (2-DG, 50 mM), antimycin A (1 μM) and rotenone (1 μM). Basal respiration, estimated ATP production, and maximal respiration are shown in the right panel. n=3 healthy donor hMDMs were used in 12 technical replicates. The results are representative of three independent experiments. (b) Real-time ECAR (left panel), glycolysis and glycolytic capacity (right panel). n=3 healthy donor hMDMs were used in 12 technical replicates. The results are representative of three independent experiments. (c) hMDMs were subjected to BCAT1 siRNA (si-BCAT1) or non-targeting siRNA (Si-Control) treatment, followed by LPS stimulation (3 h, 100 ng ml−1) before measuring BCAT1 expression levels (left panel), OCR (middle panel) and ECAR (right panel). (d) Basal respiration, estimated ATP production, maximal respiration, glycolysis and glycolytic capacity in si-Control and si-BCAT1 transfected, LPS-treated hMDMs. n=4 hMDMs were used in at least five technical replicates. Error bars are s.e.m. Significance was tested using two-tailed Student’s t-test.
Figure 3
Figure 3. BCAT1 silencing leads to reduced IRG1 and itaconate levels in activated human macrophages.
(a) Western Blot following BCAT1 (Si-BCAT1) and non-targeting (Si-Control) siRNA treatment in hMDMs stimulated with LPS (100 ng ml−1, 8 h). BCAT1, IRG1, TUBB and ACTB blots are shown on three independent donor hMDMs. (b) BCAT1 and IRG1 Western Blot on Si-BCAT1 and Si-Control hMDMs from donor four and corresponding itaconate levels measured by GC/MS are shown in the right panel. Itaconate levels measured by GC/MS were further confirmed in si-BCAT1 and si-Control hMDMs from independent donors (n=4, lower panel). Error bars are s.e.m. Significance was tested using one sample t-test (two-tailed). *P<0.05 by one-sample-t-test.
Figure 4
Figure 4. Bcat1 inhibition blocks itaconate production in vivo and polarizes peritoneal macrophages.
Mouse peritoneal macrophages from vehicle (saline), LPS-injected (1.5 mg kg−1) or LPS+ERG240 (500 mg kg−1)–injected mice were isolated and pooled 24 h following i.p. injection (n=6 mice per group). Irg1 protein (a), mRNA (b) levels, as well as itaconate measurements by GC/MS (c) are shown. The lower panel (c) shows itaconate levels in peritoneal macrophages isolated from mice injected either with LPS or LPS +ERG240 or a sequential treatment where LPS was first injected for 3 h, followed by ERG240 (LPS+ERG240 (sequential)). Peritoneal macrophages were collected 24 h following the LPS injection. n=3 mice/group. (d) Protein–protein interaction (PPI) network in 100 top (97 annotated) differentially expressed genes between LPS and LPS+ERG240 treated mouse peritoneal macrophages illustrated by STRING (high confidence score=0.7). The IFN-inducible GTPase cluster is shown within a dashed circle. (e) Distribution of the fold changes and the FDR-adjusted P values (−log10 (FDR)) for the comparison between LPS and LPS+ERG240 treated macrophages. The IFN- inducible GTPase genes, M1-like, M2-like and extracellular matrix transcripts are shown in blue. (f) Fragments per kilobase of transcript per Million mapped reads (FPKM) values for Nos2, Il6 are shown in vehicle, LPS and LPS+ERG240-treated peritoneal macrophages. (g) FPKM values for Ifit1, Ifit2, Ifit3, Gbp1, Gbp2, Gbp4, Gbp7, Mrc1, Klf4, Cd36, Fn1, Mmp9, Gsn and Spp1. FPKM=1 is shown as a dashed line to denote minimal expression levels. All transcripts analysed by RNA-seq (f,g) show significant FPKM upon ERG240 treatment when compared to LPS group (FDR<10−73). Error bars are s.e.m. Significance was tested using one-way ANOVA. *P<0.05 by ANOVA.
Figure 5
Figure 5. Orally administrated ERG240 reduced the severity of crescentic glomerulonephritis in rats and CIA in mice.
(a) Glomerular crescents, serum creatinine, and proteinuria levels measured in vehicle and ERG240 treated rats at day 10 following induction of nephrotoxic nephritis. At least n=4 rats were used in each group. (b) Col1a1 immunofluorescence (IF) quantification (left panel), representative IF and Sirius red staining images (middle panel) and Col1a1 qRT-PCR (normalized to Hprt) 28 days following NTS injection. Original magnification, × 20, at least n=4 animals were used in each group. (c) Clinical progression of CIA measured by the Mean Arthritis Index in vehicle and ERG240-treated animals in both studies (prophylactic and therapeutic, upper panel; at least n=6 animals per group). Histological analysis of joints from representative whole paws scored for inflammation, pannus formation, cartilage damage and bone resorption (lower panel). Error bars are s.e.m. Either Mann–Whitney or Student’s t-test were used for significance. *** P<0.001, ** P<0.01, * P<0.05. Scale bars, 50 μm.
Figure 6
Figure 6. ERG240 treatment results in reduced macrophage infiltration in CIA and crescentic glomerulonephritis.
(a) Inhibition of murine BMDM migration in vitro in the presence of different concentrations of ERG240 by transwell migration assay (left panel, results are presented as the average of four experiments). The drug had no effect on cell viability (right panel, results are presented as the average of three experiments). (b) IHC analysis of CIA joints for expression of F4/80. Representative images show F4/80+ cells (indicated with an arrow). F4/80+ cell quantification is shown on the right panel. (c) Representative images showing glomerular ED1 (rat CD68)-positive cells in ERG240 treated animals following NTN. Percentage of glomerular ED1-positive cell quantification is shown on the right panel. Error bars are s.e.m. Either one-way ANOVA or Student’s t-test were used for significance. *P<0.001; ns, non-significant when compared with 0 mM ERG240 by one-way ANOVA. Scale bars, 50 μm (collagen-induced arthritis); 20 μm (crescentic glomerulonephritis).

References

    1. Brosnan J. T. & Brosnan M. E. Branched-chain amino acids: enzyme and substrate regulation. J. Nutr. 136, 207S–211S (2006). - PubMed
    1. Tom A. & Nair K. S. Assessment of branched-chain amino Acid status and potential for biomarkers. J. Nutr. 136, 324S–330S (2006). - PubMed
    1. Hutson S. M., Lieth E. & LaNoue K. F. Function of leucine in excitatory neurotransmitter metabolism in the central nervous system. J. Nutr. 131, 846S–850S (2001). - PubMed
    1. Sweatt A. J. et al.. Branched-chain amino acid catabolism: unique segregation of pathway enzymes in organ systems and peripheral nerves. Am. J. Physiol. Endocrinol. Metab. 286, E64–E76 (2004). - PubMed
    1. Tonjes M. et al.. BCAT1 promotes cell proliferation through amino acid catabolism in gliomas carrying wild-type IDH1. Nat. Med. 19, 901–908 (2013). - PMC - PubMed

Publication types

MeSH terms