. 2017 Jul 20;547(7663):345-349.
doi: 10.1038/nature23017. Epub 2017 Jul 12.

CRISPR-Cas encoding of a digital movie into the genomes of a population of living bacteria

Affiliations

CRISPR-Cas encoding of a digital movie into the genomes of a population of living bacteria

Seth L Shipman et al. Nature. .

Abstract

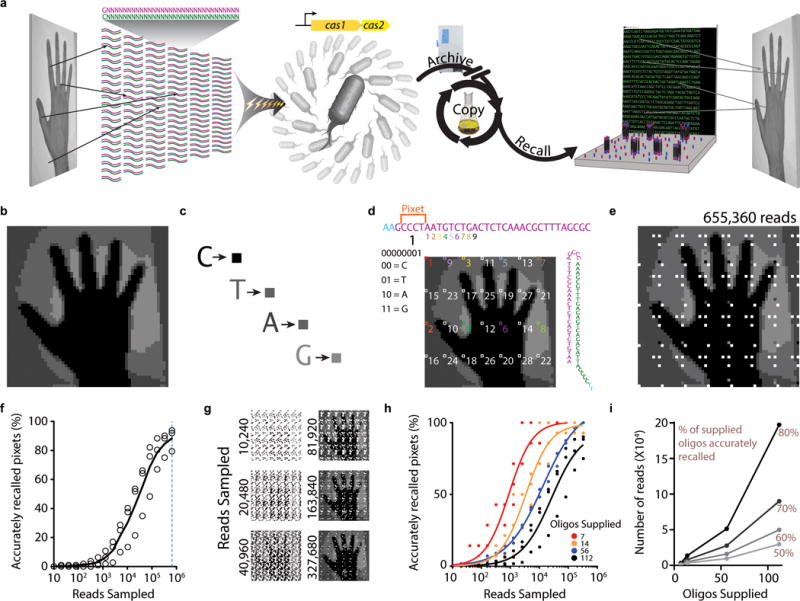
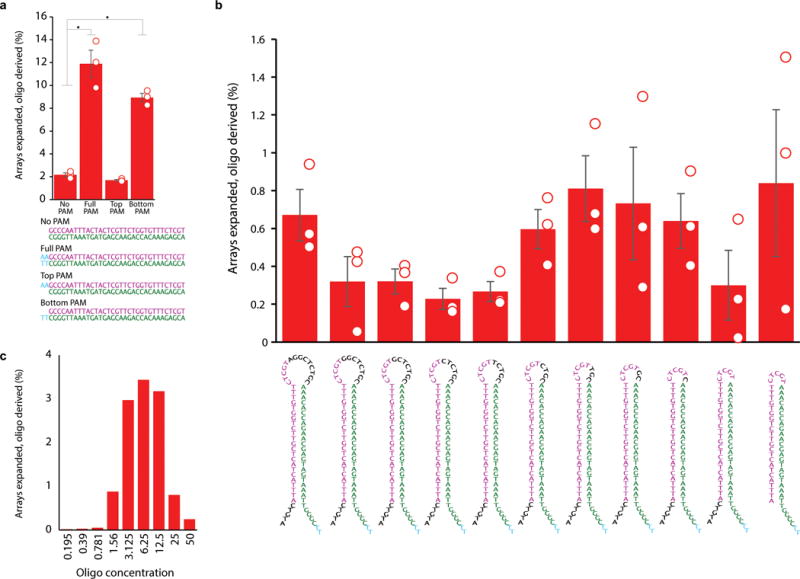
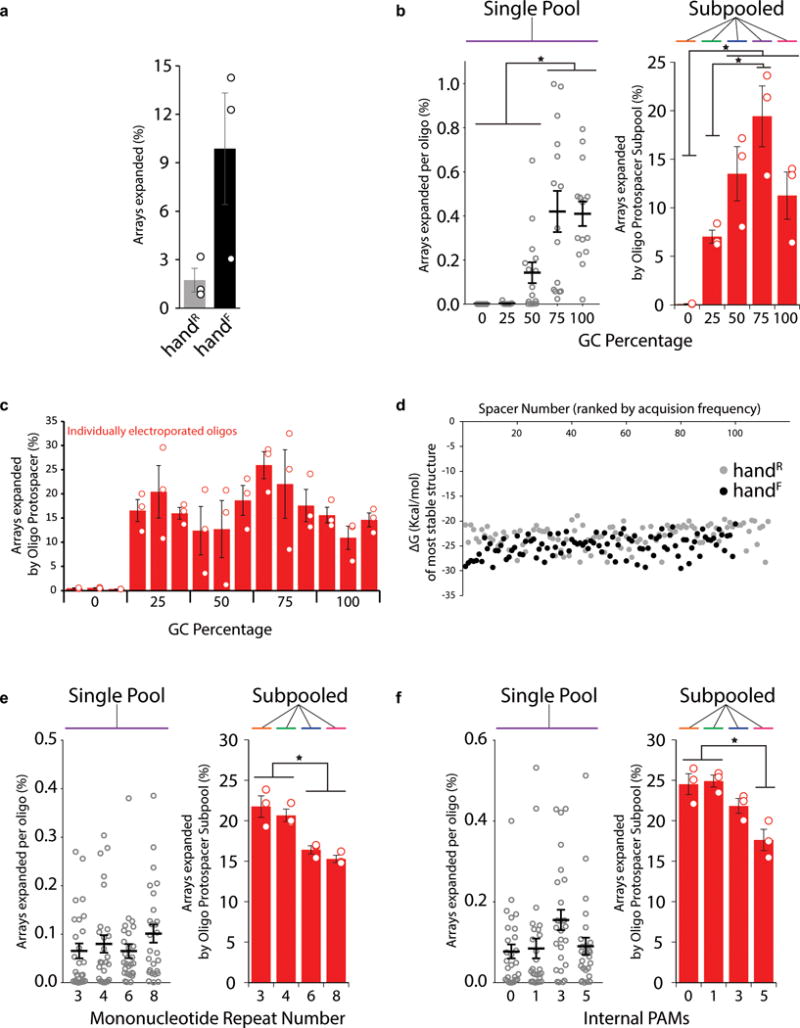
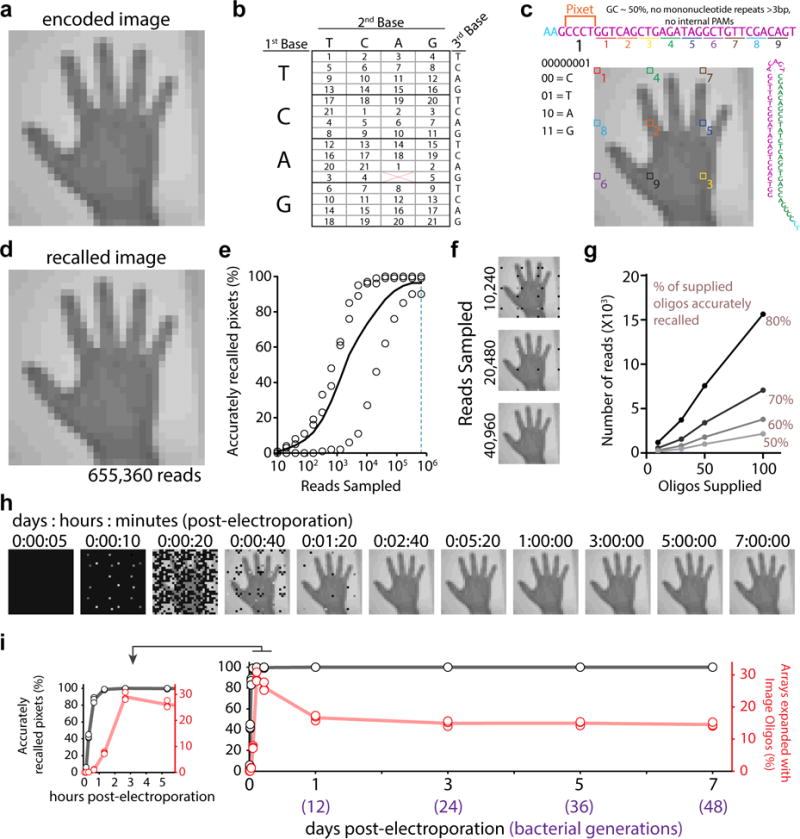
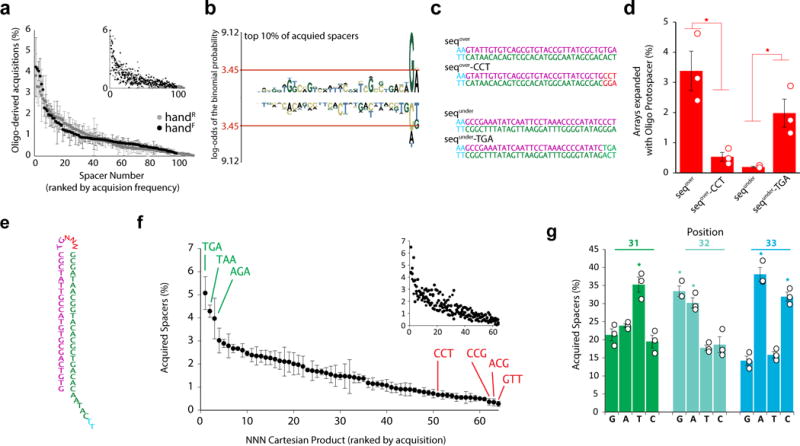
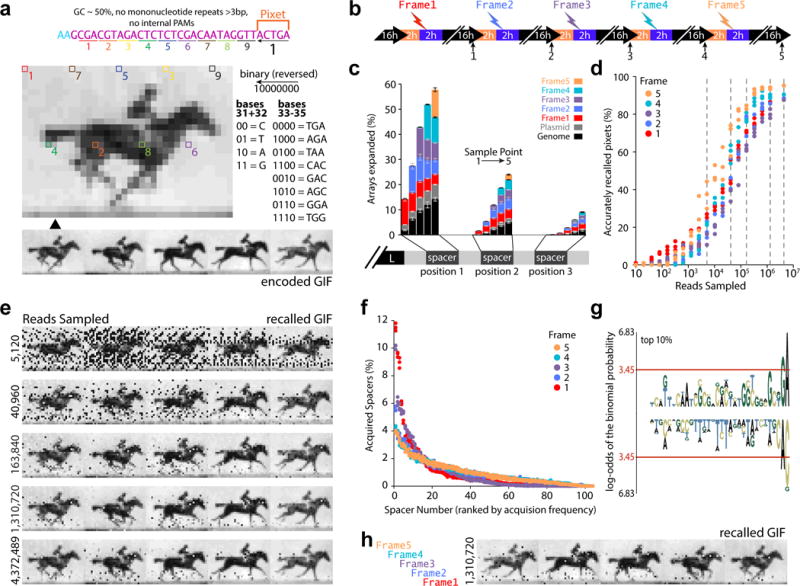
DNA is an excellent medium for archiving data. Recent efforts have illustrated the potential for information storage in DNA using synthesized oligonucleotides assembled in vitro. A relatively unexplored avenue of information storage in DNA is the ability to write information into the genome of a living cell by the addition of nucleotides over time. Using the Cas1-Cas2 integrase, the CRISPR-Cas microbial immune system stores the nucleotide content of invading viruses to confer adaptive immunity. When harnessed, this system has the potential to write arbitrary information into the genome. Here we use the CRISPR-Cas system to encode the pixel values of black and white images and a short movie into the genomes of a population of living bacteria. In doing so, we push the technical limits of this information storage system and optimize strategies to minimize those limitations. We also uncover underlying principles of the CRISPR-Cas adaptation system, including sequence determinants of spacer acquisition that are relevant for understanding both the basic biology of bacterial adaptation and its technological applications. This work demonstrates that this system can capture and stably store practical amounts of real data within the genomes of populations of living cells.


Conflict of interest statement

Competing Financial Interests

S.L.S. J.N, J.D.M., and G.M.C. are inventors on a provisional patent (62/296,812) filed by the President and Fellows of Harvard College that covers the work in this manuscript. A complete accounting of the financial interests of G.M.C. is listed at: http://arep.med.harvard.edu/gmc/tech.html.

Figures

Extended Data Figure 1
Recording images into the genome. a. Pixel values are encoded across many protospacers, which are electroporated into a population of bacteria that overexpress Cas1+2 to store the image data. These bacteria can be archived, propagated, and eventually sequenced to recall the image. b. Initial image to be encoded. c. Nucleotide-to-color encoding scheme. d. Example of the encoding scheme. Sequence at top shows the protospacer linear view with pixet code (specifying a pixel set) followed by pixel values, which are distributed across the image. Pixet number is shown under the pixet nucleotides, with the binary converted pixet and binary-to-nucleotide conversion reference below that. Small numbers (in color) below the protospacer indicate individual pixels, identified by boxes on the image. Protospacer in minimal hairpin format for electroporation is shown on the right. e. Results of one replicate at a depth of 655,360 reads. White is shown if no information was recovered about the pixel value (due to a pixet protospacer not being recovered after sequencing). f. Percentage of accurately recalled pixets as a function of read depth. Unfilled circles indicate points derived from individual replicates. The black line is an average of three replicates. g. Examples of the images that result from down-sampling the sequencing reads. h. Effect of supplying fewer oligos on recall accuracy as a function of reads sampled when smaller pools of oligos are supplied and recalled. i. Number of reads required to reach 50, 60, 70, and 80% accuracy on a given oligo set as a function of oligos supplied. Additional statistical details in Supplementary Table 2.
Extended Data Figure 2
Testing a minimal hairpin protospacer. a. Percent of arrays expanded with oligo-supplied spacers following electroporation of the sequences indicated below, aimed at testing PAM inclusion on both the top and bottom strands. Unfilled circles indicate individual biological replicates, bars are mean ±SEM. * indicates p<0.05. Oligos supplied at 3.125 μM each. b. Percent of arrays expanded with oligo-supplied spacers following electroporation of the sequences indicated to the left, right, and below aimed at finding a minimal functional hairpin protospacer. Unfilled circles indicate individual biological replicates, bars are mean ±SEM. Oligos supplied at 3.125 μM. c. Percent of arrays expanded following electroporation of different concentrations of the minimal hairpin oligo protospacer. Additional statistical details in Supplementary Table 2.
Extended Data Figure 3
Cell surviving electroporation. Colony forming units per milliliter of starting culture prior to beginning electroporation, after pre-electroporation washes, immediately post-electroporation, and after 1 hour of recovery. Cells in red were electroporated with a minimal hairpin oligo, those in blue were electroporated in water alone. Unfilled circles represent individual biological replicates (n=3), filled circles are mean ± SEM.
Extended Data Figure 4
Optimization of protospacer sequence parameters. a. Comparison of the percentage of arrays that were expanded after encoding handR and handF images. b. Percentage of arrays expanded per oligo (single pool) or per subpool (subpooled) across a range of GC percentages. Unfilled black circles to the left represent individual oligo protospacer sequences (three biological replicates each), while black line shows mean ± SEM. Unfilled red circles to the right represent individual biological replicates. Bars are mean ± SEM. * indicates p<0.05. c. Percentage of arrays expanded per oligo electroporated individually across a range of GC percentages. Unfilled red circles are individual biological replicates. Bars show mean ± SEM. d. Gibbs free energy of minimal hairpin protospacers structures for each of the images, with protospacers ranked by overall acquisition frequency. e. Percentage of arrays expanded per oligo (single pool) or per subpool (subpooled) with different numbers of mononucleotide repeats. Panel attributes as in b. f. Percentage of arrays expanded per oligo (single pool) or per subpool (subpooled) with different numbers of internal PAMs. Panel attributes as in b. Additional statistical details in Supplementary Table 2.
Extended Data Figure 5
Effect of the 3’ motif on protospacer acquisition when supplied as two complementary oligos. Individual sequences designed to directly test the motif identified in Figure 2b shown to the left. To the right, percent of arrays expanded following electroporation of the sequences indicated as two complementary oligos (in dark red), rather than a minimal oligo hairpin (shown for comparison in pink). Unfilled circles indicate individual biological replicates. Bars show mean ± SEM. * indicates p<0.05. Additional statistical details in Supplementary Table 2.
Extended Data Figure 6
Recall of frame order over time based on position in the CRISPR array. a. Initial set of rules to test the order of spacers within a pixet. Every time two spacers from the same pixet are found in a single array, their relative physical location (with respect to the leader) is extracted. As is the location of each spacer relative to spacers drawn from the genome or plasmid (G/P). The actual sequence of electroporated protospacers should occupy arrays in a predictable physical arrangement, as described by these ordering rules. Every possible permutation of spacers within a pixet is tested against each of these rules and, if a permutation satisfies all the rules, spacers are assigned to frame. b. Second set of tests to compare between pixets. If no permutation satisfies all of the tests in a, spacers are compared to previously assigned spacers from other pixets pairwise when found in the same array. A larger set of rules will hold true for the actual sequence of electroporated protospacers when compared against previously assigned spacers. Again, all possible order permutations are tested, and order is assigned based on the best overall satisfaction of these ordering rules.
Extended Data Figure 7
Quantification of errors by source. Includes any instance of a called spacer that does not match the supplied protospacer.
Extended Data Figure 8
Methods of image encoding for error-correction. a-d. Method used in Figure 1. a. Triplet code to flexibly specify 21 colors. b. Example of a pixet to be encoded into nucleotide space with pixel values marked. c. Rules specifying how the protospacer will be built. d. Example of the build of the protospacer. The AAG introduced by the addition of pixel 4 is unacceptable and invokes the flexible switch to another triplet. In a test of the extendibility of this encoding scheme, we ran three random sets of 100 million different nine-color orderings through the sequence build and found that 99.86 ± 0.07 % of color orders were able to satisfy the requirements we set out without optimization by hand. e-i. Method of alternating clusters for error correction. e. Triplet assignment to clusters A, B, and X. f. Example of a pixet to be encoded into nucleotide space with pixel values marked. g. Rules for adding new triplets in this scheme. h. Example of the build of the protospacer. The AAG introduced by the addition of pixel 4 is unacceptable and invokes the flexible switch to cluster X. i. Example of an error signal. j-l. Method of checksum error correction. j. Annotation of protospacer with the addition of a checksum. k. Annotation of the checksum itself. l. Full protospacer with checksum implemented.
Figure 1
Figure 1
An image into the genome. a. handF image. b. Encoding for 21 colors. c. Sequence at top shows the linear protospacer with pixet code followed by pixel values (distributed across image). Pixet shown under nucleotides, with binary-to-nucleotide conversion. Small colorful numbers below protospacer indicate individual pixels boxed on the image. Minimal hairpin protospacer shown on the right. d. One replicate at 655,360 reads. Black shown if no pixel information recovered. e. Accurately recalled pixets by read depth. Unfilled circles indicate points from individual replicates, black line shows the mean. f. Result of down-sampling the sequencing reads. g. Reads required to reach 50, 60, 70, and 80% accuracy on a given oligo set as a function of number of oligos supplied. h. Image recall at time-points after electroporation. i. Quantification of the percentage of accurately recalled pixets (in black) and percentage of arrays with oligo-derived spacers (in red) by time-point. Unfilled circles represent individual replicates, lines show the mean. Inset graph (left) expands first six hours. Statistical details in Supplementary Table 1.
Figure 2
Figure 2
Sequence determinants of acquisition. a. Acquisition frequency for individual protospacers (of oligo-derived acquisitions) for both images, ranked by frequency. Main plot circles represent mean ± SEM. Smaller inset shows each replicate (n=3). b. pLogo of the top 10% of protospacers (all protospacers as background). Red line indicates p<0.05. Over-representation is positive, under-representation is negative. c. Sequences designed to test the motif. d. Arrays expanded with the sequences indicated in c. Unfilled circles represent individual replicates. Bars show mean ± SEM. *=p<0.05. e. NNN-containing oligo. f. Acquisition frequency of protospacers containing each NNN Cartesian product (of oligo-derived acquisitions), ranked by frequency. Plots as in a. g. Representation of nucleotides at positions 31-33 in acquired spacers from the NNN-containing oligo. Plot as in d. Statistical details in Supplementary Table 1.
Figure 3
Figure 3
Encoding a GIF in bacteria. a. GIF to be encoded, along with an example of one pixet protospacer. b. Schematic of recording process. c. Percentage of arrays with expansions in the first three positions, by protospacer origin, at each sample point. Bars show mean ± SEM (n=3). d. Accurately recalled pixets as a function of reads (on the x axis) and frame (denoted by color). Points show individual biological replicates. e. Examples of the result at different sequence depths (see dotted gray lines in d). f. Protospacer acquisition frequency for individual protospacers (of oligo-derived acquisitions) by frame, ranked by acquisition frequency. Points show individual replicates. g. pLogo of the top 10% of protospacers (all protospacers as background). Red line indicates p<0.05. Over-represention is positive, under-represention is negative. h. Result of electroporating the same oligos in the reverse order. Statistical details in Supplementary Table 1.

Comment in

Similar articles

Cited by

References

    1. Church GM, Gao Y, Kosuri S. Next-generation digital information storage in DNA. Science. 2012;337:1628. doi: 10.1126/science.1226355. - DOI - PubMed
    1. Goldman N, et al. Towards practical, high-capacity, low-maintenance information storage in synthesized DNA. Nature. 2013;494:77–80. doi: 10.1038/nature11875. - DOI - PMC - PubMed
    1. Gibson DG, et al. Creation of a bacterial cell controlled by a chemically synthesized genome. Science. 2010;329:52–56. doi: 10.1126/science.1190719. - DOI - PubMed
    1. Clelland CT, Risca V, Bancroft C. Hiding messages in DNA microdots. Nature. 1999;399:533–534. doi: 10.1038/21092. - DOI - PubMed
    1. Adleman LM. Molecular computation of solutions to combinatorial problems. Science. 1994;266:1021–1024. - PubMed

Publication types