. 2017 Jul 27;547(7664):445-448.
doi: 10.1038/nature23014. Epub 2017 Jul 12.

A novel mechanism for mechanosensory-based rheotaxis in larval zebrafish

Affiliations

A novel mechanism for mechanosensory-based rheotaxis in larval zebrafish

Pablo Oteiza et al. Nature. .

Erratum in

Abstract

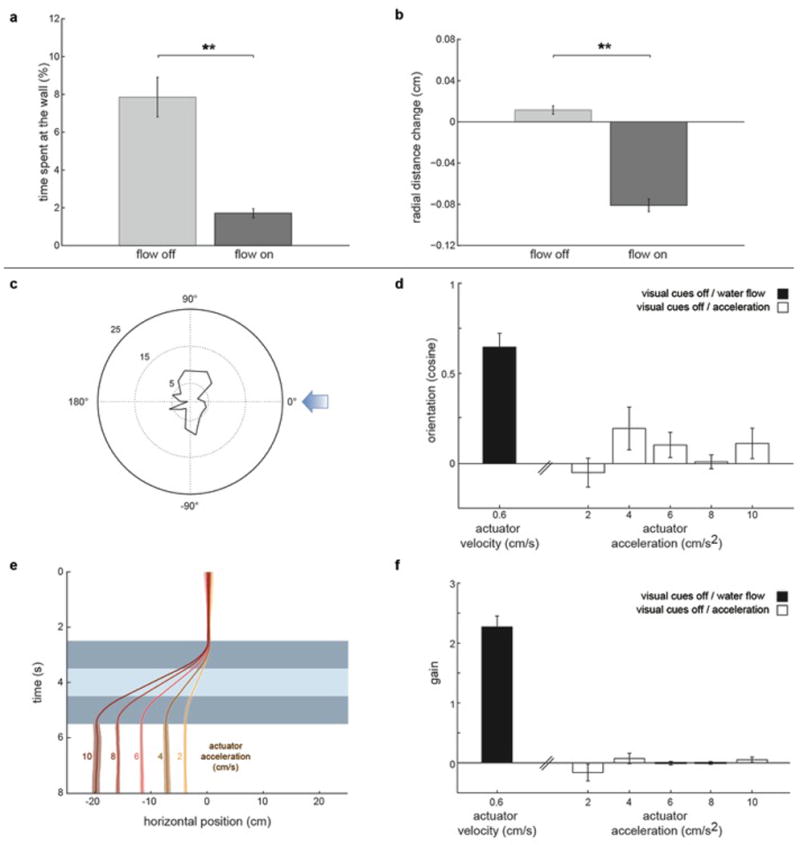
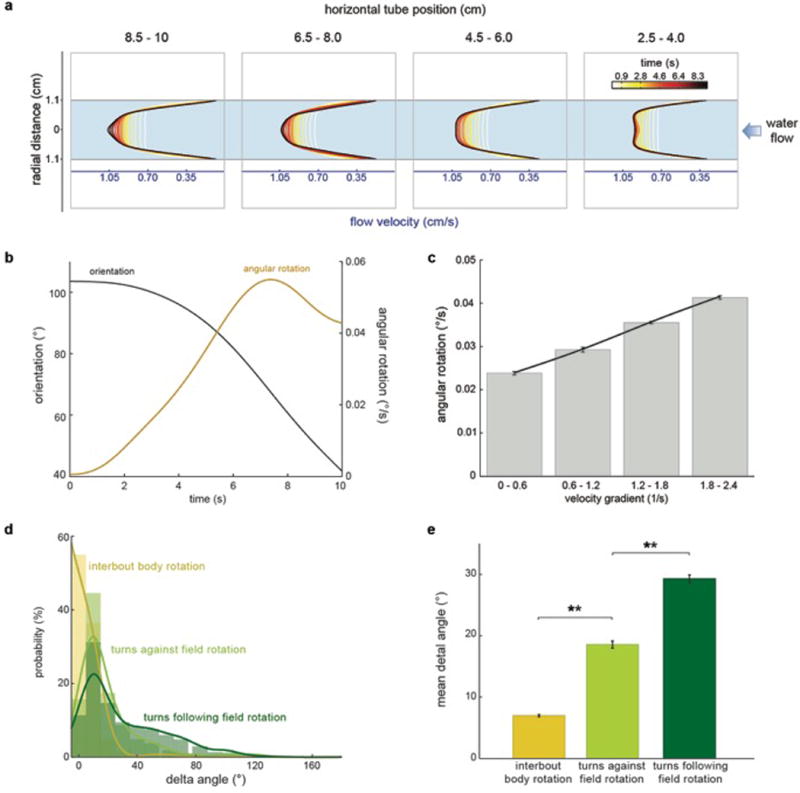
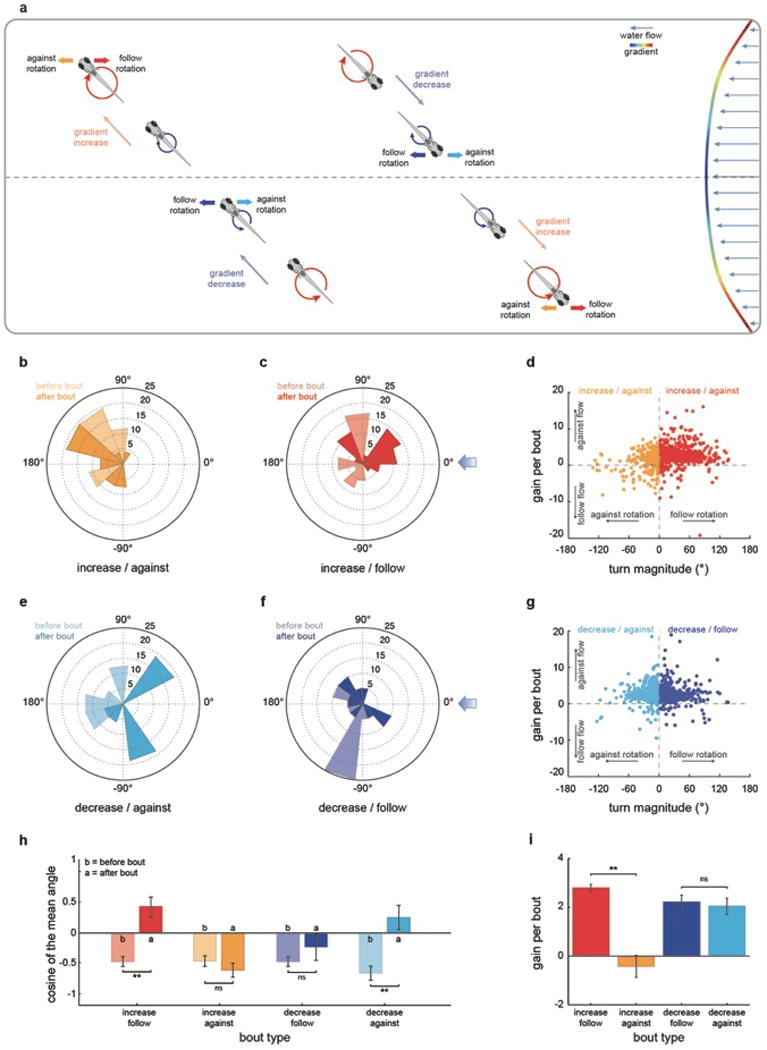
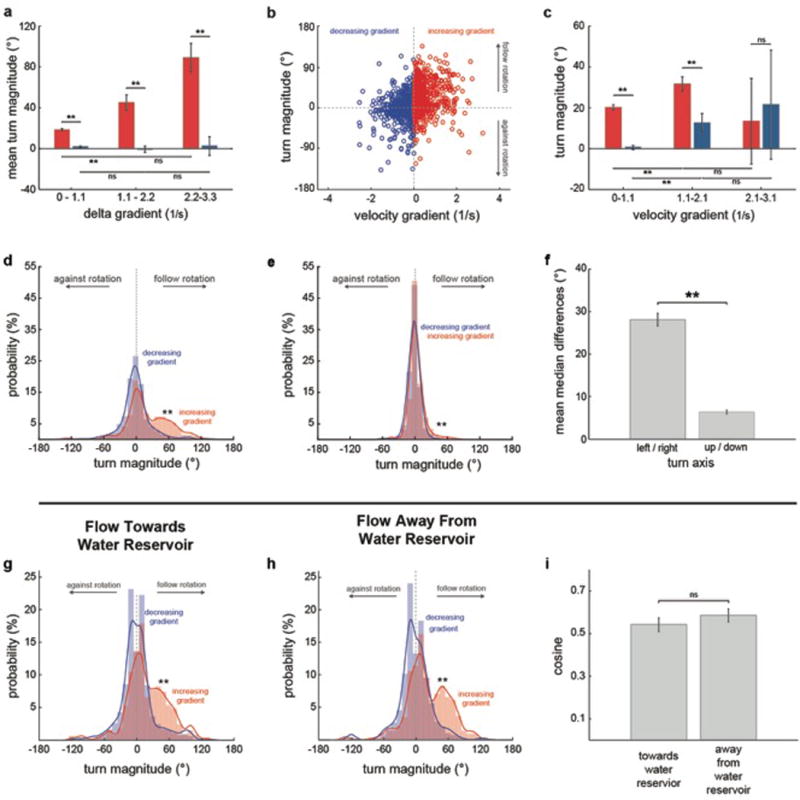
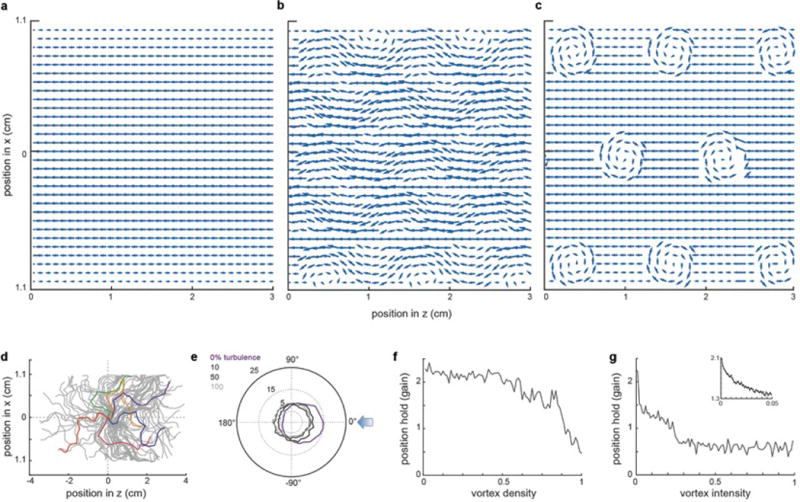
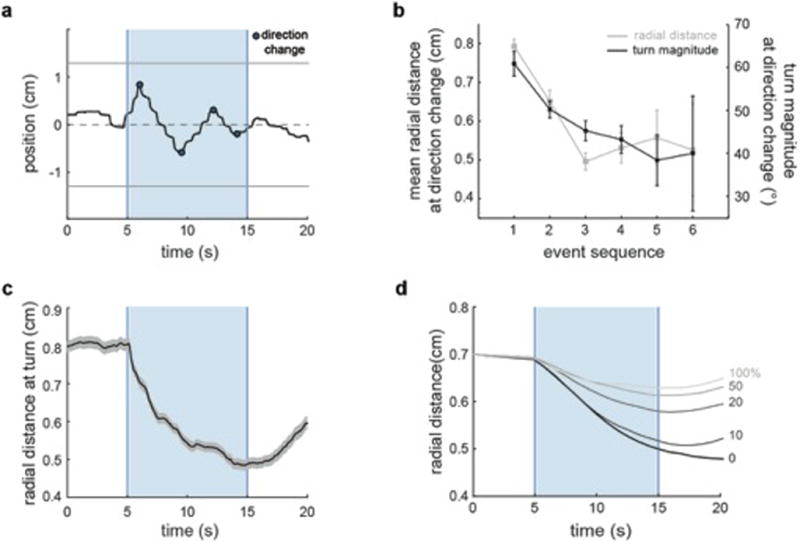
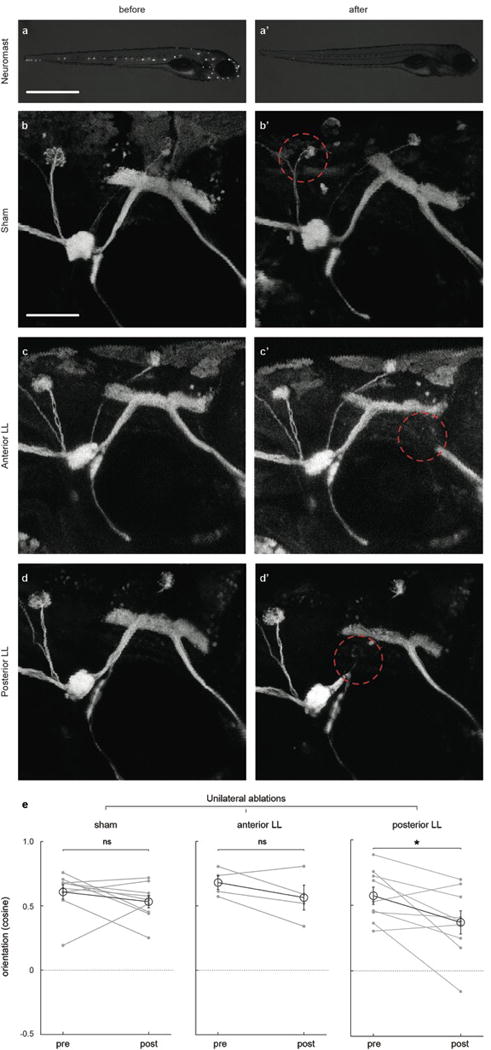
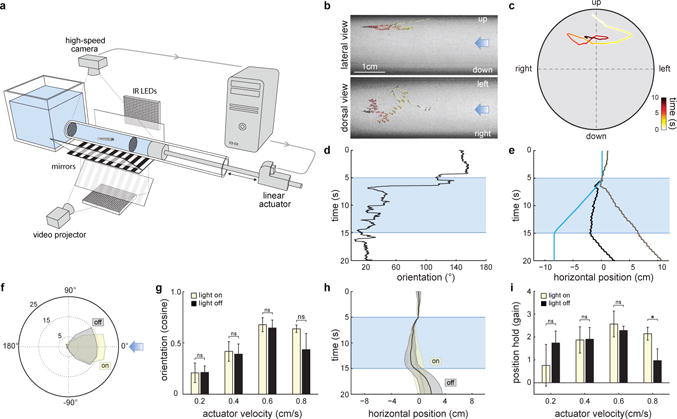
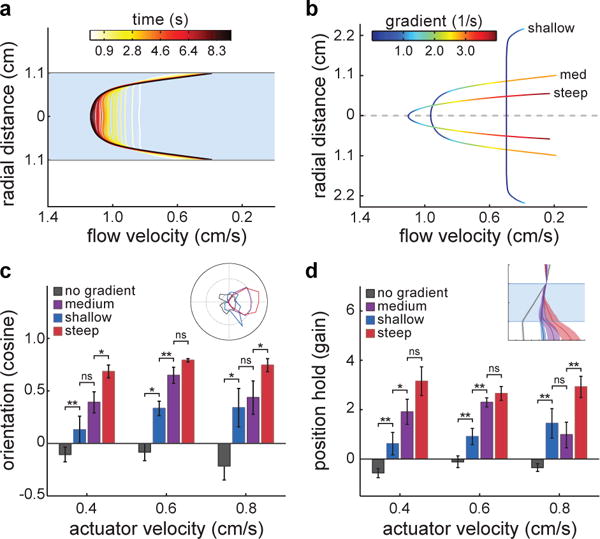
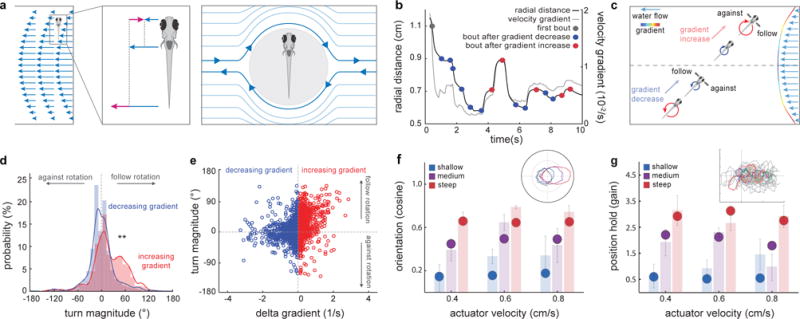
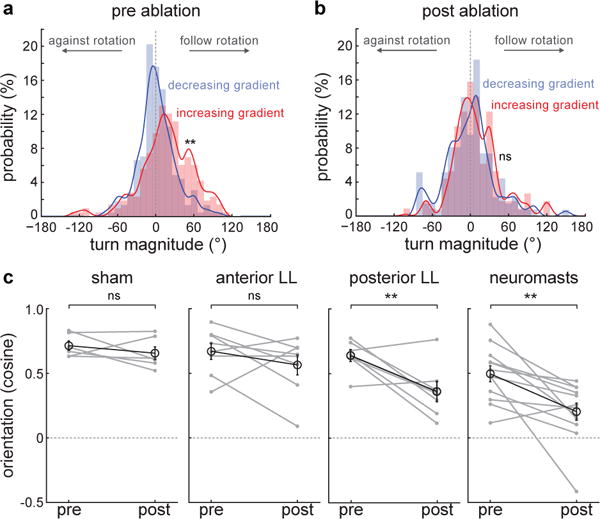
When flying or swimming, animals must adjust their own movement to compensate for displacements induced by the flow of the surrounding air or water. These flow-induced displacements can most easily be detected as visual whole-field motion with respect to the animal's frame of reference. Despite this, many aquatic animals consistently orient and swim against oncoming flows (a behaviour known as rheotaxis) even in the absence of visual cues. How animals achieve this task, and its underlying sensory basis, is still unknown. Here we show that, in the absence of visual information, larval zebrafish (Danio rerio) perform rheotaxis by using flow velocity gradients as navigational cues. We present behavioural data that support a novel algorithm based on such local velocity gradients that fish use to avoid getting dragged by flowing water. Specifically, we show that fish use their mechanosensory lateral line to first sense the curl (or vorticity) of the local velocity vector field to detect the presence of flow and, second, to measure its temporal change after swim bouts to deduce flow direction. These results reveal an elegant navigational strategy based on the sensing of flow velocity gradients and provide a comprehensive behavioural algorithm, also applicable for robotic design, that generalizes to a wide range of animal behaviours in moving fluids.


Conflict of interest statement

The authors declare no competing financial interests. Readers are welcome to comment on the online version of the paper.

Figures

Extended Data Fig.1
Extended Data Fig.1. Touch and acceleration do not explain rheotaxis in larval zebrafish
a, Percentage of time fish spend at the wall; n = 13 fish, 341 trials. b, Mean radial distance change for bouts occurring in close proximity to the wall (<0.36cm, 1/3 of the tube radius). n = 13 fish, 1364 bouts. c-f, Rheotactic metrics for larval zebrafish exposed to a series of acceleration/water displacement/de-acceleration stimulus. c, Polar plot of fish orientation in the axis of the stimulation. Blue arrow represents stimulus direction. d, cosine of the mean orientation for fish presented with different acceleration regimes. Black bar represents cosine of the mean orientation for fish exposed to water flow in the dark (Fig.1g). e, Fish position (from the observer’s point of view) in the axis of the stimulus. Dark blue represent acceleration/de-acceleration periods while light blue represents water displacement. f, Gain for fish presented with different acceleration regimes. Black bar represents gain for fish exposed to water flow in the dark (Fig.1i). n = 6 fish subjected to 6 trials at each acceleration regime (180 trials total). All data is shown as means ± s.e.m. ** = p<0.01; Monte Carlo permutation test.
Extended Data Fig.2
Extended Data Fig.2. Gradient-dependent rotation of the larval zebrafish body
a, Development of flow velocity profiles obtained through Particle Image Velocimetry at different points in the horizontal axis of the tube (see Methods). b, Orientation (black) and angular rotation (brown) changes in a single paralyzed larval zebrafish in water flow. Data corresponds to the example shown in Extended Data Movie 2. c, Mean angular rotational velocities for different velocity gradient magnitudes. n = 3 fish, 18 trials. d, Inter-bout body rotation (yellow) and turn magnitude histogram for bouts going against (light green) and following (dark green) flow rotational fields. Histograms and fitted lines for each distribution are shown. n = 13 fish, 341 trials. e, Mean delta angle for inter-bout body rotation and turns following/going against flow field rotation. n = 3840 inter-bout periods, 2831 bouts. Means and ± s.e.m. (c,e) and bars and fitted lines (d) are shown. ** = p<0.01; Monte Carlo permutation test.
Extended Data Fig.3
Extended Data Fig.3. The rheotactic algorithm allows the fish to orient and swim against incoming water flows
a, Graphical representation of bout types during rheotaxis. b, c, e, f, Polar plots of fish orientation before (light color) and after (dark color) high magnitude (>45 degrees) turns that start when fish is facing away from the flow. n = 98 bouts. d, g, Scatter plots of turn magnitude vs gain for bouts occurring after increases (d) or decreases (g) in gradient magnitude. n = 2598 bouts. h, Cosine of the mean orientation for the data shown in (b, c, e, f). i, Gain for high magnitude turns extracted from the data shown in (d, g). n = 508 bouts. Data is shown as means ± s.e.m. * = p>0.01&<0.05; ** = p<0.01, Monte Carlo permutation test.
Extended Data Fig.4
Extended Data Fig.4. The rheotactic algorithm depends on delta velocity gradients, is mainly composed of lateral turns and is independent of flow direction
a, Mean turn magnitude for bouts occurring after increases or decreases in gradient magnitude, grouped by delta gradient. Data is the same as in Fig3, e. b, Scatter plot of absolute velocity gradient versus turn magnitude for bouts occurring at intermediate tube regions (0.36-0.74cm away from the walls) that can be reached from both low and high gradient areas. n = 13 fish, 1691 bouts. c, Mean turn magnitude for bouts following increases or decreases in gradient magnitude, grouped by absolute velocity gradient. Data is the same as in (b). d-e, Turn magnitude histogram for left/right (d) and up/down (e) turns. n = 13 fish, 341 trials. f, Mean difference between the medians of increasing and decreasing gradient turn distributions. Data is the same as in (d,e). g–i, Turn magnitude histogram for experiments in which water flowed towards (g) or away (h) from the water reservoir (ftwr and fawr conditions, respectively). n = 13 fish; 170 and 171 trials for ftwr and awr experiments, respectively. i, Cosine of the mean orientation for ftwr and fawr experiments. Data is the same as in (g,h). Means and ± s.e.m. (a,c,f,i) and bars and fitted lines (d,e,g,h) are shown. ns = p>0.05; ** = p<0.01; Kolmogorov- Smirnov (d,e,g,h) and Monte Carlo permutation (a,c,f,i) tests.
Extended Data Fig.5
Extended Data Fig.5. Model fish perform rheotaxis in a virtual turbulent flow
a, Virtual laminar flow profile used for modeling rheotactic behavior (Fig.3 f–g). b, Flow profile in (a) after the addition of Karman vortex streets to (a) at 50% intensity and 100% density. c, Flow profile in (a) after the addition of static vortices set to 100% intensity and 100% density. d, Trajectories of one hundred (grey) modeled fish facing a virtual turbulent flow towards the left. Five examples are colored for clarity. e, Polar plot of model fish orientation under different turbulence strengths. f, Gain of model fish as a function of increasing vortex density at a constant 100% vortex intensity. g, Gain of model fish as a function of increasing vortex intensity at a constant 100% vortex density. Inset is an expanded view of the initial gain drop.
Extended Data Fig.6
Extended Data Fig.6. Larval zebrafish swims towards the center of the tube during rheotaxis
a, Horizontal (left/right) positions of a single fish during rheotaxis. Light blue indicates water flow stimulus and dark blue dots indicate direction change events. Data corresponds to the example shown in Fig.1b–e. b, Radial distance and turn magnitude at consecutive swim direction changes. n = 774 direction change events. c, Radial distance over time. n = 13 fish, 341trials. d, Radial distance over time for a modeled particle following the rheotactic algorithm at different vortex densities. Data is shown as means ± s.e.m. ** = p<0.01; Monte Carlo permutation test.
Extended Data Fig.7
Extended Data Fig.7. Bilateral Lateral Line stimulation is required for rheotaxis in larval zebrafish
a–d, Representative examples of copper-mediated chemical neuromast (a-a’) and 2-photon laser sham (b-b’), anterior (c-c’) and posterior (d-d’) LL nerve ablations before (left column) and after (right column) treatment. DiasP stained (a-a’) and GFP-expressing Tg(HGn93D) fish shown. Red dotted circles indicate the region in which laser power was focused. e, Cosine of the mean orientation for fish subjected to unilateral laser ablations of the LL nerve. Mean and SEM of the population (black) and means of individual fish (grey) before and after treatment are shown. n = sham, 9 fish; Anterior LL ablation, 4 fish; Posterior LL ablation, 9 fish. All fish were subjected to 6 trials before and after manipulations. ns = p>0.05, * = p<0.05&>0.01; Monte Carlo permutation test.
Figure1
Figure1. Larval zebrafish perform rheotaxis in the absence of visual cues
a, Schematics of the setup. b, Time-projection of a zebrafish larva performing rheotaxis in the dark. Light blue arrows represent flow direction. c, Cross-sectional view of the trial shown in (b). d-e, Behavioral features of the trial shown in (b-c). Light blue indicates water flow stimulus is on. d, Fish orientation in relation to water flow. e, Fish position in the axis of the water flow from the observer’s (black trace) and the fish’s (grey trace) point of view. Blue trace corresponds to the displacement of the water column. f-i, Rheotaxis in the presence and absence of visual cues. f, Polar plot of fish orientation in the axis of the flow during stimulation. Light blue arrow represents flow direction. g, Cosine of the mean orientation (see Methods) for fish presented with different actuator velocities. h, Fish position (from the observer’s point of view) in the axis of the water flow. i, gain (see Methods) for fish presented with different actuator velocities. n = 6 fish subjected to 12 trials at each actuator velocity (288 trials total). Data is shown as means ± s.e.m. ns = p>0.05; * = p>0.01&<0.05; Monte Carlo permutation test.
Figure2
Figure2. Flow velocity gradients are the stimulus for rheotaxis in larval zebrafish
a, Development of the flow velocity profile obtained through Particle Image Velocimetry in the behavioral chamber. b, Flow velocity profiles and gradient magnitudes in different diameter tubes (see Methods). c, Cosine of the mean orientation for fish presented with different gradient conditions. Inset: Polar plot of fish orientation during flow stimulation. d, Gain for fish in each of the gradient conditions. Inset: Horizontal positions of fish from the observer’s point of view. n = 6 fish subjected to 6 trials at each actuator velocity (108 trials) for each gradient condition (432 trials total). Medium gradient values are the same as in Fig.1g,i. Data is shown as means ± s.e.m. ns = p>0.05; * = p>0.01&<0.05; ** = p<0.01; Monte Carlo permutation test.
Fig.3
Fig.3. A behavioral algorithm for rheotaxis in larval zebrafish
a, Schematics of gradient-induced rotational flow fields. A fish in a gradient will drift at the flow velocity in its center of mass (left). As a consequence, the differences between fish velocity and the rest of the flow velocities (center) will induce a local rotational flow field around the animal (right). b, Radial distance (grey trace) and velocity gradient (black trace) experienced by a single fish during a trial. Swim bouts occur after increases (red dots) or decreases (blue dots) in gradient magnitude. Data corresponds to the example shown in Fig.1b–e. c, Graphical representation of bout types during rheotaxis. d, Histogram for turn magnitudes during rheotaxis. ** = p<0.01. Kolmogorov-Smirnov test, n = 13 fish, 341 trials. e, Scatter plot of turn magnitude vs delta gradient. n = 13 fish, 2762 bouts. f, g, model fish perform rheotaxis. Comparison of cosine of the mean orientation (f) and gain (g) between model (circles) and real (shaded bars, data as in Fig.2b,d) fish. Insets: f, Polar plot of model fish orientation under different gradient conditions and g, trajectories of one hundred (grey) modeled fish facing a virtual flow towards the left. Five examples are colored for clarity.
Fig.4
Fig.4. The mechanosensory lateral line system acts as a gradient sensor during larval zebrafish rheotaxis
a–b, Turn magnitude histogram before (a) and after (b) copper-induced chemical ablation of all neuromast hair cells. ** = p<0.01; Kolmogorov-Smirnov test. n = 12 fish. c, Mean orientation of fish subjected to different experimental conditions. Mean and s.e.m. of the population (black) and means of individual fish (grey) before and after treatment are shown. n = sham, 6 fish; anterior lateral line ablation, 8 fish; posterior lateral line ablation, 7 fish; chemical neuromast ablation, 12 fish. All fish were subjected to 6 trials before and after manipulations. ns = p>0.05, ** = p<0.01; Monte Carlo permutation test.

Comment in

  • Biomechanics: How fish feel the flow.
    Dabiri JO. Dabiri JO. Nature. 2017 Jul 27;547(7664):406-407. doi: 10.1038/nature23096. Epub 2017 Jul 12. Nature. 2017. PMID: 28700572 No abstract available.

References

    1. Chapman JW, et al. Animal orientation strategies for movement in flows. Curr Biol. 2011;21:R861–870. - PubMed
    1. Lyon EP. On rheotropism I. Rheotropism in fishes. Am J Physiol. 1904;12:149–161.
    1. Dijkgraaf S. The functioning and significance of the lateral-line organs. Biol Rev Camb Philos Soc. 1963;38:51–105. - PubMed
    1. Montgomery J, Baker CF, Carton AG. The lateral line can mediate rheotaxis in fish. Nature. 1997;389:960–963.
    1. Olszewski J, Haehnel M, Taguchi M, Liao JC. Zebrafish larvae exhibit rheotaxis and can escape a continuous suction source using their lateral line. PLoS One. 2012;5:e36661. - PMC - PubMed

Publication types

LinkOut - more resources