. 2017 Jul 12;13(7):e1006883.
doi: 10.1371/journal.pgen.1006883. eCollection 2017 Jul.

Systematic identification and characterization of regulatory elements derived from human endogenous retroviruses

Affiliations

Systematic identification and characterization of regulatory elements derived from human endogenous retroviruses

Jumpei Ito et al. PLoS Genet. .

Abstract

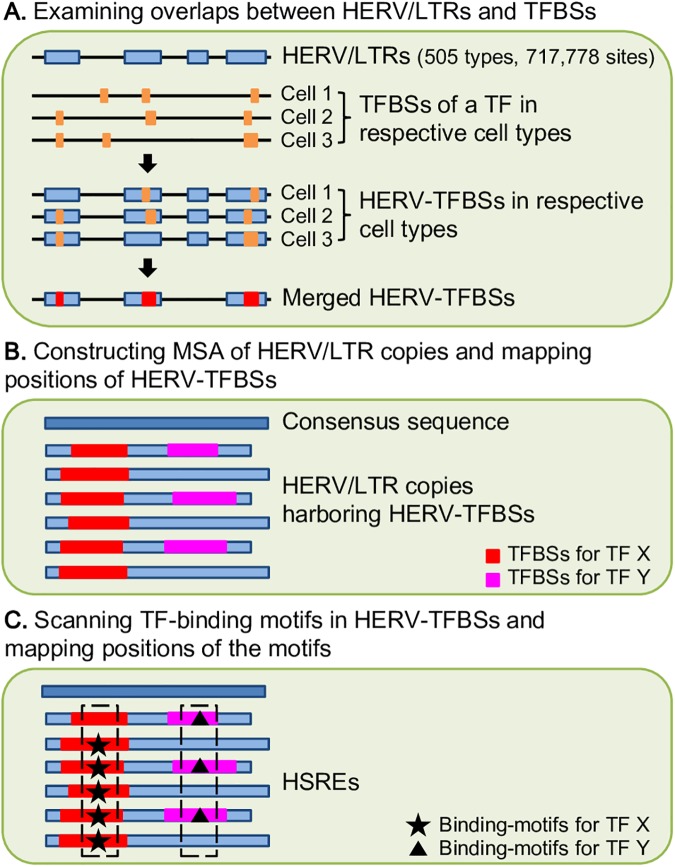
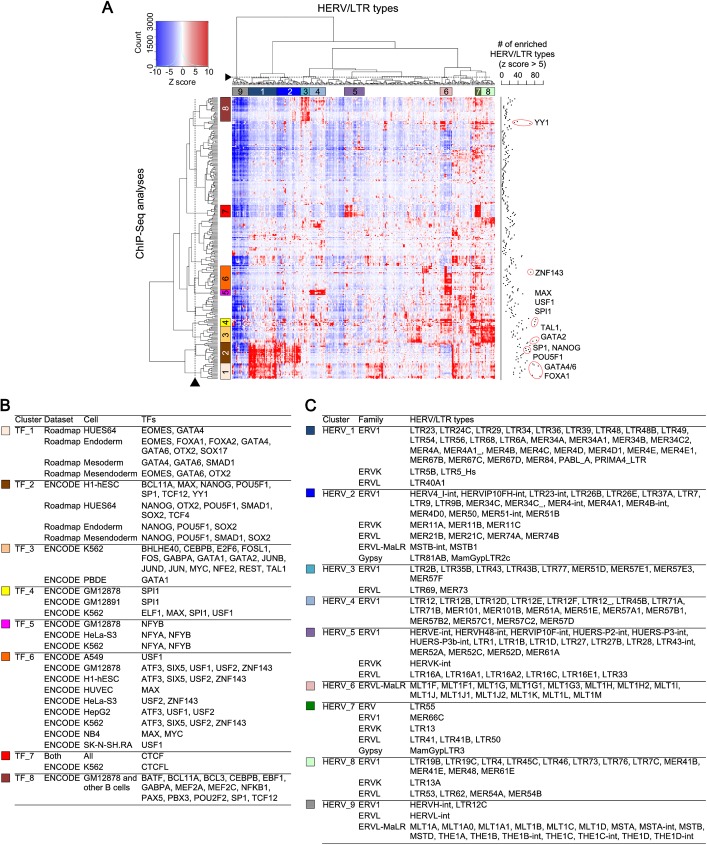
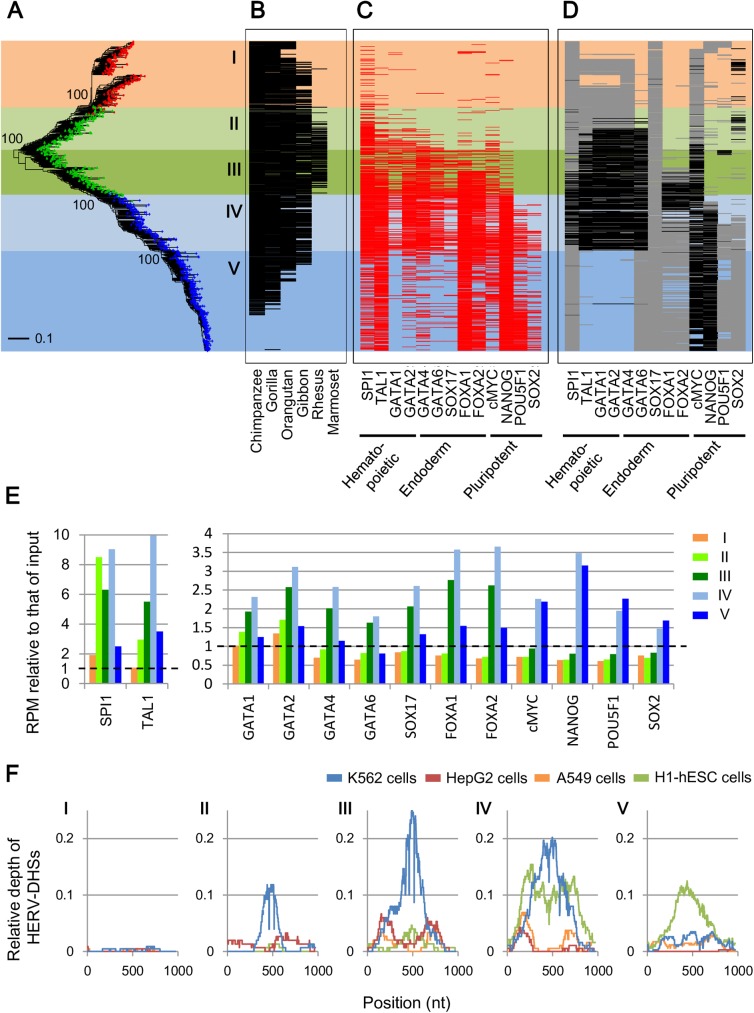
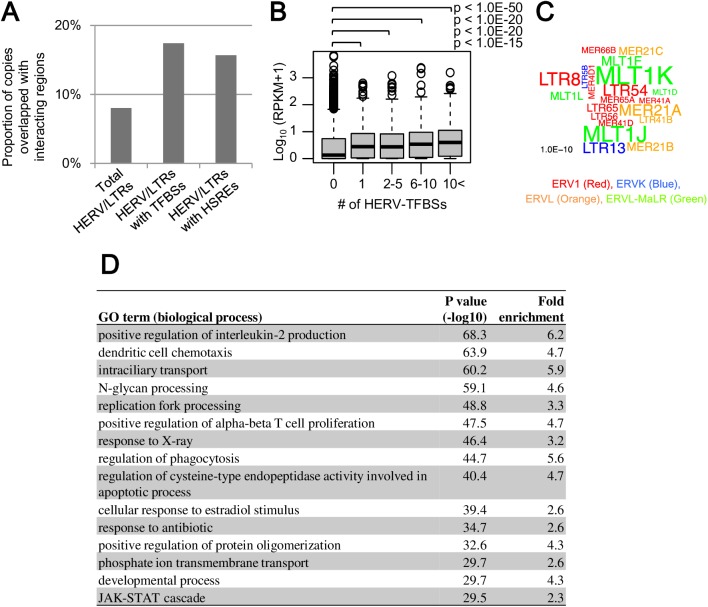
Human endogenous retroviruses (HERVs) and other long terminal repeat (LTR)-type retrotransposons (HERV/LTRs) have regulatory elements that possibly influence the transcription of host genes. We systematically identified and characterized these regulatory elements based on publicly available datasets of ChIP-Seq of 97 transcription factors (TFs) provided by ENCODE and Roadmap Epigenomics projects. We determined transcription factor-binding sites (TFBSs) using the ChIP-Seq datasets and identified TFBSs observed on HERV/LTR sequences (HERV-TFBSs). Overall, 794,972 HERV-TFBSs were identified. Subsequently, we identified "HERV/LTR-shared regulatory element (HSRE)," defined as a TF-binding motif in HERV-TFBSs, shared within a substantial fraction of a HERV/LTR type. HSREs could be an indication that the regulatory elements of HERV/LTRs are present before their insertions. We identified 2,201 HSREs, comprising specific associations of 354 HERV/LTRs and 84 TFs. Clustering analysis showed that HERV/LTRs can be grouped according to the TF binding patterns; HERV/LTR groups bounded to pluripotent TFs (e.g., SOX2, POU5F1, and NANOG), embryonic endoderm/mesendoderm TFs (e.g., GATA4/6, SOX17, and FOXA1/2), hematopoietic TFs (e.g., SPI1 (PU1), GATA1/2, and TAL1), and CTCF were identified. Regulatory elements of HERV/LTRs tended to locate nearby and/or interact three-dimensionally with the genes involved in immune responses, indicating that the regulatory elements play an important role in controlling the immune regulatory network. Further, we demonstrated subgroup-specific TF binding within LTR7, LTR5B, and LTR5_Hs, indicating that gains or losses of the regulatory elements occurred during genomic invasions of the HERV/LTRs. Finally, we constructed dbHERV-REs, an interactive database of HERV/LTR regulatory elements (http://herv-tfbs.com/). This study provides fundamental information in understanding the impact of HERV/LTRs on host transcription, and offers insights into the transcriptional modulation systems of HERV/LTRs and ancestral HERVs.


Conflict of interest statement

The authors have declared that no competing interests exist.

Figures

Fig 1
Fig 1. Scheme of identification of HERV-TFBSs and HSREs.
HERV-TFBSs and HSREs were identified separately using ENCODE and Roadmap datasets. HERV-TFBSs and HSREs were identified for all- and unique-read TFBSs. A) HERV-TFBSs were identified in respective cell types by examining overlaps between HERV/LTRs and TFBSs. HERV-TFBSs of each TF were merged among cell types (merged HERV-TFBSs). B) In each HERV/LTR type, MSA of HERV/LTR copies was constructed with the consensus sequence, and then the position of the merged HERV-TFBS was mapped on each HERV/LTR sequence in the MSA. Red and pink regions indicate HERV-TFBSs for TF X and Y, respectively. C) TF-binding motif was scanned in HERV-TFBS and mapped on each HERV/LTR sequence in the MSA. Star and triangle marks indicate TF-binding motifs for TF X and Y, respectively. A set of TF-binding motifs was regarded as HSRE if the TF-binding motifs were shared among greater than 60% of HERV-TFBSs at the same position in MSA. Boxed TF-binding motifs are HSREs for TF X and Y, respectively.
Fig 2
Fig 2. Statistical enrichment of respective TFBSs in each type of HERV/LTRs.
Results from unique-read TFBSs are shown. A) The heatmap with hierarchical clustering, which shows statistical enrichment of respective TFBSs in each type of HERV/LTRs. Color in heatmap (from blue to red) indicates enrichment significance (z score) to random expectation. The row indicates TFBSs from a ChIP-Seq analysis. The column indicates a HERV/LTR type. The dendrograms were cut at heights denoted by broken lines. Fourteen clusters were identified for HERV/LTRs and TFBSs. Of these, characteristic clusters of TFBSs (TF_1–8) and HERV/LTRs (HERV_1–9) are shown. The cut heights and the characteristic clusters were manually chosen according to dendrograms and color patterns in heatmap. The number of HERV/LTR types highly enriched in each TFBS dataset (z score >5) is shown on the right side of the heatmap. B) Characteristic clusters of TFBSs (TF_1–8). Ectoderm, endoderm, mesoderm, and mesendoderm were differentiated from HUES64 cells. C) Characteristic clusters of HERV/LTRs (HERV_1–9). Classification of the HERV/LTR family is based on RepeatMasker (20-Mar-2009) (http://www.repeatmasker.org/).
Fig 3
Fig 3. Characteristics of HSREs identified in LTR7 from the Roadmap dataset.
Results from all-read TFBSs are shown. A) and B) Number of HERV-TFBSs mapped on each consensus position of LTR7. Results for NANOG and EOMES are shown in (A), and those for FOXA1, SOX2, POU5F1, FOXA2, and GATA6 are sown in (B). The X-axis indicates nucleotide position of the consensus sequence of LTR7. The Y-axis indicates the number of HERV/LTR copies harboring HERV-TFBSs at each position. C) and D) Number of TF-binding motifs in HERV-TFBSs mapped on each consensus position of LTR7. Results for NANOG and EOMES are shown in (C), and those for FOXA1, SOX2, POU5F1, FOXA2, and GATA6 are shown in (D). The X-axis indicates consensus position of LTR7. The Y-axis indicates number of HERV/LTR copies harboring the TF-binding motifs in TFBSs at each position. Peaks of the motifs corresponding to HSREs are denoted by an asterisk (*) with motif names (e.g., SOX2 M0). E) The number of HERV-DHSs (DHSs on HERV/LTRs) mapped on each consensus position of LTR7. The X-axis indicates consensus position of LTR7. The Y-axis indicates the number of HERV/LTR copies harboring HERV-DHSs at each position. F) Proportion of LTR7 copies overlapped with each chromatin state predicted by genome segmentation method [–49]. TSS, promoter region including TSS; PF, predicted promoter flanking region; E, enhancer; WE, weak enhancer or open chromatin cis regulatory element. G) The unrooted phylogenetic tree of LTR7 copies reconstructed using the maximum likelihood method with RAxML [67]. Fragmented and outlier copies were excluded from the analysis. In total, 1,914 (out of 2,344) of LTR7 copies were included in the tree. Representative supporting values calculated by Shimodaira-Hasegawa (SH)-like test [68] are shown on the corresponding branches. Identified phylogenetic subgroups (subgroups I, II, and III) are shown. H) Orthologous copies of LTR7 in the reference genomes of primates. The order of LTR7 copies is the same to (G). I) TFBSs on each LTR7 copy. The order of LTR7 copies is the same to (G). J) TF-binding motifs at positions corresponding to HSREs on each LTR7 copy. The order of LTR7 copies is the same to (G). Black and gray colors respectively indicate the presences of motifs with p values of <0.0001 and <0.001, identified by FIMO [64]. K) Enrichment of sequence reads mapped to LTR7 copies belonging to respective subgroups. The Y-axis shows reads per million (RPM) relative to that of input control. L) Insertion dates of proviruses of HERVH/LTR7 along with the species tree of primates. Upper panel: The boxplot showing insertion dates of the respective proviruses estimated by sequence comparison between 5′- and 3′-LTRs. Insertion dates of the proviruses are separately shown in the respective subgroups. Categories of subgroups I, II, and III contained 66, 248, and 227 copies of proviruses, respectively. Lower panel: Phylogenetic tree of primates with time scale. The tree was obtained from TIMETREE [72]. Red branch in the tree indicates the period when the rewiring of the core regulatory network of pluripotent cells seems to have occurred.
Fig 4
Fig 4. Changes in regulatory elements in LTR5 group.
Results from all-read TFBSs are shown. A) The unrooted phylogenetic tree of LTR5A (red), LTR5B (green), and LTR5_Hs (blue) copies constructed using the maximum likelihood method. LTR5 was divided into five groups (I–V) based on the tree and their TFBSs (shown in (C)). Fragmented and outlier copies were excluded from the analysis. Copies of 233, 300, and 532 respectively belonging to LTR5A, LTR5B, and LTR5_Hs were included in the tree (out of 265, 431, and 645, respectively). Representative bootstrap values are shown at the corresponding nodes. B) Orthologous copies in the reference genomes of primates. The order of LTR5 copies is the same to (A). C) TFBSs present on each copy; representative TFBSs are shown. TFBSs of SPI1, TAL1, and GATA1/2 were from the ENCODE dataset, and others were from the Roadmap dataset. The order of LTR5 copies is the same to (A). D) TF-binding motifs at positions corresponding to HSREs on each LTR5 copy. The order of LTR5 copies is the same to (A). Black and gray colors respectively indicate the presence of motifs with p values of <0.0001 and <0.001, as identified by FIMO [64]. E) Enrichment of sequence reads mapped to LTR5 copies belonging to respective subgroups. The Y-axis shows RPM relative to that of the input control. F) Relative number of HERV-DHSs mapped on each consensus position. The X-axis indicates nucleotide position in the consensus sequence of LTR5_Hs. The Y-axis indicates proportion of HERV/LTR copies harboring HERV-DHSs at each position.
Fig 5
Fig 5. Characteristics of genes in the vicinity of HERV-TFBSs.
Results from unique-read TFBSs are shown. A) Enrichment of HERV-TFBSs as seen in regions near cell type-specific genes. In respective cell types, 200 of the specifically expressed genes according to the cell type were identified. Then we measured enrichments of HERV-TFBSs of respective cell types in regions near the cell type-specific genes using the GREAT [53]. Fold enrichment scores (left) and p values (right) are shown as heatmaps. Fold enrichment scores of >1.2 are shown with the corresponding p values. B) Distance-based GO enrichment analysis. GO terms in the category of biological process were examined. The GREAT analyses [53] were performed using sets of all HERV-TFBSs in respective cell types. HERV-TFBSs identified in cells treated with special conditions (e.g., supplement of interferon) were excluded. GO terms were summarized by REVIGO [73]. GO terms with hold enrichment scores of >2 are shown.
Fig 6
Fig 6. Long-range interactions between HERV-TFBSs/HSREs and promoters of host genes.
The interactions were extracted using pcHi-C dataset in GM12878 cells [54, 55]. Results from unique-read TFBSs are shown. A) Proportion of HERV/LTR copies overlapped with promoter-interacting regions. Proportions of total HERV/LTRs, HERV/LTRs with HERV-TFBSs, and HERV/LTRs with HSREs are separately shown. B) Transcription levels (log10 (RPKM+1)) of protein-coding genes and number of HERV-TFBSs interacting with the genes. Genes were divided into five categories based on the number of HERV-TFBSs interacting with the genes (0, 1, 2–5, 6–10, and 10<). Categories of the 0, 1, 2–5, 6–10, and 10< respectively contained 13,265, 1,179, 1,946, 822, and 1,639 of genes. P values were calculated using the Mann-Whitney U test with adjustment for multiple tests using the BH method. C) The word cloud indicating HERV/LTR types enriched in the interacting regions. Word sizes are proportional to the −log10 (p value) calculated using the Fisher’s exact test. The word colors indicate HERV/LTR families. D) Hi-C-based GO enrichment analysis. A set of all HERV-TFBSs in GM12878 cells was used. HERV-TFBSs identified in cells treated with special conditions (e.g., supplement of interferon) were excluded. GO terms were summarized by REVIGO [73]. GO terms with hold enrichment scores of >2 are shown.

Similar articles

Cited by

References

    1. Lander ES, Linton LM, Birren B, Nusbaum C, Zody MC, Baldwin J, et al. Initial sequencing and analysis of the human genome. Nature. 2001;409: 860–921. doi: 10.1038/35057062 - DOI - PubMed
    1. Hurst GD, Werren JH. The role of selfish genetic elements in eukaryotic evolution. Nat Rev Genet. 2001;2: 597–606. doi: 10.1038/35084545 - DOI - PubMed
    1. Feschotte C, Gilbert C. Endogenous viruses: insights into viral evolution and impact on host biology. Nat Rev Genet. 2012;13: 283–296. doi: 10.1038/nrg3199 - DOI - PubMed
    1. Mi S, Lee X, Li X, Veldman GM, Finnerty H, Racie L, et al. Syncytin is a captive retroviral envelope protein involved in human placental morphogenesis. Nature. 2000;403: 785–789. doi: 10.1038/35001608 - DOI - PubMed
    1. Blaise S, de Parseval N, Benit L, Heidmann T. Genomewide screening for fusogenic human endogenous retrovirus envelopes identifies syncytin 2, a gene conserved on primate evolution. Proc Natl Acad Sci U S A. 2003;100: 13013–13018. doi: 10.1073/pnas.2132646100 - DOI - PMC - PubMed

MeSH terms

Substances