. 2017 Jul 10;12(7):e0180777.
doi: 10.1371/journal.pone.0180777. eCollection 2017.

Anomalous diffusion and q-Weibull velocity distributions in epithelial cell migration

Affiliations

Anomalous diffusion and q-Weibull velocity distributions in epithelial cell migration

Tatiane Souza Vilela Podestá et al. PLoS One. .

Abstract

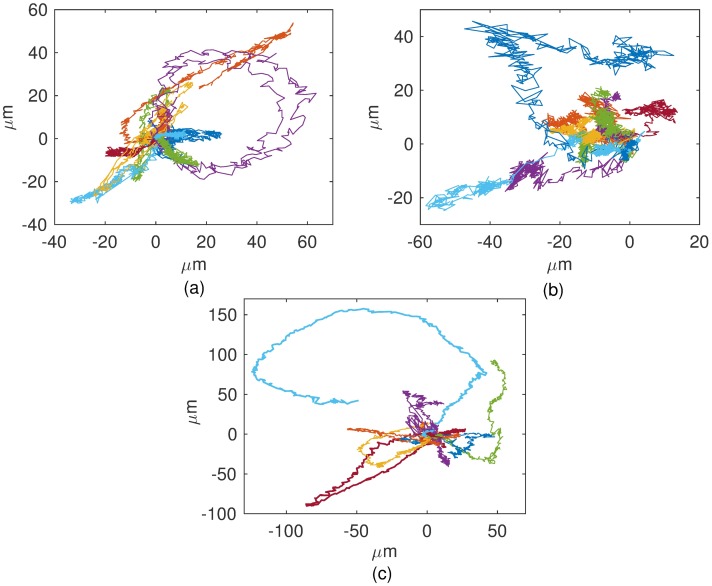
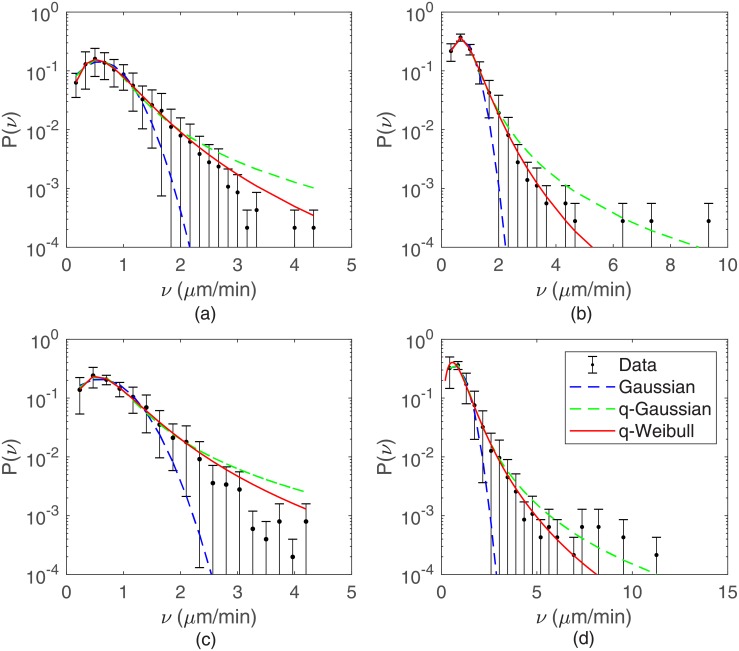
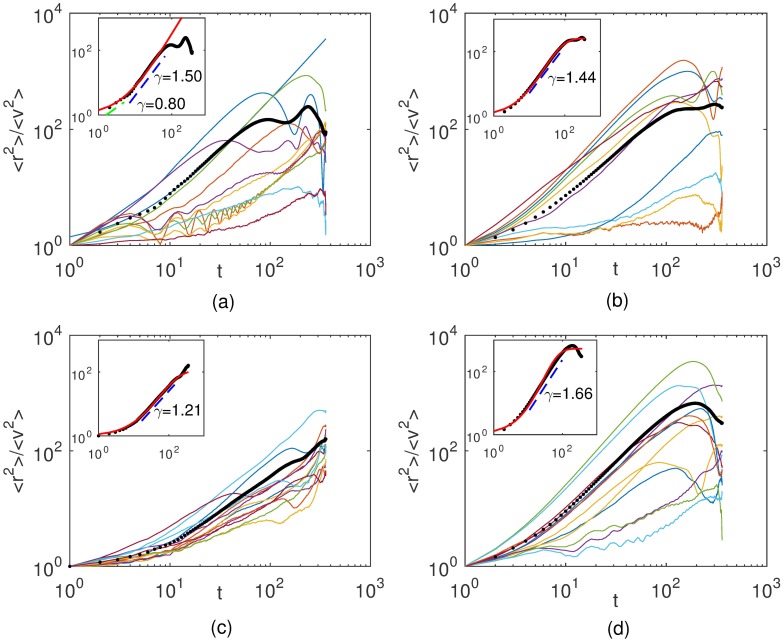
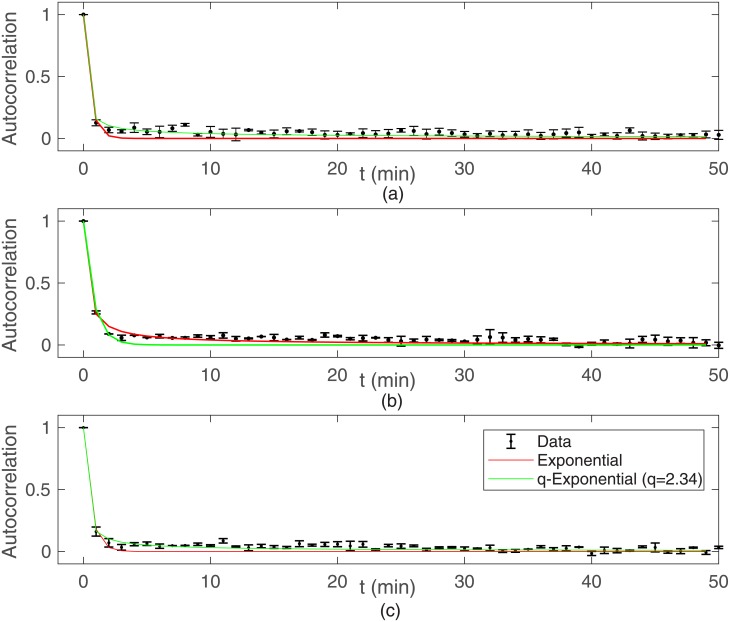
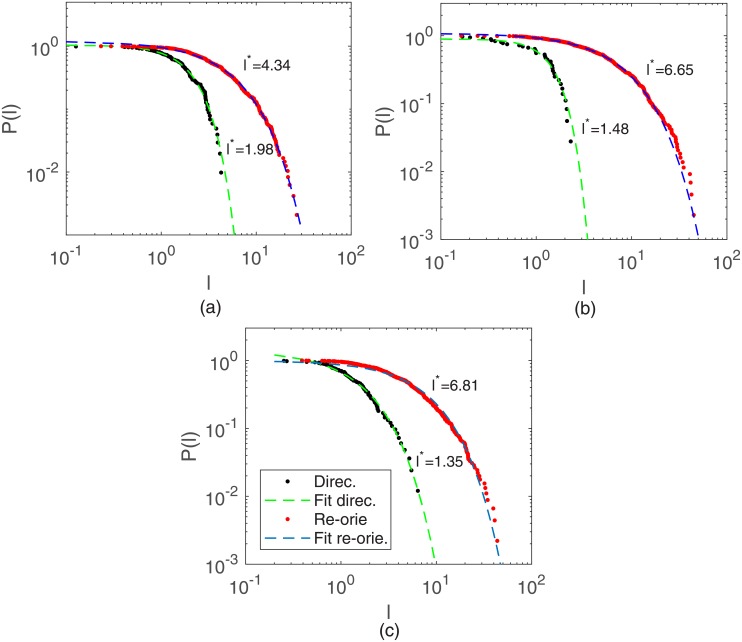
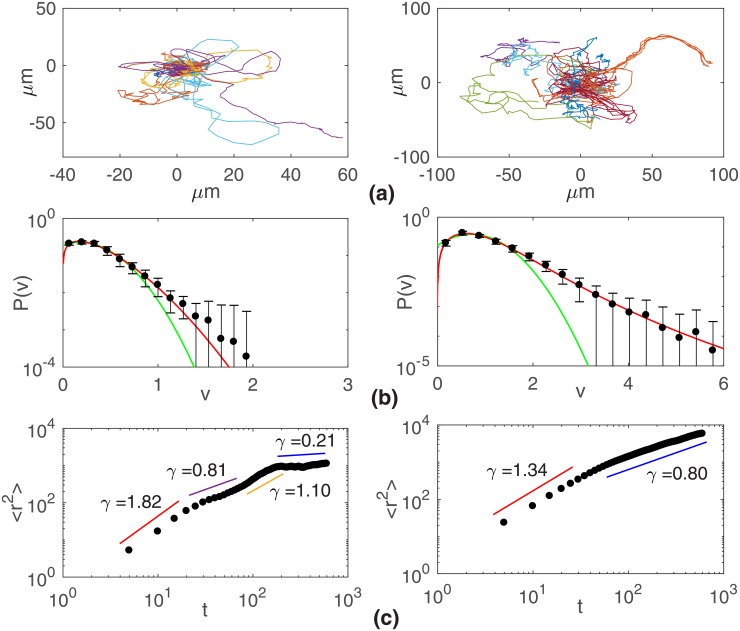
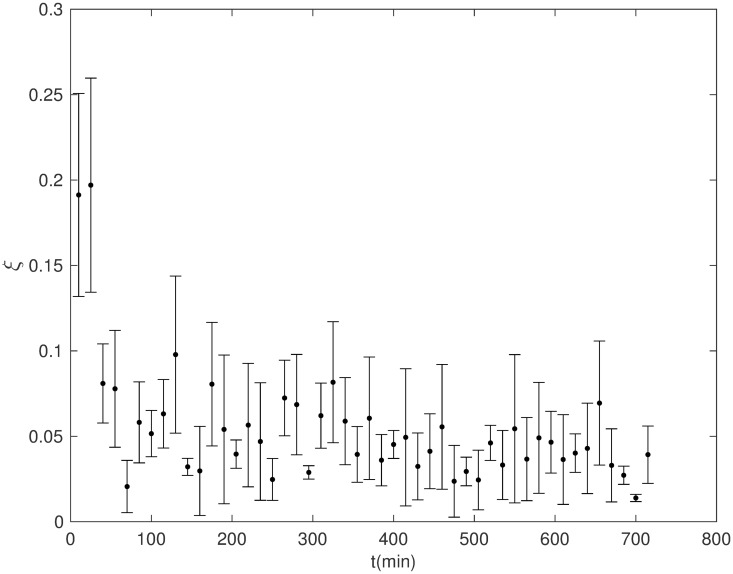
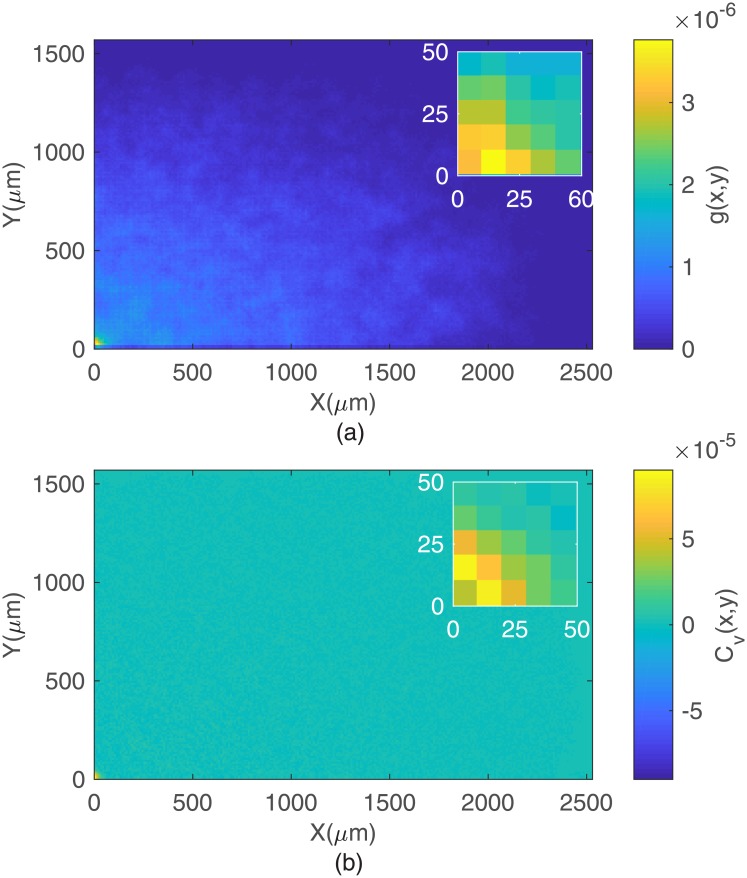
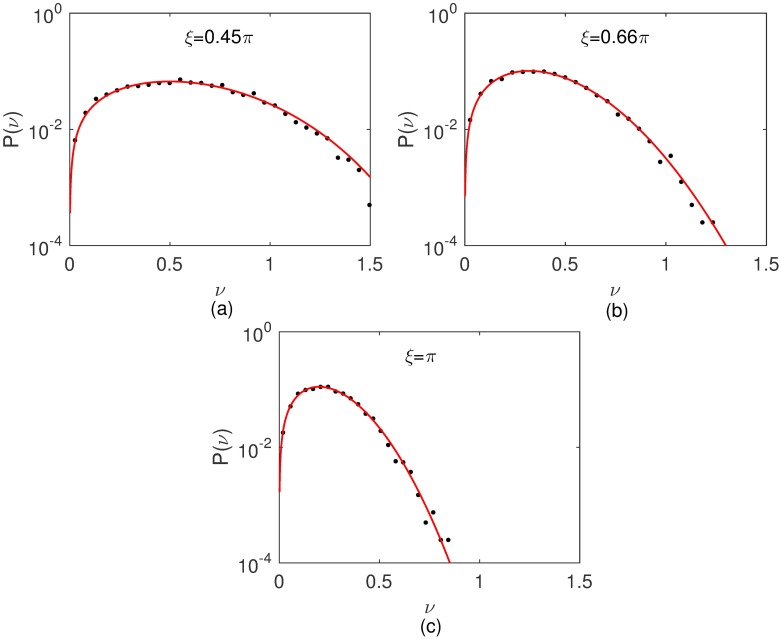
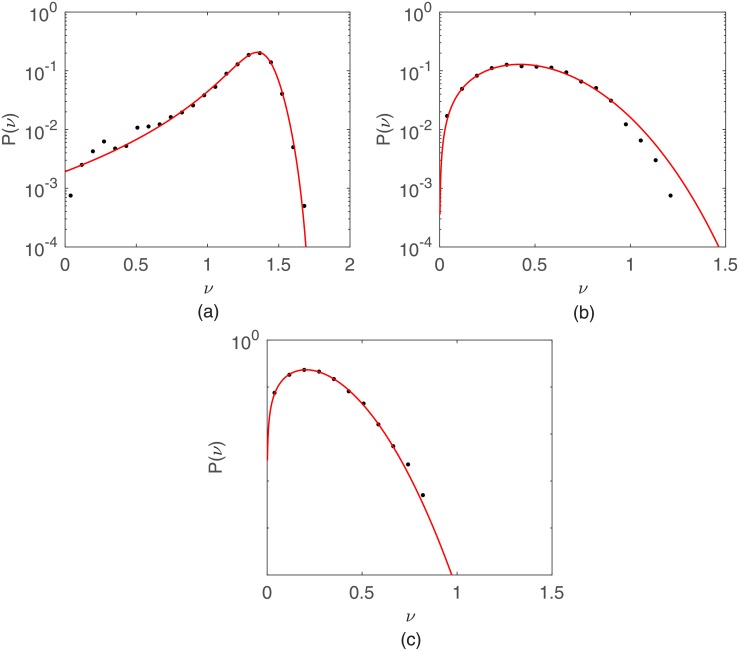
In multicellular organisms, cell motility is central in all morphogenetic processes, tissue maintenance, wound healing and immune surveillance. Hence, the control of cell motion is a major demand in the creation of artificial tissues and organs. Here, cell migration assays on plastic 2D surfaces involving normal (MDCK) and tumoral (B16F10) epithelial cell lines were performed varying the initial density of plated cells. Through time-lapse microscopy quantities such as speed distributions, velocity autocorrelations and spatial correlations, as well as the scaling of mean-squared displacements were determined. We find that these cells exhibit anomalous diffusion with q-Weibull speed distributions that evolves non-monotonically to a Maxwellian distribution as the initial density of plated cells increases. Although short-ranged spatial velocity correlations mark the formation of small cell clusters, the emergence of collective motion was not observed. Finally, simulational results from a correlated random walk and the Vicsek model of collective dynamics evidence that fluctuations in cell velocity orientations are sufficient to produce q-Weibull speed distributions seen in our migration assays.


Conflict of interest statement

Competing Interests: The authors have declared that no competing interests exist.

Figures

Fig 1
Fig 1. Typical migration tracks of B16F10.
Cells on 2D plastic substrates plated at (a) 20, (b) 2000, and (c) 10000 cells per cm2. The trajectories were produced by time-lapse recording of cells every 1 min and plotted from the origin.
Fig 2
Fig 2. Ensemble speed distributions for B16F10.
Cells plated at densities of (a) 20, (b) 100, (c) 2000, and (c) 10000 cells per cm2. The solid curves are q-Weibull fits to data. For comparison, Gaussian and q-Gaussian distributions fitted to data are shown (dashed curves). The velocities for every individual cell were merged to form single large data sets. Other values than kmax = 30 were used to fix the speed bin size, generating very similar speed distributions (see S1 PDF).
Fig 3
Fig 3. Mean-squared displacements 〈r2〉 as functions of time for B16F10.
Cells plated at (a) 20, (b) 100, (c) 2000, and (c) 10000 cells per cm2. The color curves correspond to distinct cell trajectories. The thick black curve is the average of all trajectories. The dashed lines are power law fits to data whose slopes provide the exponents γ characterizing the migratory regimes. Mean-squared displacements were divided by 〈v2〉 in order to put in the same scale cells with very distinct motilities. Insets: Average mean-squared displacements fitted by Eq (9). A crossover in time from a normal to a superdifusive regime is indicated.
Fig 4
Fig 4. Velocity autocorrelation functions for B16F10.
Cells plated at (a) 20, (b) 2000, and (b) 10000 cells per cm2. Velocities were defined as (displacement vector)/(time-lapse) for each cell track.
Fig 5
Fig 5. Cumulative distributions of flight lengths for B16F10.
Cells plated at (a) 20, (b) 2000, and (c) 10000 cells per cm2. A threshold α* = 30° was used. The continuous curves correspond to exponential fittings to the data with characteristic contour lengths l*.
Fig 6
Fig 6. Migratory traits of MDCK.
Cells plated at 1190 (left) and 11,900 (right) cells per cm2. (a) Typical cell tracks, (b) speed distributions, and (c) mean-squared displacements 〈r2〉. As for B16F10 cells, q-Weibull speed distributions and anomalous diffusive motion are observed.
Fig 7
Fig 7. Evolution in time of the order parameter ξ for MDCK.
Cells plated at 11,900 cells per cm2. The small ξ values indicate the absence of a long-range ordered cell migration.
Fig 8
Fig 8. Pair and spatial velocity correlation to MDCKS cells.
(a) Pair correlation g(x, y) and (b) spatial velocity correlation functions for MDCK cells plated at 11,900 cells per cm2, the larger density tested. Significant spatial correlations associated to the formation of small cell clusters are observed only at short distances, as shown in the inset.
Fig 9
Fig 9. Macroscopic speed distributions for the correlated random walk model at three different noise levels.
The sampling time is fixed in τ = 50. The solid curves in the histograms are q-Weibull fits to data.
Fig 10
Fig 10. Macroscopic speed distributions for the Vicsek model.
The same as in Fig 9 but for the Vicsek model.

Similar articles

Cited by

References

    1. Bray D (2001) Cell movements: from molecules to motility. New York: Garling Publishing.
    1. Thiery JP, Acloque H, Huang RYJ, Angela Nieto M (2009) Epithelial-mesenchymal transitions in development and disease. Cell 139: 871–890. 10.1016/j.cell.2009.11.007 - DOI - PubMed
    1. Carnell MJ, Insall RH (2011) Actin on disease—Studying the pathobiology of cell motility using Dictyostelium discoideum. Semin. Cell Develop. Biol. 22: 82–88. 10.1016/j.semcdb.2010.12.003 - DOI - PubMed
    1. Blitterswijk CV et al. eds. (2008) Tissue engineering. London: Academic Press
    1. Marchetti MC, Joanny JF, Ramaswamy S, Liverpool TB, Prost J, Rao M. et al. (2013) Hydrodynamicsof soft active matter. Rev. Mod. Phys. 25: 1143–1189.

LinkOut - more resources