. 2017 Jul 10;12(7):e0180712.
doi: 10.1371/journal.pone.0180712. eCollection 2017.

Renin inhibition improves metabolic syndrome, and reduces angiotensin II levels and oxidative stress in visceral fat tissues in fructose-fed rats

Affiliations

Renin inhibition improves metabolic syndrome, and reduces angiotensin II levels and oxidative stress in visceral fat tissues in fructose-fed rats

Chu-Lin Chou et al. PLoS One. .

Abstract

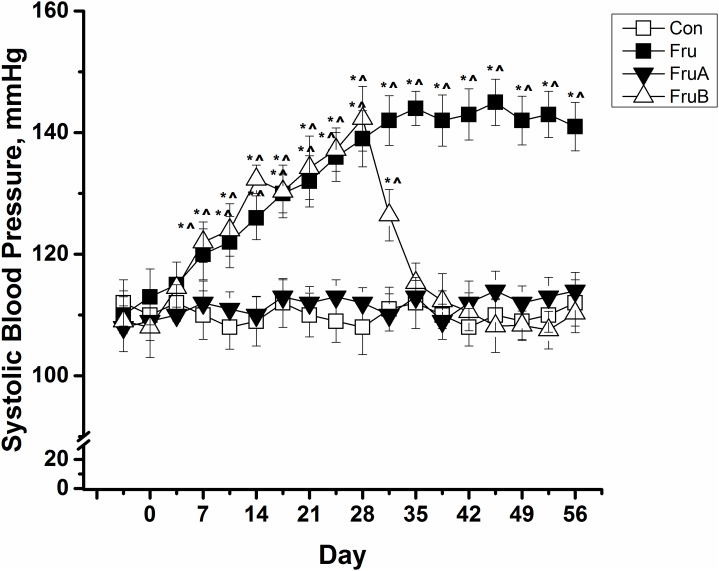
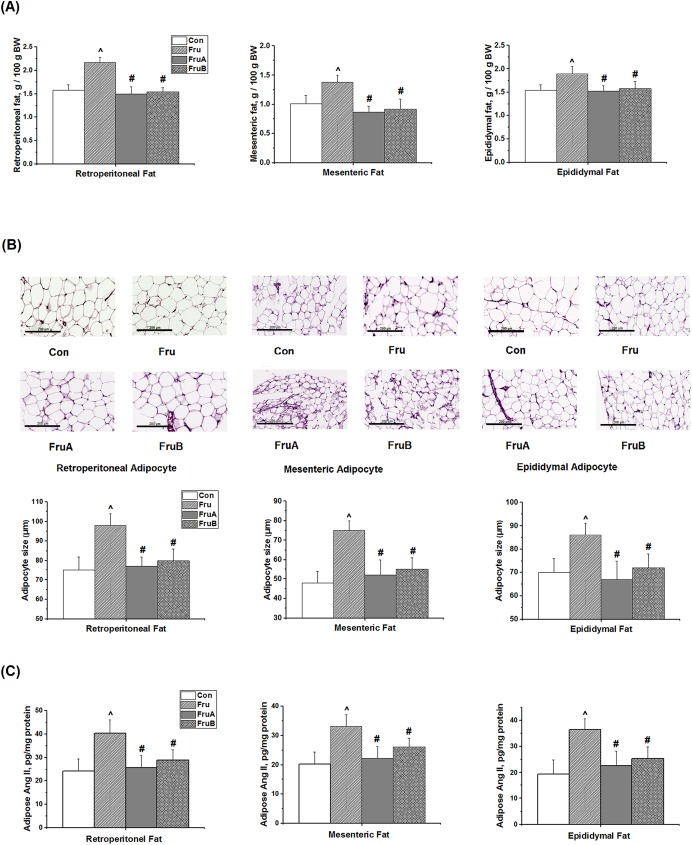
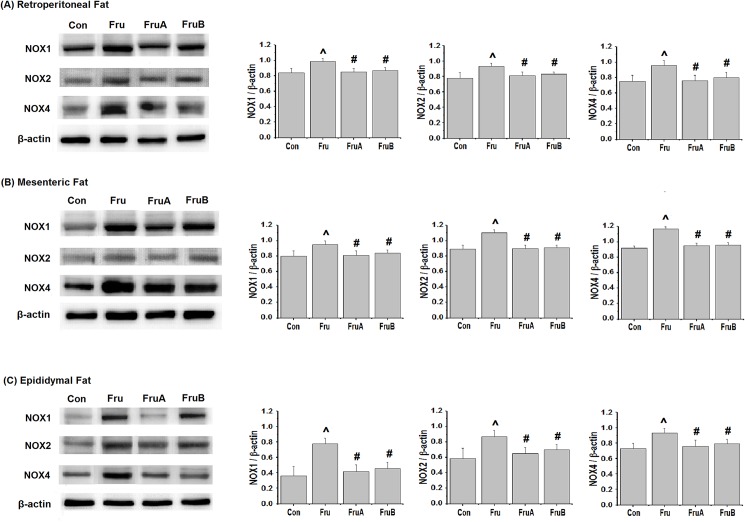
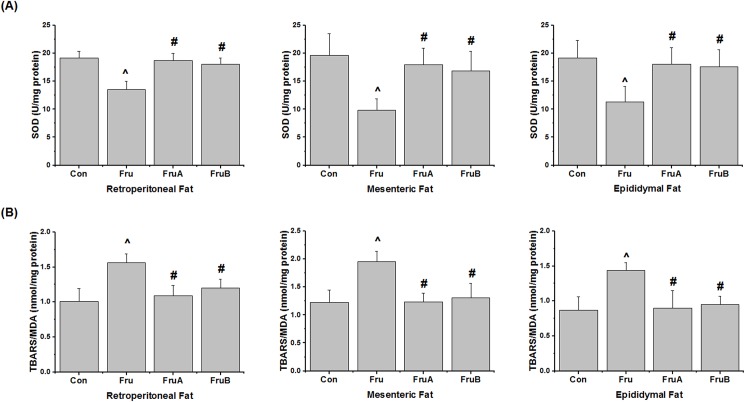
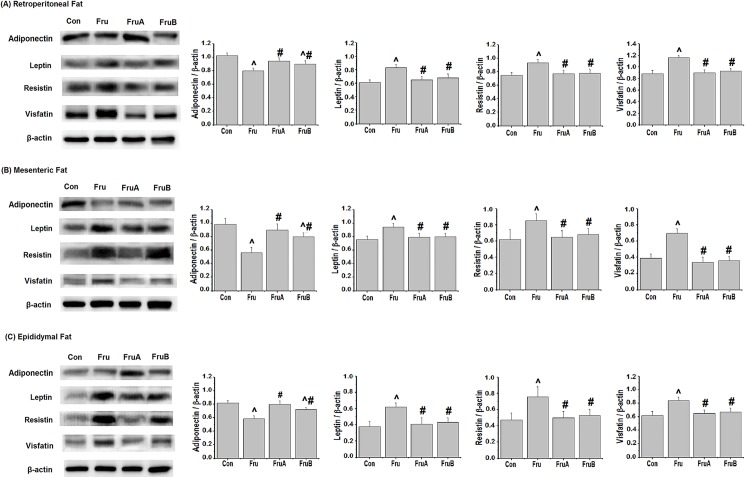
Renin-angiotensin system in visceral fat plays a crucial role in the pathogenesis of metabolic syndrome in fructose-fed rats. However, the effects of renin inhibition on visceral adiposity in metabolic syndrome are not fully investigated. We investigated the effects of renin inhibition on visceral adiposity in fructose-fed rats. Male Wistar-Kyoto rats were divided into 4 groups for 8-week experiments: Group Con (standard chow diet), Group Fru (high-fructose diet; 60% fructose), Group FruA (high-fructose diet and concurrent aliskiren treatment; 100 mg/kg body weight [BW] per day), and Group FruB (high-fructose diet and subsequent, i.e. 4 weeks after initiating high-fructose feeding, aliskiren treatment; 100 mg/kg BW per day). The high-fructose diet induced metabolic syndrome, increased visceral fat weights and adipocyte sizes, and augmented angiotensin II (Ang II), NADPH oxidase (NOX) isoforms expressions, oxidative stress, and dysregulated production of adipocytokines from visceral adipose tissues. Concurrent and subsequent aliskiren administration ameliorated metabolic syndrome, dysregulated adipocytokines, and visceral adiposity in high fructose-fed hypertensive rats, and was associated with reducing Ang II levels, NOX isoforms expressions and oxidative stress in visceral fat tissues. Therefore, this study demonstrates renin inhibition could improve metabolic syndrome, and reduce Ang II levels and oxidative stress in visceral fat tissue in fructose-fed rats, and suggests that visceral adipose Ang II plays a crucial role in the pathogenesis of metabolic syndrome in fructose-fed rats.


Conflict of interest statement

Competing Interests: The authors have declared that no competing interests exist.

Figures

Fig 1
Fig 1. Changes in systolic blood pressure in control and fructose-fed rats with or without aliskiren treatment.
Con: control rats were fed the normal chow diet; Fru: rats were fed the high-fructose diet for 8 weeks; FruA: rats received the same treatment as Group Fru, and aliskiren was concurrently administered; FruB: rats received the same treatment as Group Fru, and aliskiren was administered 4 weeks after the initiation of high-fructose feeding. Values are expressed as means ± standard deviation (SD) mean of six independent samples. * and ^ denote P < 0.05 versus a pre-fructose period and control rats at the corresponding time point, respectively. N = 6 for each group.
Fig 2
Fig 2
Effects of aliskiren on (A) the ratio of visceral fat pad weight over the whole body weight (BW) (gram/gram, %), (B) the histological photographs and sizes of adipocyte tissues, and (C) adipose angiotensin II levels from retroperitoneal, mesenteric, and epididymal fat in fructose-fed hypertensive rats. Con: control rats were fed the normal chow diet; Fru: rats were fed the high-fructose diet for 8 weeks; FruA: rats received the same treatment as Group Fru, and aliskiren was concurrently administered; FruB: rats received the same treatment as Group Fru, and aliskiren was administered 4 weeks after the initiation of high-fructose feeding. Scale bar: 200 μm. Values are expressed as means ± SD mean of six independent samples. ^ and # denote P < 0.05 versus control rats and fructose-fed rats, respectively. N = 6 for each group.
Fig 3
Fig 3
Effects of aliskiren on visceral adipose expression of the isoforms (A) NOX1, (B) NOX2, and (C) NOX4 of NOX family in fructose-fed hypertensive rats. Con: control rats were fed the normal chow diet; Fru: rats were fed the high-fructose diet for 8 weeks; FruA: rats received the same treatment as Group Fru, and aliskiren was concurrently administered; FruB: rats received the same treatment as Group Fru, and aliskiren was administered 4 weeks after the initiation of high-fructose feeding. Values are expressed as means ± SD mean of six independent samples. ^ and # denote P < 0.05 versus control rats and fructose-fed rats, respectively. N = 6 for each group.
Fig 4
Fig 4
Effects of aliskiren on markers of oxidative stress in visceral adipose tissues, namely (A) superoxide dismutase (SOD) and (B) thiobarbituric acid reactive substances (TBARS), in fructose-fed hypertensive rats. Con: control rats were fed the normal chow diet; Fru: rats were fed the high-fructose diet for 8 weeks; FruA: rats received the same treatment as Group Fru, and aliskiren was concurrently administered; FruB: rats received the same treatment as Group Fru, and aliskiren was administered 4 weeks after the initiation of high-fructose feeding. Values are expressed as means ± SD mean of six independent samples. ^ and # denote P < 0.05 versus control rats and fructose-fed rats, respectively. N = 6 per group.
Fig 5
Fig 5
Effects of aliskiren on the expression of adiponectin, leptin, resistin, and visfatin in (A) retroperitoneal fat, (B) mesenteric fat, and (C) epididymal fat of fructose-fed hypertensive rats. Con: control rats were fed the normal chow diet; Fru: rats were fed the high-fructose diet for 8 weeks; FruA: rats received the same treatment as Group Fru, and aliskiren was concurrently administered; FruB: rats received the same treatment as Group Fru, and aliskiren was administered 4 weeks after the initiation of high-fructose feeding. Values are expressed as means ± SD mean of six independent samples. ^ and # denote P < 0.05 versus control rats and fructose-fed rats, respectively. N = 6 per group.

References

    1. Ferder L, Ferder MD, Inserra F. The role of high-fructose corn syrup in metabolic syndrome and hypertension. Curr Hypertens Rep. 2010; 12(2):105–12. doi: 10.1007/s11906-010-0097-3 . - DOI - PubMed
    1. Meigs JB, Wilson PW, Fox CS, Vasan RS, Nathan DM, Sullivan LM, et al. Body mass index, metabolic syndrome, and risk of type 2 diabetes or cardiovascular disease. J Clin Endocrinol Metab. 2006; 91(8):2906–12. doi: 10.1210/jc.2006-0594 . - DOI - PubMed
    1. Hwang IS, Ho H, Hoffman BB, Reaven GM. Fructose-induced insulin resistance and hypertension in rats. Hypertension. 1987; 10(5):512–6. . - PubMed
    1. Miatello R, Cruzado M, Risler N. Mechanisms of cardiovascular changes in an experimental model of syndrome X and pharmacological intervention on the renin-angiotensin-system. Curr Vasc Pharmacol. 2004; 2(4):371–7. . - PubMed
    1. Risler NR, Cruzado MC, Miatello RM. Vascular remodeling in experimental hypertension. ScientificWorldJournal. 2005; 5:959–71. doi: 10.1100/tsw.2005.122 . - DOI - PMC - PubMed

MeSH terms