. 2017 Jul 12;15(7):e2000737.
doi: 10.1371/journal.pbio.2000737. eCollection 2017 Jul.

Four simple rules that are sufficient to generate the mammalian blastocyst

Affiliations

Four simple rules that are sufficient to generate the mammalian blastocyst

Silas Boye Nissen et al. PLoS Biol. .

Abstract

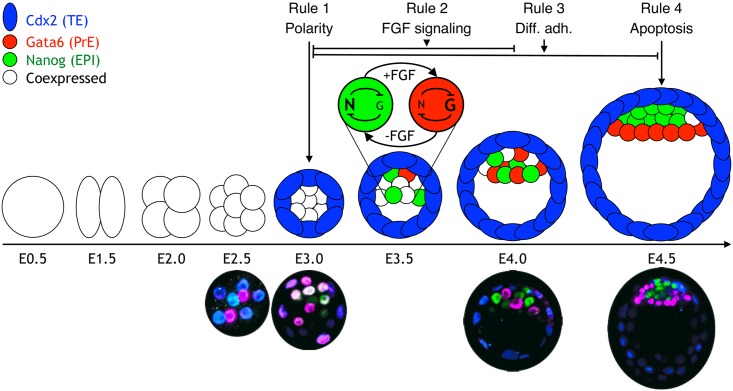
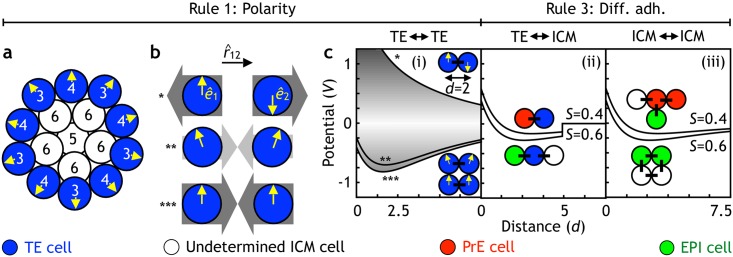
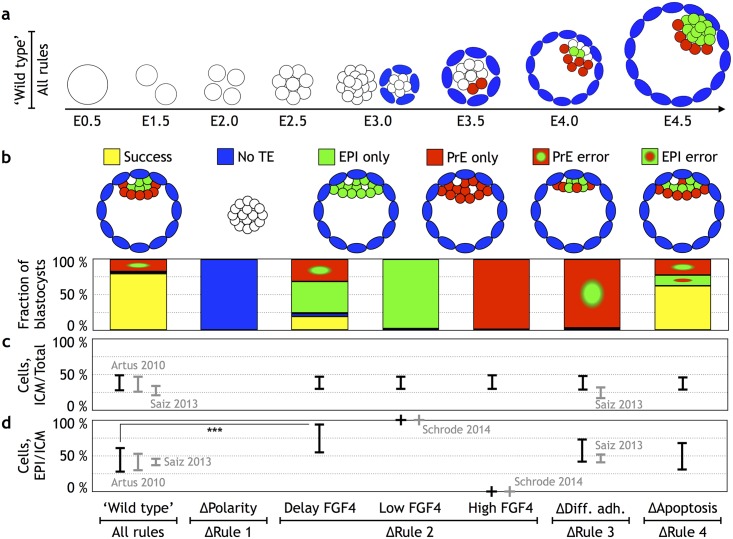
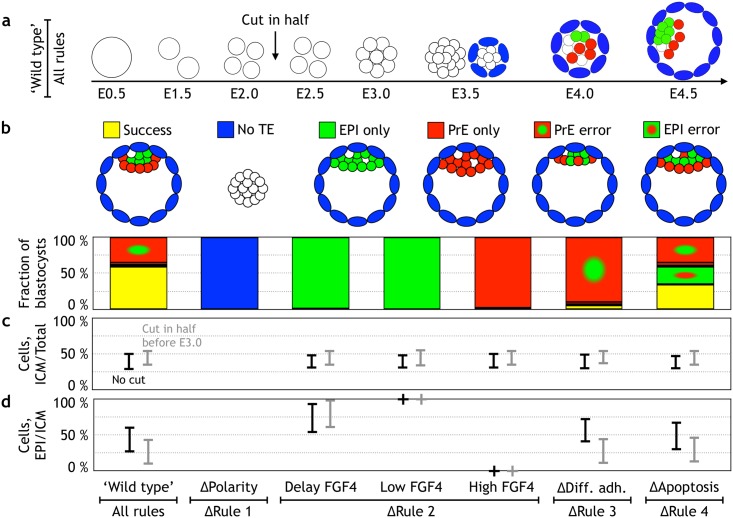
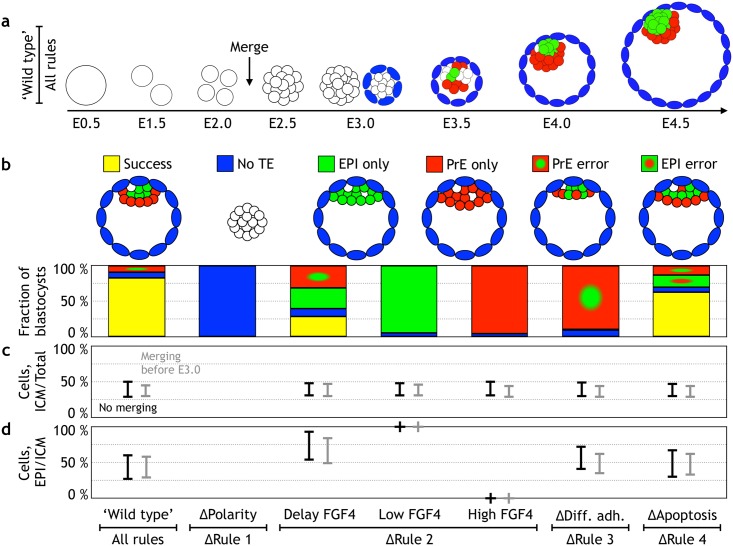
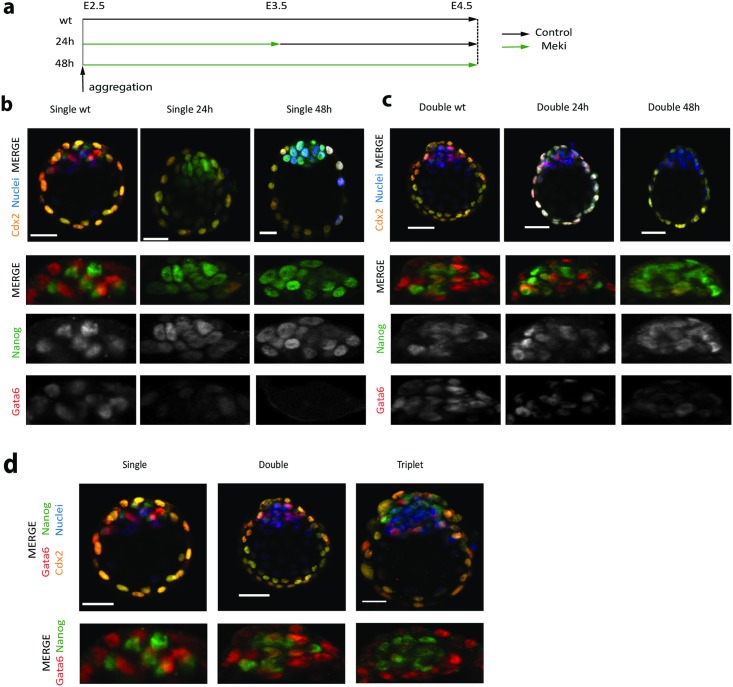
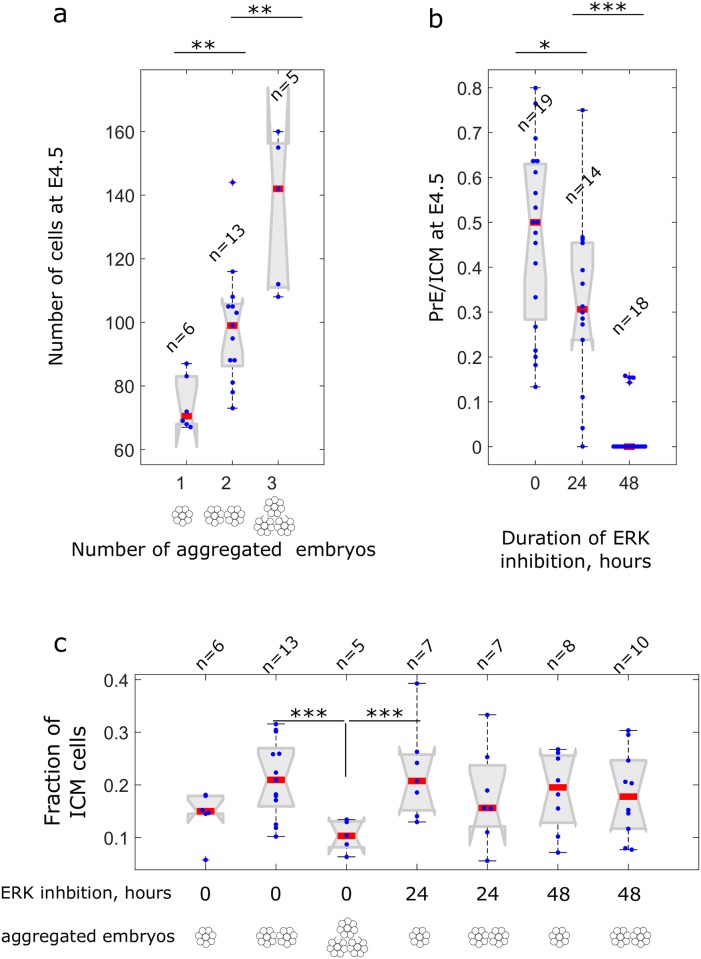
Early mammalian development is both highly regulative and self-organizing. It involves the interplay of cell position, predetermined gene regulatory networks, and environmental interactions to generate the physical arrangement of the blastocyst with precise timing. However, this process occurs in the absence of maternal information and in the presence of transcriptional stochasticity. How does the preimplantation embryo ensure robust, reproducible development in this context? It utilizes a versatile toolbox that includes complex intracellular networks coupled to cell-cell communication, segregation by differential adhesion, and apoptosis. Here, we ask whether a minimal set of developmental rules based on this toolbox is sufficient for successful blastocyst development, and to what extent these rules can explain mutant and experimental phenotypes. We implemented experimentally reported mechanisms for polarity, cell-cell signaling, adhesion, and apoptosis as a set of developmental rules in an agent-based in silico model of physically interacting cells. We find that this model quantitatively reproduces specific mutant phenotypes and provides an explanation for the emergence of heterogeneity without requiring any initial transcriptional variation. It also suggests that a fixed time point for the cells' competence of fibroblast growth factor (FGF)/extracellular signal-regulated kinase (ERK) sets an embryonic clock that enables certain scaling phenomena, a concept that we evaluate quantitatively by manipulating embryos in vitro. Based on these observations, we conclude that the minimal set of rules enables the embryo to experiment with stochastic gene expression and could provide the robustness necessary for the evolutionary diversification of the preimplantation gene regulatory network.


Conflict of interest statement

The authors have declared that no competing interests exist.

Figures

Fig 1
Fig 1. Schematic of the early embryonic development.
The zygote (embryonic day [E] 0.5) undergoes 3 rounds of cleavage divisions, resulting in 8 cells at E2.5. During the next round of division, the blastomeres undergo compaction and become polarized, resulting in the outer trophectoderm (TE) (blue) and the inner cell mass (ICM) (still coexpressing Gata6 and Nanog). The TE expresses the transcription factor caudal-related homeobox 2 (Cdx2). At E3.5, a cavity has formed, and the ICM is positioned at 1 side of the embryo. At this stage, the ICM transcription factors, Gata6 (red) and Nanog (green), are expressed in a mutually exclusive salt-and-pepper pattern in some cells. At E4.5, Nanog- and Gata6-expressing cells have physically segregated into 2 distinct layers and are developmentally restricted to either the epiblast (EPI) or primitive endoderm (PrE). The lower panel shows immunostaining of embryos at different stages during preimplantation development. Color coding is the same as in the panel above. The timing of the 4 different rules that we apply is indicated on top of the diagram.
Fig 2
Fig 2. The overview of the physical interactions between cells.
(a) Polarity is applied to the surface cells at the 16-cell stage. Cells with 4 or fewer neighbors (numbers) acquire polarity (arrows) pointing radially out from the center of the embryo. These cells become the trophectoderm (TE) (blue), while the inner cells with 5 or more neighbors become the undetermined inner cell mass (ICM), coexpressing primitive endoderm (PrE) and epiblast (EPI) markers (white). (b) The 3 types of interaction between 2 TE cells (blue). In case the polarity unit vectors (arrows, ê) are or become antiparallel (*), the repulsion is maximal (dark gray arrows); although, in our simulations, this configuration does not occur. When the polarities are misaligned, the potential is smaller (**), and the attraction is weak (light gray arrows). Finally, when the 2 polarities are parallel, the potential is strong (***), and the cell attraction is strongest. (c) The potentials applied between the different cell types in the model. All cells are illustrated as unit circles, and the potentials are given by Eq 2. (i) Potential between TE cells depends on the orientation of cell polarities (arrows) given by Eq 1. To implement nearest-neighbor interaction potential, TE cells only interact with other TE cells within d < 2.5. (ii) Interaction potential between the TE and ICM cells (PrE cells in red, EPI cells in green, and undetermined ICM cells in white). The range of the potential is limited to about 2 cell diameters (V = 0 for d > 5). PrE progenitors interact weaker with TE cells (S = 0.4) compared to either undetermined ICM or EPI cells (S = 0.6). (iii) Interaction potentials between ICM cells. As in (ii), PrE progenitors interact weaker with any of the ICM cells (S = 0.4) compared to EPI—EPI, EPI—undetermined ICM, or undetermined ICM—undetermined ICM (S = 0.6).
Fig 3
Fig 3. Quantifying the relative contribution of the rules to the robustness of the blastocyst development.
(a) Screenshots from a representative simulation (compare with Fig 1, and see also S1 Movie). At embryonic day (E)3.0, both the configuration before and after adding polarities are shown. Undetermined inner cell mass (ICM) cells are white, trophectoderm (TE) cells are blue, epiblast (EPI) cells are green, and primitive endoderm (PrE) cells are red. (b) Quantification of the developmental success in in silico blastocysts at E4.5. The configuration of the successfully developed blastocyst is shown in the upper-left panel. The occurrence of such a configuration (79% out of 200 simulations in wild type) is color coded by yellow. Perturbing 1 of the 4 rules results in 5 additional configurations (upper panel): no TE formation (blue), EPI only (green), PrE only (red), EPI progenitor within the PrE (red with a green dot), and PrE progenitors found within the EPI (green with a red dot). The “ΔRule 2 low/high FGF” represents cases in which fibroblast growth factor (FGF) signaling is depleted or is in excess FGF4, which corresponds to data in Yamanaka et al. [27] and Saiz et al. [71]. The “ΔRule 2 delay FGF4” represents the case in which FGF signaling was inhibited for 24 hours from E2.5–E3.5, and the inhibitor is removed at E3.5–E4.5. (c) The fraction of ICM cells to the total number of cells at E4.5 in the 7 different types of embryos. (d) The fraction of EPI cells to ICM cells at E4.5. Both in (c) and in (d), experimentally reported numbers are presented in gray, while black error-bars represent numbers predicted by the model. The simulation data can be found in S1 Data. To compare 2D simulations with 3D experimental results, the numbers were rescaled to 3D (see Materials and methods). The simulation results are similar in 3D model (see S2 Movie).
Fig 4
Fig 4. Dividing an embryo in half at 2-, 4-, or 8-cell stage results in a successful blastocyst of half the size.
(a) Screenshots from a simulation with halving at the 8-cell stage (see S8 Movie). (b) Quantification of the developmental success in in silico blastocysts at embryonic day (E) 4.5 after it has been cut in half (notations and color coding are the same as in Fig 3b). (c) The fraction of inner cell mass (ICM) cells to the total number of cells at E4.5 in the 7 different types of embryos. (d) The fraction of epiblast (EPI) cells to ICM cells at E4.5. Both in (c) and (d), the number for unperturbed embryos is in black, and those that were divided in half are shown in gray. The simulation data can be found in S1 Data.
Fig 5
Fig 5. Aggregating 2 embryos at 2-, 4-, or 8-cell stage results in a successful blastocyst of double the size.
(a) Screenshots from a simulation with merging at the 8-cell stage (see S9 Movie). (b) Quantification of the developmental success in in silico blastocysts at embryonic day (E) 4.5 after 2 embryos were aggregated (notations and color coding are the same as in Fig 3b). (c) The fraction of inner cell mass (ICM) cells to the total number of cells at E4.5 in the 7 different types of embryos. (d) The fraction of epiblast (EPI) cells to ICM cells at E4.5. Both in (c) and (d), the number for unperturbed embryos is in black, and the results of aggregation are shown in gray. The simulation data can be found in S1 Data.
Fig 6
Fig 6. Embryo aggregation and ICM scaling in response to extracellular signal—regulated kinase (ERK) delay (inhibitor of Mek [Meki]).
(a) Schematic illustration of the experiment. Embryos were flushed from oviducts and aggregated at the 8-cell stage (embryonic day [E]2.5), then cultured for 56 hours following manipulation. Meki was included for the first 24 hours or the entire experiment. (b) Immunostaining of single embryos at the completion of the experiment. Confocal optical sections through the inner cell mass (ICM) of late blastocysts immunostained for the 3 lineage markers: Nanog (epiblast [Epi]), Gata6 (primitive endoderm [PrE]), and caudal-related homeobox 2 (Cdx2) (trophectoderm [TE]). (c) Immunostaining of aggregated double embryos at the completion of the experiment. (d) Comparison of unaggregated (single), double, or triple aggregations. The length of the bar scale shown is 30 μm in all images. The data can be found in S2 Data.
Fig 7
Fig 7. Single-cell quantification of the extracellular signal—regulated kinase (ERK) delay (inhibitor of Mek [Meki]) and embryo aggregation experiments.
(a) Number of cells at E4.5 in singlets (wild type), doublets (aggregates of 2 morulas), and triplets (aggregates of three morulas). n denotes number of samples. (b) The fraction of primitive endoderm (PrE) cells among inner cell mass (ICM) at embryonic day (E)4.5 in untreated samples and samples with 24- (from E2.5 to E3.5) and with 48- (E2.5 to E4.5) hour ERK inhibition. For each case, data is pooled to include both singlets and doublets. (c) The fraction of ICM cells among all cells in blastocysts at E4.5. Here, the only significantly different value is for triplets; pairwise differences among the rest are nonsignificant (p > 0.05). Blue dots are the data points representing values for single blastocysts, and red lines mark the medians. Statistical significance was tested by nonparametric rank-sum test, see Materials and methods. Differences with p < 0.05 are marked by *, p < 0.01 are marked by **, and p < 0.001 are marked by ***. The data can be found in S2 Data.

Similar articles

Cited by

References

    1. Cockburn K, Rossant J. Making the blastocyst: lessons from the mouse. J Clin Invest. 2010;120: 995–1003. doi: 10.1172/JCI41229 - DOI - PMC - PubMed
    1. Wicklow E, Blij S, Frum T, Hirate Y, Lang RA, Sasaki H, et al. HIPPO Pathway Members Restrict SOX2 to the Inner Cell Mass Where It Promotes ICM Fates in the Mouse Blastocyst. PLoS Genet. 2014;10 doi: 10.1371/journal.pgen.1004618 - DOI - PMC - PubMed
    1. Chazaud C, Yamanaka Y, Pawson T, Rossant J. Early Lineage Segregation between Epiblast and Primitive Endoderm in Mouse Blastocysts through the Grb2-MAPK Pathway. Dev Cell. 2006;10: 615–24. doi: 10.1016/j.devcel.2006.02.020 - DOI - PubMed
    1. Plusa B, Piliszek A, Frankenberg S, Artus J, Hadjantonakis A-K. Distinct sequential cell behaviours direct primitive endoderm formation in the mouse blastocyst. Development. 2008;135: 3081–91. doi: 10.1242/dev.021519 - DOI - PMC - PubMed
    1. Van De Velde H, Cauffman G, Tournaye H, Devroey P, Liebaers I. The four blastomeres of a 4-cell stage human embryo are able to develop individually into blastocysts with inner cell mass and trophectoderm. Hum Reprod. 2008;23: 1742–1747. doi: 10.1093/humrep/den190 - DOI - PubMed

LinkOut - more resources