. 2017 Jul 10;12(7):e0180984.
doi: 10.1371/journal.pone.0180984. eCollection 2017.

Improved high sensitivity screen for Huntington disease using a one-step triplet-primed PCR and melting curve assay

Affiliations

Improved high sensitivity screen for Huntington disease using a one-step triplet-primed PCR and melting curve assay

Mingjue Zhao et al. PLoS One. .

Abstract

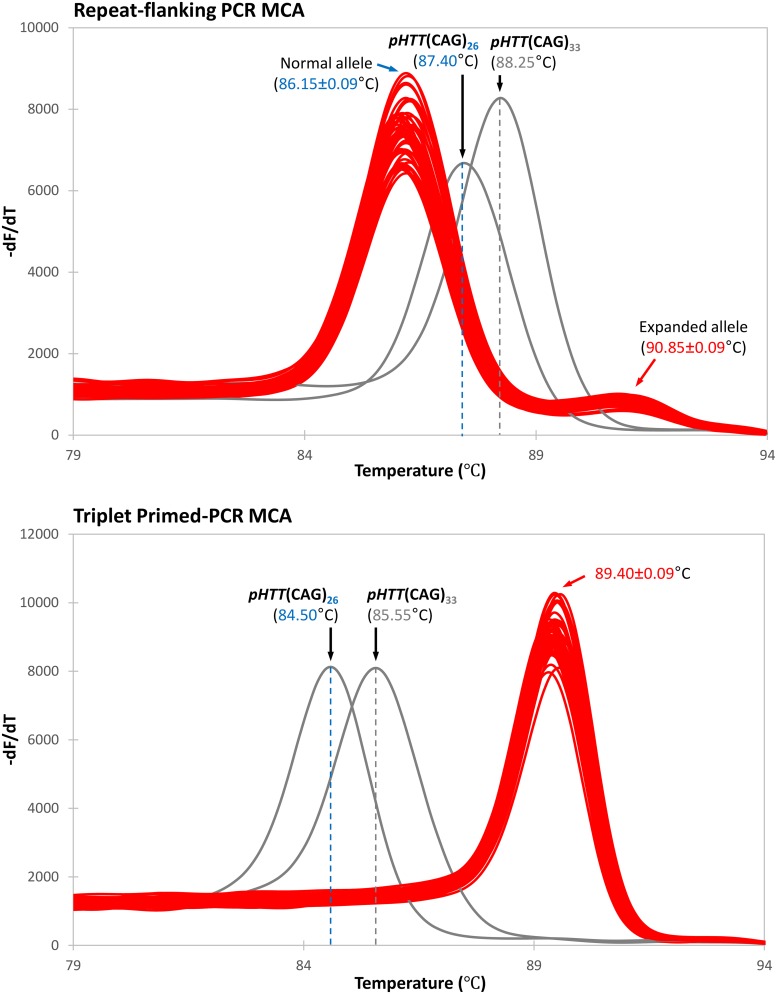
Molecular diagnosis of Huntington disease (HD) is currently performed by fluorescent repeat-flanking or triplet-primed PCR (TP-PCR) with capillary electrophoresis (CE). However, CE requires multiple post-PCR steps and may result in high cost in high-throughput settings. We previously described a cost-effective single-step molecular screening strategy employing the use of melting curve analysis (MCA). However, because it relies on repeat-flanking PCR, its efficiency in detecting expansion mutations decreases with increasing size of the repeat, which could lead to false-negative results. To address this pitfall, we have developed an improved screening assay coupling TP-PCR, which has been shown in CE-based assays to detect all expanded alleles regardless of size, with MCA in a rapid one-step assay. A companion protocol for rapid size confirmation of expansion-positive samples is also described. The assay was optimized on 30 genotype-known DNAs, and two plasmids pHTT(CAG)26 and pHTT(CAG)33 were used to establish the threshold temperatures (TTs) distinguishing normal from expansion-positive samples. In contrast to repeat-flanking PCR MCA, TP-PCR MCA displayed much higher sensitivity for detecting large expansions. All 30 DNAs generated distinct melt peak Tms which correlated well with each sample's larger allele. Normal samples were clearly distinguished from affected samples. The companion sizing protocol accurately sized even the largest expanded allele of ~180 CAGs. Blinded analysis of 69 clinical samples enriched for HD demonstrated 100% assay sensitivity and specificity in sample segregation. The assay targets the HTT CAG repeat specifically, tolerates a wide range of input DNA, and works well using DNA from saliva and buccal swab in addition to blood. Therefore, rapid, accurate, reliable, and high-throughput detection/exclusion of HD can be achieved using this one-step screening assay, at less than half the cost of fluorescent PCR with CE.


Conflict of interest statement

Competing Interests: I have read the journal's policy and the authors of this manuscript have the following competing interests: S.S.C. and C.G.L. are inventors of the TP-PCR and melting curve analysis strategy described in the manuscript. Samuel S. Chong and Caroline G. Lee are holders of the patent ‘Screening method for trinucleotide repeat sequences’, patent No. US9365892B2. However, this does not alter our adherence to PLOS ONE policies on sharing data and materials. Other authors declare no competing interests.

Figures

Fig 1
Fig 1. Comparison of repeat-flanking PCR and TP-PCR melt peaks.
Melt peaks of normal and HD-affected samples are plotted in blue and red lines, respectively, while the pHTT(CAG)26 and pHTT(CAG)33 melt peaks are in black lines. Samples were assayed in triplicate. Top, repeat-flanking PCR MCA of the normal sample produces a single melt peak with a Tm in the normal range, whereas the HD-affected samples produce a dominant melt peak with Tm in the normal range and second melt peak with Tm in the expanded range. Melt peak height of the expanded allele decreases with increasing repeat length, risking an absent expanded allele peak if expansion is very large, with only the normal allele peak present. Bottom, TP-PCR MCA produces a single distinct melt peak in every sample regardless of disease status or length of repeat. The melt peak Tm relative to the threshold temperatures of pHTT(CAG)26 and pHTT(CAG)33 effectively determine normal or HD-affected status of each sample.
Fig 2
Fig 2. Reproducibility of repeat-flanking PCR and TP-PCR melt peaks.
Sample GM09197, which carries an expanded allele of ~180 CAG repeats, was assayed in parallel by repeat-flanking PCR MCA and TP-PCR MCA. Forty-eight replicates of each assay were performed. Melt peaks of replicates are plotted in red, while the melt peaks of the control plasmids pHTT(CAG)26 and pHTT(CAG)33 are in black. Top, using repeat-flanking PCR MCA, the expanded allele melt peak is much weaker than the normal allele and is almost flat, making result interpretation ambiguous. Bottom, using TP-PCR MCA, a highly reproducible and distinct single melt peak is observed, with a Tm clearly in the HD-affected range.
Fig 3
Fig 3. TP-PCR melt peaks and capillary electropherograms of genotype-known CCR (Coriell Cell Repositories) samples.
For all samples, melt peak temperature correlated well with repeat length of the larger allele. Verified or CCR-provided genotypes are indicated at the upper right corner of each electropherogram. Allele sizes determined from TP-PCR capillary electrophoresis are indicated by arrows. Insets show magnified view of expanded alleles. For all samples, the allele sizes and genotypes determined using TP-PCR assay were concordant with the verified allele sizes.
Fig 4
Fig 4. Correlation of TP-PCR melt peak temperature with CAG repeat size of the larger allele.
NL, sample carrying only normal alleles; IA, sample carrying an intermediate allele; EX, sample carrying an expanded allele. A good correlation was observed between the TP-PCR melt peak Tm and the CAG repeat size of the larger allele among the samples, allowing unambiguous discrimination between normal and HD-affected samples.
Fig 5
Fig 5. Normalized melt curves and melt peaks of 30 genotype-known CCR samples.
Samples harboring normal-only, intermediate and expanded alleles are plotted in blue, grey and red lines, respectively. Based on the Tms of the samples relative to the threshold temperatures generated by pHTT(CAG)26 and pHTT(CAG)33, all CCR samples were correctly classified.
Fig 6
Fig 6. TP-PCR MCA profiles of 69 clinical samples enriched for Huntington disease.
Samples harboring normal-only, intermediate and expanded alleles are plotted in blue, grey and red lines, respectively. The Tms and corresponding capillary electropherograms of two normal, two IA and two HD-affected samples are shown. Based on the Tms of the samples relative to the threshold temperatures generated by pHTT(CAG)26 and pHTT(CAG)33, all 69 clinical samples were correctly classified.
Fig 7
Fig 7. Analytic specificity of the TP-PCR MCA assay.
Analytic specificity was assessed by performing the assay on samples carrying premutation or full mutation FMR1 alleles (FXS-PM/FM) or full mutation DMPK alleles (DM1-FM), together with HD-normal and HD-affected samples as controls. The TP-PCR melt peak temperatures of the 4 samples carrying FXS premutations or full mutations, and the 2 samples carrying DM1 expansions, were observed to be lower than the TT of the control plasmid pHTT(CAG)26. The absence of any Tm higher than the TT of pHTT(CAG)33 in these samples indicates the absence of non-specific amplification at the FXS and DM1 repeat loci. These results indicate that the HTT TP-PCR MCA assay is specific for the Huntington disease locus.
Fig 8
Fig 8. Performance characteristics of the TP-PCR MCA assay.
Analytic sensitivity was determined over an input DNA range of 100 pg to 1 μg. Accurate sample classification was achieved using input DNA of 10 ng to 1 μg (a). The assay performed equally well using DNA extracted from blood, buccal swab, or saliva (b). The presence of glycogen of up to 20 μg did not adversely affect the assay (c), but increasing amounts of sodium acetate contamination produced progressively right-shifted melt peak temperatures, and the assay was inhibited at 100 mM concentration (d). All experiments were performed in triplicate.

References

    1. Warby SC, Visscher H, Collins JA, Doty CN, Carter C, Butland SL, et al. HTT haplotypes contribute to differences in Huntington disease prevalence between Europe and East Asia. Eur J Hum Genet. 2011;19(5):561–6. Epub 2011/01/21. doi: 10.1038/ejhg.2010.229 . - DOI - PMC - PubMed
    1. The Huntington's Disease Collaborative Research Group. A novel gene containing a trinucleotide repeat that is expanded and unstable on Huntington's disease chromosomes. Cell. 1993;72(6):971–83. Epub 1993/03/26. 0092-8674(93)90585-E. . - PubMed
    1. Finkbeiner S. Huntington's Disease. Cold Spring Harb Perspect Biol. 2011;3(a007476). Epub 2011/03/29. doi: 10.1101/cshperspect.a007476 . - DOI - PMC - PubMed
    1. Trottier Y, Biancalana V, Mandel JL. Instability of CAG repeats in Huntington's disease: relation to parental transmission and age of onset. J Med Genet. 1994;31(5):377–82. Epub 1994/05/01. . - PMC - PubMed
    1. Semaka A, Collins JA, Hayden MR. Unstable familial transmissions of Huntington disease alleles with 27–35 CAG repeats (intermediate alleles). Am J Med Genet B Neuropsychiatr Genet. 2009;153B(1):314–20. Epub 2009/05/21. doi: 10.1002/ajmg.b.30970 . - DOI - PubMed