

Age dependent differences in the kinetics of γδ T cells after influenza vaccination
- PMID: 28700738
- PMCID: PMC5507438
- DOI: 10.1371/journal.pone.0181161
Age dependent differences in the kinetics of γδ T cells after influenza vaccination
Abstract
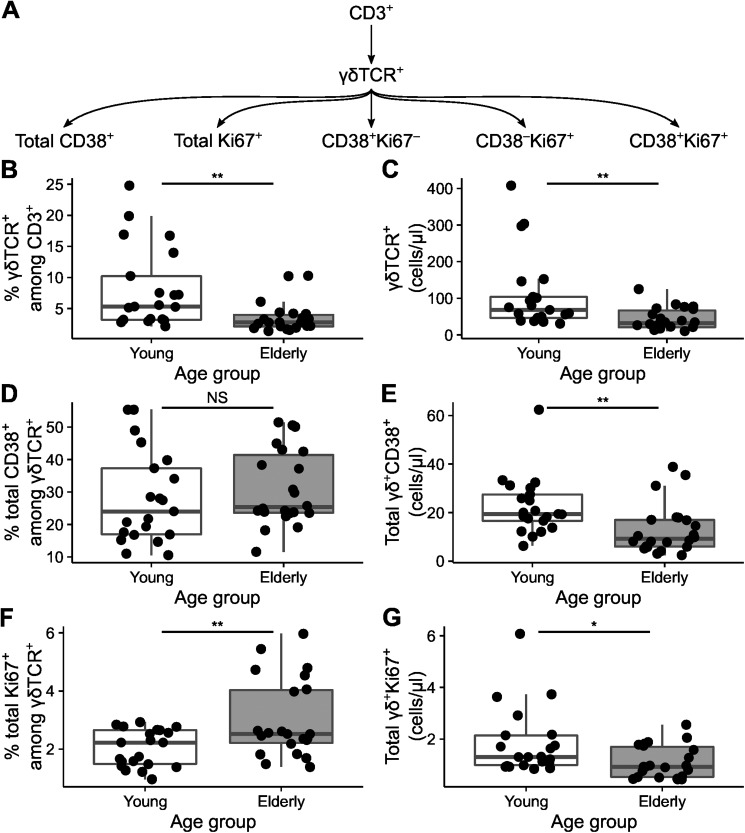
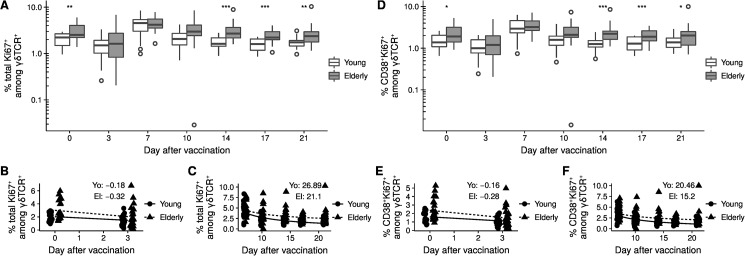
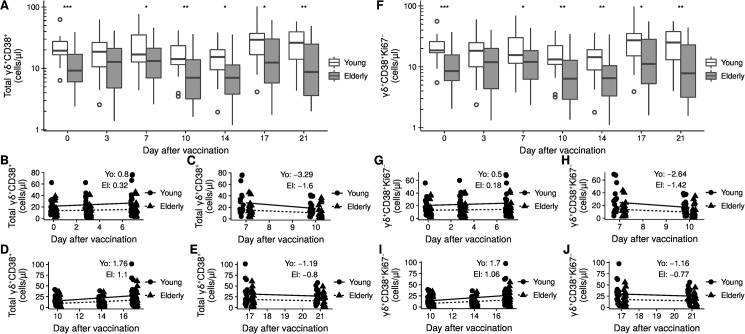
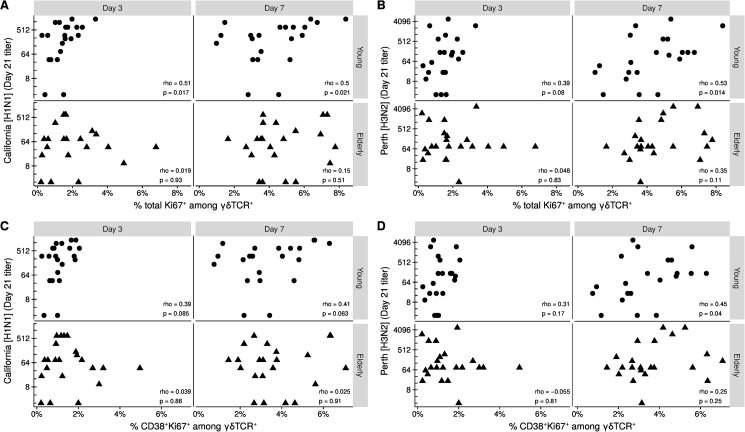
Immunosenescence is a hallmark of the aging immune system and is considered the main cause of a reduced vaccine efficacy in the elderly. Although γδ T cells can become activated by recombinant influenza hemagglutinin, their age-related immunocompetence during a virus-induced immune response has so far not been investigated. In this study we evaluate the kinetics of γδ T cells after vaccination with the trivalent 2011/2012 northern hemisphere seasonal influenza vaccine. We applied multi-parametric flow cytometry to a cohort of 21 young (19-30 years) and 23 elderly (53-67 years) healthy individuals. Activated and proliferating γδ T cells, as identified by CD38 and Ki67 expression, were quantified on the days 0, 3, 7, 10, 14, 17, and 21. We observed a significantly lower number of activated and proliferating γδ T cells at baseline and following vaccination in elderly as compared to young individuals. The kinetics changes of activated γδ T cells were much stronger in the young, while corresponding changes in the elderly occurred slower. In addition, we observed an association between day 21 HAI titers of influenza A and the frequencies of Ki67+ γδ T cells at day 7 in the young. In conclusion, aging induces alterations of the γδ T cell response that might have negative implications for vaccination efficacy.
Conflict of interest statement
Figures
Similar articles
-
Pre-existing immunity and vaccine history determine hemagglutinin-specific CD4 T cell and IgG response following seasonal influenza vaccination.Nat Commun. 2021 Nov 18;12(1):6720. doi: 10.1038/s41467-021-27064-3. Nat Commun. 2021. PMID: 34795301 Free PMC article.
-
The impact of immunosenescence on humoral immune response variation after influenza A/H1N1 vaccination in older subjects.PLoS One. 2015 Mar 27;10(3):e0122282. doi: 10.1371/journal.pone.0122282. eCollection 2015. PLoS One. 2015. PMID: 25816015 Free PMC article.
-
Frequencies of peripheral immune cells in older adults following seasonal influenza vaccination with an adjuvanted vaccine.Vaccine. 2017 Aug 3;35(34):4330-4338. doi: 10.1016/j.vaccine.2017.06.082. Epub 2017 Jul 6. Vaccine. 2017. PMID: 28689651 Clinical Trial.
-
Aging and influenza vaccine-induced immunity.Cell Immunol. 2020 Feb;348:103998. doi: 10.1016/j.cellimm.2019.103998. Epub 2019 Oct 31. Cell Immunol. 2020. PMID: 31733824 Review.
-
Role of γδ T cells in controlling viral infections with a focus on influenza virus: implications for designing novel therapeutic approaches.Virol J. 2020 Nov 12;17(1):174. doi: 10.1186/s12985-020-01449-0. Virol J. 2020. PMID: 33183352 Free PMC article. Review.
Cited by
-
Immune Cell Number, Phenotype, and Function in the Elderly with Sepsis.Aging Dis. 2021 Feb 1;12(1):277-296. doi: 10.14336/AD.2020.0627. eCollection 2021 Feb. Aging Dis. 2021. PMID: 33532141 Free PMC article. Review.
-
Protective Role of γδ T Cells in Different Pathogen Infections and Its Potential Clinical Application.J Immunol Res. 2018 Jul 10;2018:5081634. doi: 10.1155/2018/5081634. eCollection 2018. J Immunol Res. 2018. PMID: 30116753 Free PMC article. Review.
-
The Aging of γδ T Cells.Cells. 2020 May 9;9(5):1181. doi: 10.3390/cells9051181. Cells. 2020. PMID: 32397491 Free PMC article. Review.
-
Propionate supplementation promotes the expansion of peripheral regulatory T-Cells in patients with end-stage renal disease.J Nephrol. 2020 Aug;33(4):817-827. doi: 10.1007/s40620-019-00694-z. Epub 2020 Mar 6. J Nephrol. 2020. PMID: 32144645 Free PMC article.
-
Distinct phenotype and function of circulating Vδ1+ and Vδ2+ γδT-cells in acute and chronic hepatitis B.PLoS Pathog. 2019 Apr 18;15(4):e1007715. doi: 10.1371/journal.ppat.1007715. eCollection 2019 Apr. PLoS Pathog. 2019. PMID: 30998783 Free PMC article.
References
-
- Preaud E, Durand L, Macabeo B, Farkas N, Sloesen B, Palache A, et al. Annual public health and economic benefits of seasonal influenza vaccination: a European estimate. BMC Public Health. 2014;14: 813 doi: 10.1186/1471-2458-14-813 - DOI - PMC - PubMed
-
- Osterholm MT, Kelley NS, Sommer A, Belongia EA. Efficacy and effectiveness of influenza vaccines: a systematic review and meta-analysis. Lancet Infect Dis. 2012;12: 36–44. doi: 10.1016/S1473-3099(11)70295-X - DOI - PubMed
-
- Holtmeier W, Kabelitz D. gammadelta T cells link innate and adaptive immune responses. Chem Immunol Allergy. 2005;86: 151–183. doi: 10.1159/000086659 - DOI - PubMed
-
- Chien Y, Meyer C, Bonneville M. γδ T cells: first line of defense and beyond. Annu Rev Immunol. 2014;32: 121–155. doi: 10.1146/annurev-immunol-032713-120216 - DOI - PubMed
-
- Wu Y-L, Ding Y-P, Tanaka Y, Shen L-W, Wei C-H, Minato N, et al. γδ T cells and their potential for immunotherapy. Int J Biol Sci. 2014;10: 119–135. doi: 10.7150/ijbs.7823 - DOI - PMC - PubMed
MeSH terms
Substances
LinkOut - more resources
Full Text Sources
Other Literature Sources
Medical
Research Materials
