. 2017 Jul 11;113(1):120-131.
doi: 10.1016/j.bpj.2017.05.023.

Catch Bonds at T Cell Interfaces: Impact of Surface Reorganization and Membrane Fluctuations

Affiliations

Catch Bonds at T Cell Interfaces: Impact of Surface Reorganization and Membrane Fluctuations

Robert H Pullen 3rd et al. Biophys J. .

Abstract

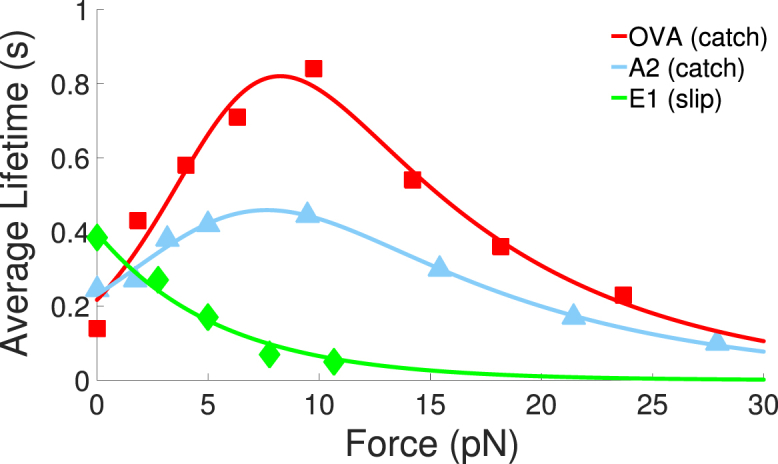
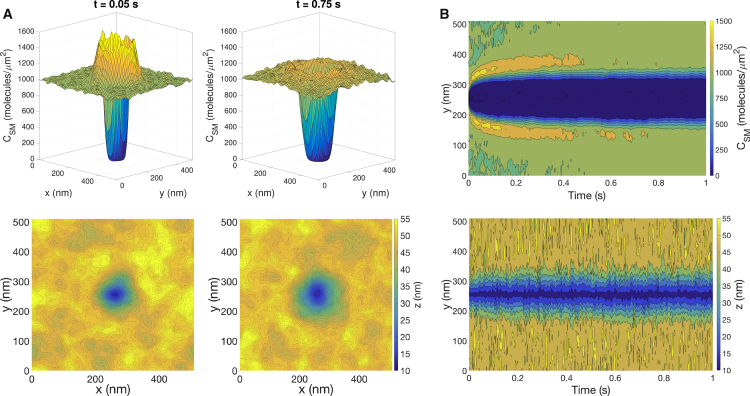
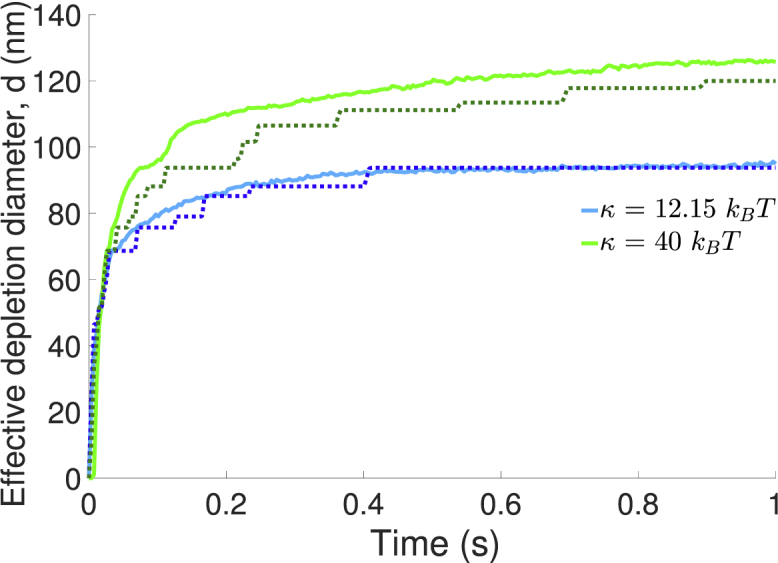
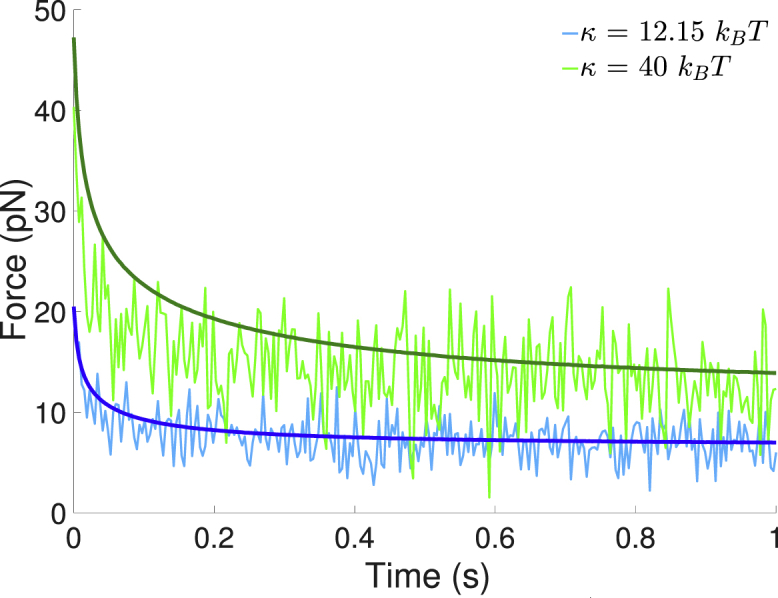
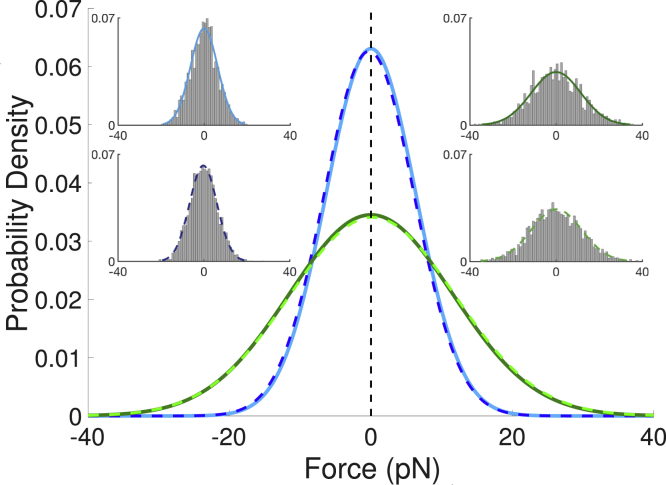
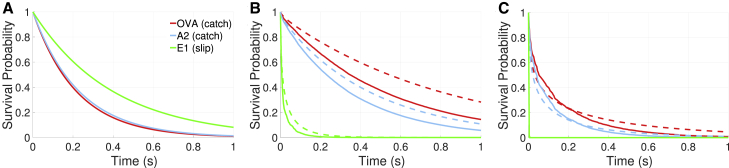
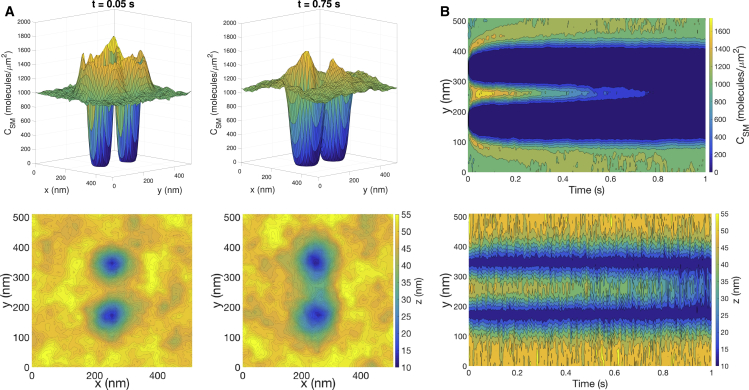
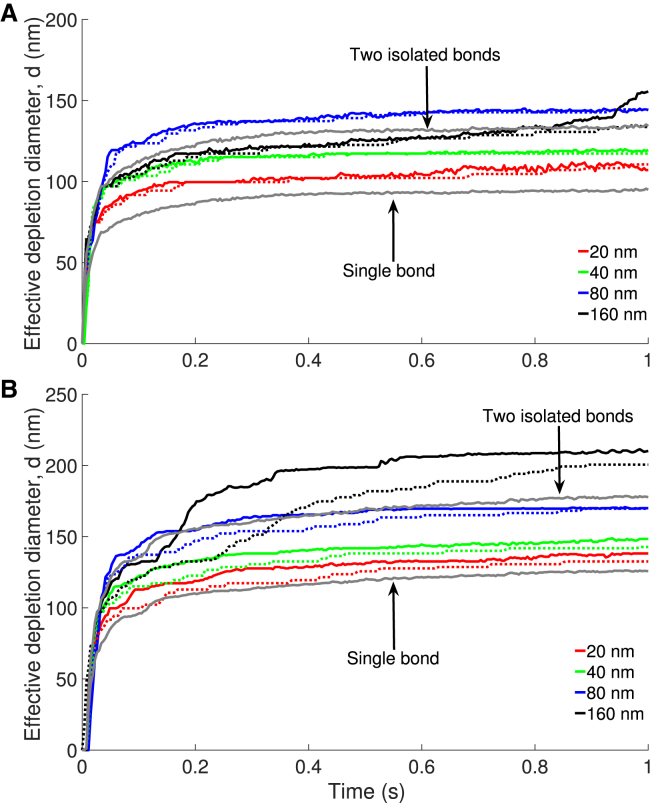
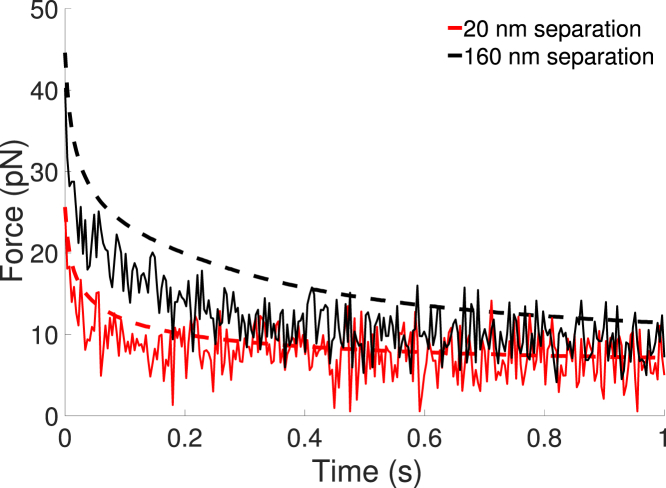
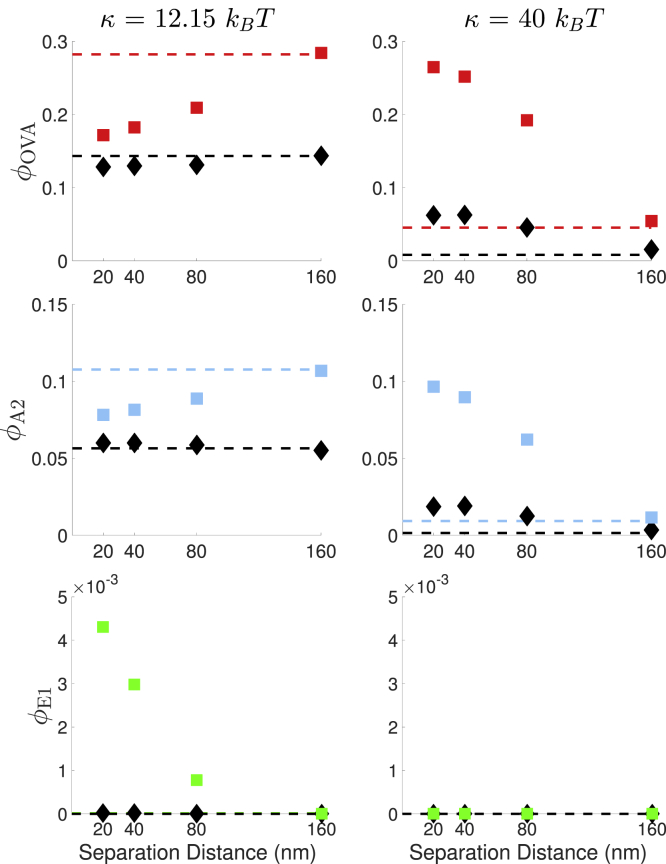
Catch bonds are characterized by average lifetimes that initially increase with increasing tensile force. Recently, they have been implicated in T cell activation, where small numbers of antigenic receptor-ligand bonds at a cell-cell interface can stimulate a T cell. Here, we use computational methods to investigate small numbers of bonds at the interface between two membranes. We characterize the time-dependent forces on the bonds in response to changes in the membrane shape and the organization of other surface molecules. We then determine the distributions of bond lifetimes using recent force-dependent lifetime data for T cell receptors bound to various ligands. Strong agonists, which exhibit catch bond behavior, are markedly more likely to remain intact than an antagonist whose average lifetime decreases with increasing force. Thermal fluctuations of the membrane shape enhance the decay of the average force on a bond, but also lead to fluctuations of the force. These fluctuations promote bond rupture, but the effect is buffered by catch bonds. When more than one bond is present, the bonds experience reduced average forces that depend on their relative positions, leading to changes in bond lifetimes. Our results highlight the importance of force-dependent binding kinetics when bonds experience time-dependent and fluctuating forces, as well as potential consequences of collective bond behavior relevant to T cell activation.


Figures

Figure 1
Figure 1
Force-dependent lifetime data (points) for the OT1 TCR bound to three different ligands. Data points are from Liu et al. (11). OVA and A2 exhibit catch-bond behavior. Solid lines are nonlinear least squares fits to the data using Eq. 1 for E1 and Eq. 2 for OVA and A2. To see this figure in color, go online.
Figure 2
Figure 2
Characteristic response to the formation of a bond (with thermal fluctuations). (A) Shown are snapshots of the concentration of long surface molecules (top row) and the intermembrane distance (bottom row) with κ = 12.15 kBT. Each column corresponds to a different time point. The bond is located at the center of the domain. (B) Kymographs of CSM and z from a one-dimensional slice containing the bond are shown. To see this figure in color, go online.
Figure 3
Figure 3
Time evolution of the effective diameter (d) of the depletion zone. Data is averaged over 10 independent trajectories for each condition. Simulations with thermal fluctuations (solid lines) lead to a more rapid expansion of the depletion zone than simulations without thermal fluctuations (dashed lines). Increasing the membrane stiffness, κ, promotes the formation of a larger depletion zone. To see this figure in color, go online.
Figure 4
Figure 4
Average bond tension as a function of time. The average tension at each time point is calculated by averaging the tension from 10 independent simulation trajectories with κ = 12.15 kBT (blue) and κ = 40 kBT (green). The cases without fluctuations are shown in darker shades. To see this figure in color, go online.
Figure 5
Figure 5
Gaussian fits of the probability densities for the mean-centered forces obtained from simulations with and without long surface molecules present. Results are shown for κ = 12.15 kBT (blue) and κ = 40 kBT (green). Histograms of mean-centered force data are included as insets for cases with (solid) and without (dashed) long surface molecules. Each condition uses data from 10 trajectories, with forces for t > 0.5 s used when long surface molecules are present. To see this figure in color, go online.
Figure 6
Figure 6
Survival probabilities for different ligands. Each survival probability curve is calculated by averaging 10 independent survival curves. Different ligands (OVA, A2, and E1) are considered with (solid) and without (dashed) thermal fluctuations. (A) For survival probabilities with zero applied force, the slip bond (E1) exhibits the longest average lifetime. (B) Shown here are survival probabilities with κ = 12.15 kBT. (C) Shown here are survival probabilities with κ = 40 kBT. To see this figure in color, go online.
Figure 7
Figure 7
Characteristic response to the formation of two bonds separated by 160 nm (with thermal fluctuations). (A) Shown are snapshots of CSM (top row) and z (bottom row) with κ = 12.15 kBT. Each column corresponds to a different time point. (B) Kymographs of CSM and z from a one-dimensional slice containing both bonds are shown. To see this figure in color, go online.
Figure 8
Figure 8
Time evolution of the effective diameter (d) of the depletion zone for two bonds separated by different distances. Data is averaged over 10 independent trajectories for each condition. Results with (solid) and without (dashed) thermal fluctuations are shown for (A) κ = 12.15 kBT and (B) κ = 40 kBT. To see this figure in color, go online.
Figure 9
Figure 9
Average force on a bond when a second bond is a fixed distance away. Results with (solid) and without (dashed) thermal fluctuations are shown for κ = 40 kBT. For each case, data is averaged over 10 independent trajectories. The average bond tension increases with increased separation. To see this figure in color, go online.
Figure 10
Figure 10
Fraction of bonds that remain at t = 1 (ϕ) as a function of bond separation distance. Rows correspond to different ligands (OVA, A2, and E1) and columns correspond to different values of κ. Results with (diamonds) and without (squares) fluctuations are shown. For comparison, the value of ϕ corresponding to a single bond is plotted as a horizontal line. It is similar to the value of ϕ for a bond when another is 160 nm away. For every condition tested, the catch bonds have a larger binding fraction than the slip bond. To see this figure in color, go online.

Similar articles

Cited by

References

    1. Hivroz C., Saitakis M. Biophysical aspects of T lymphocyte activation at the immune synapse. Front. Immunol. 2016;7:46. - PMC - PubMed
    1. Dembo M., Torney D.C., Hammer D. The reaction-limited kinetics of membrane-to-surface adhesion and detachment. Proc. R. Soc. Lond. B Biol. Sci. 1988;234:55–83. - PubMed
    1. Thomas W.E., Vogel V., Sokurenko E. Biophysics of catch bonds. Annu. Rev. Biophys. 2008;37:399–416. - PubMed
    1. Bell G.I. Models for the specific adhesion of cells to cells. Science. 1978;200:618–627. - PubMed
    1. Marshall B.T., Long M., Zhu C. Direct observation of catch bonds involving cell-adhesion molecules. Nature. 2003;423:190–193. - PubMed

Substances

LinkOut - more resources