

Meal Frequency and Timing Are Associated with Changes in Body Mass Index in Adventist Health Study 2
- PMID: 28701389
- PMCID: PMC5572489
- DOI: 10.3945/jn.116.244749
Meal Frequency and Timing Are Associated with Changes in Body Mass Index in Adventist Health Study 2
Abstract
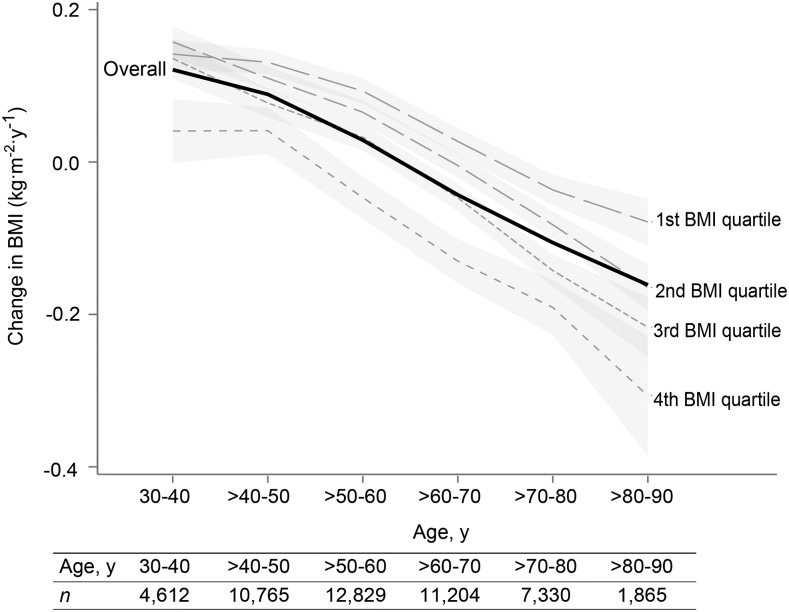
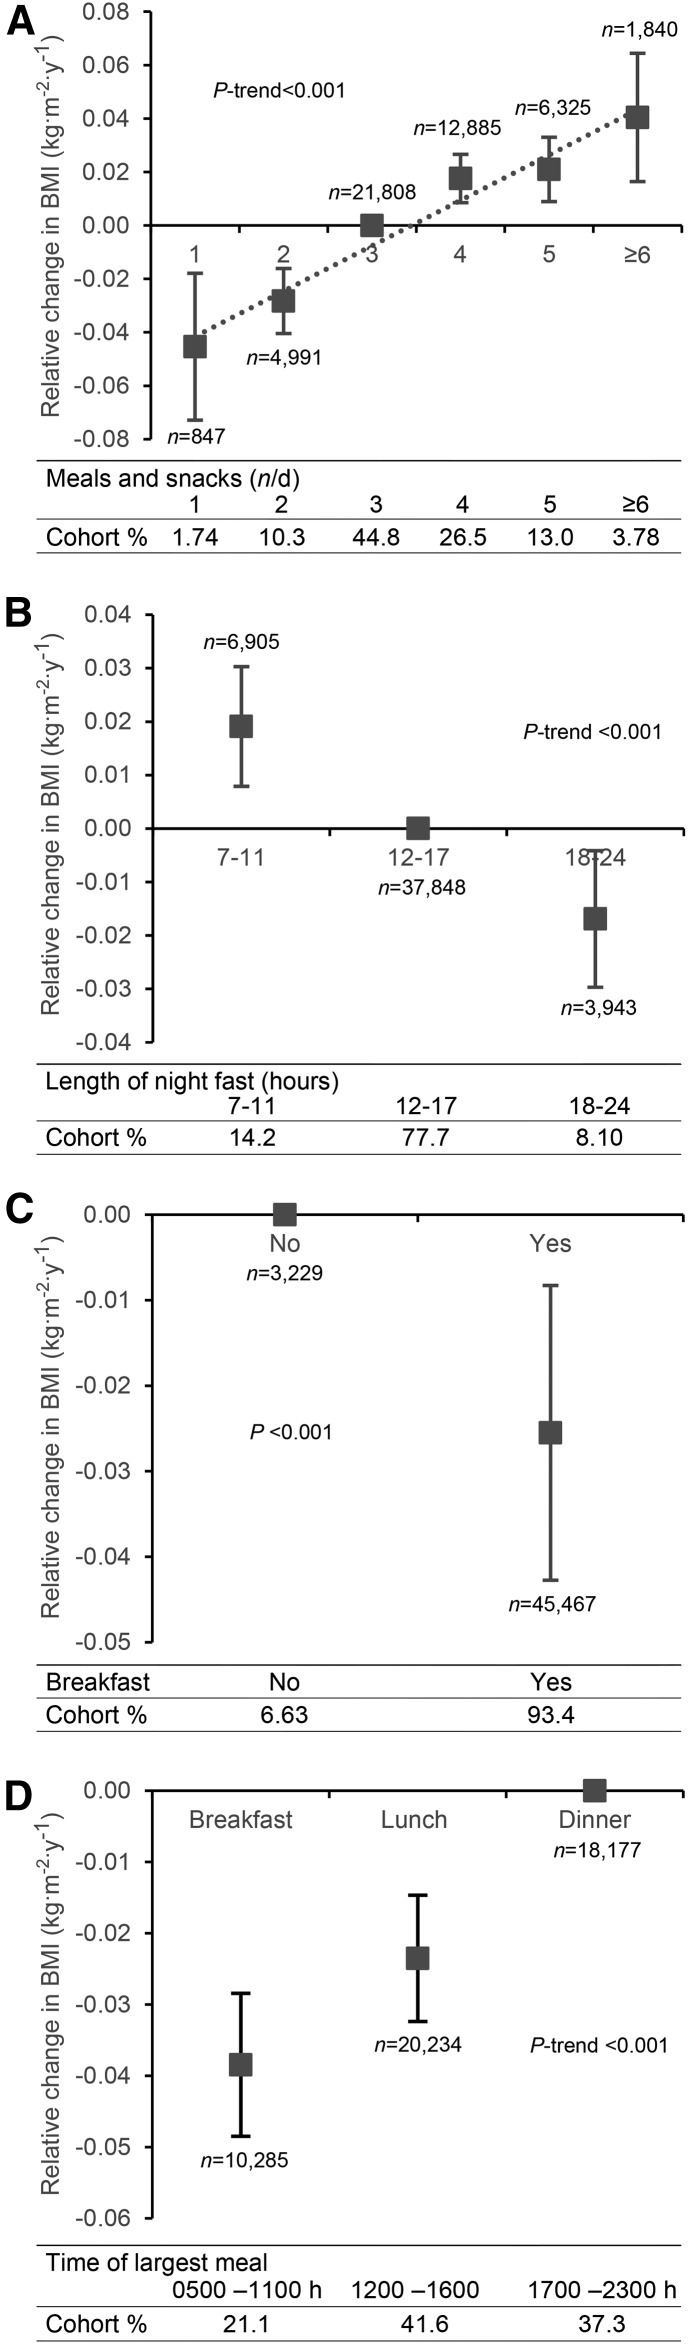
Background: Scientific evidence for the optimal number, timing, and size of meals is lacking.Objective: We investigated the relation between meal frequency and timing and changes in body mass index (BMI) in the Adventist Health Study 2 (AHS-2), a relatively healthy North American cohort.Methods: The analysis used data from 50,660 adult members aged ≥30 y of Seventh-day Adventist churches in the United States and Canada (mean ± SD follow-up: 7.42 ± 1.23 y). The number of meals per day, length of overnight fast, consumption of breakfast, and timing of the largest meal were exposure variables. The primary outcome was change in BMI per year. Linear regression analyses (stratified on baseline BMI) were adjusted for important demographic and lifestyle factors.Results: Subjects who ate 1 or 2 meals/d had a reduction in BMI per year (in kg · m-2 · y-1) (-0.035; 95% CI: -0.065, -0.004 and -0.029; 95% CI: -0.041, -0.017, respectively) compared with those who ate 3 meals/d. On the other hand, eating >3 meals/d (snacking) was associated with a relative increase in BMI (P < 0.001). Correspondingly, the BMI of subjects who had a long overnight fast (≥18 h) decreased compared with those who had a medium overnight fast (12-17 h) (P < 0.001). Breakfast eaters (-0.029; 95% CI: -0.047, -0.012; P < 0.001) experienced a decreased BMI compared with breakfast skippers. Relative to subjects who ate their largest meal at dinner, those who consumed breakfast as the largest meal experienced a significant decrease in BMI (-0.038; 95% CI: -0.048, -0.028), and those who consumed a big lunch experienced a smaller but still significant decrease in BMI than did those who ate their largest meal at dinner.Conclusions: Our results suggest that in relatively healthy adults, eating less frequently, no snacking, consuming breakfast, and eating the largest meal in the morning may be effective methods for preventing long-term weight gain. Eating breakfast and lunch 5-6 h apart and making the overnight fast last 18-19 h may be a useful practical strategy.
Keywords: Adventist Health Study 2; BMI; meal frequency; meal timing; weight control.
© 2017 American Society for Nutrition.
Conflict of interest statement
Author disclosures: HK, JIL, AM, MH, and GEF, no conflicts of interest.
Figures
References
-
- Visscher TL, Seidell JC. The public health impact of obesity. Annu Rev Public Health 2001;22:355–75. - PubMed
-
- Roos V, Elmstahl S, Ingelsson E, Sundstrom J, Arnlov J, Lind L. Metabolic syndrome development during aging with special reference to obesity without the metabolic syndrome. Metab Syndr Relat Disord 2017;15:36–43. - PubMed
-
- Speechly DP, Buffenstein R. Greater appetite control associated with an increased frequency of eating in lean males. Appetite 1999;33:285–97. - PubMed
-
- Keast DR, Nicklas TA, O’Neil CE. Snacking is associated with reduced risk of overweight and reduced abdominal obesity in adolescents: National Health and Nutrition Examination Survey (NHANES) 1999–2004. Am J Clin Nutr 2010;92:428–35. - PubMed
Publication types
MeSH terms
Grants and funding
LinkOut - more resources
Full Text Sources
Other Literature Sources
Medical
Research Materials
