. 2017 Dec;28(12):3490-3503.
doi: 10.1681/ASN.2016121351. Epub 2017 Jul 12.

Blocking TGF- β and β-Catenin Epithelial Crosstalk Exacerbates CKD

Affiliations

Blocking TGF- β and β-Catenin Epithelial Crosstalk Exacerbates CKD

Stellor Nlandu-Khodo et al. J Am Soc Nephrol. 2017 Dec.

Abstract

The TGF-β and Wnt/β-catenin pathways have important roles in modulating CKD, but how these growth factors affect the epithelial response to CKD is not well studied. TGF-β has strong profibrotic effects, but this pleiotropic factor has many different cellular effects depending on the target cell type. To investigate how TGF-β signaling in the proximal tubule, a key target and mediator of CKD, alters the response to CKD, we injured mice lacking the TGF-β type 2 receptor specifically in this epithelial segment. Compared with littermate controls, mice lacking the proximal tubular TGF-β receptor had significantly increased tubular injury and tubulointerstitial fibrosis in two different models of CKD. RNA sequencing indicated that deleting the TGF-β receptor in proximal tubule cells modulated many growth factor pathways, but Wnt/β-catenin signaling was the pathway most affected. We validated that deleting the proximal tubular TGF-β receptor impaired β-catenin activity in vitro and in vivo Genetically restoring β-catenin activity in proximal tubules lacking the TGF-β receptor dramatically improved the tubular response to CKD in mice. Deleting the TGF-β receptor alters many growth factors, and therefore, this ameliorated response may be a direct effect of β-catenin activity or an indirect effect of β-catenin interacting with other growth factors. In conclusion, blocking TGF-β and β-catenin crosstalk in proximal tubules exacerbates tubular injury in two models of CKD.

Keywords: chronic kidney disease; fibrosis; proximal tubule; renal epithelial cell.


Figures

Figure 1.
Figure 1.
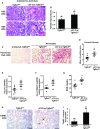
γGT-Cre;Tgfbr2fl/fl mice had increased tubular injury and TIF at 6 weeks after aristolochic acid injections. (A) Hematoxylin and eosin (H&E) staining was performed on kidneys from injured mice with tubular dilation, epithelial flattening, and cast formation (black arrow). (B) Quantification of tubular injury (Concise Methods). (C and D) To detect collagens, Picrosirius Red staining (Concise Methods) was quantified. (E) Collagen I production was assessed by qPCR of COL1A1 in injured renal cortices. (F) KIM-1 transcript levels were also quantified from renal cortices using qPCR. (G) Plasma BUN was measured from mice 6 weeks after injury. (H) TUNEL staining showed apoptotic nuclei (black arrows) in cortical tubules, which were (I) quantified with the number of mice in parentheses. Data are shown as means±SEM, with the number of mice in parentheses. Scale bars, 100 μM in A, upper panel; 50 μM in A, lower panel, C, and H. *P<0.05; **P<0.01. AA, aristolochic acid; GAPDH, glyceraldehyde 3-phosphate dehydrogenase; HPF, high-powered field.
Figure 2.
Figure 2.
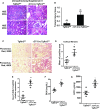
The conditional knockout mice also sustained greater tubular injury and TIF after injury by uninephrectomy/angiotensin II. (A) Renal cortices 4 weeks after UniNx/AngII infusions show increased tubular damage in the γGT-Cre;Tgfbr2fl/fl mice compared with floxed controls, which was (B) scored and quantified. (C and D) Picrosirius Red staining is shown, with quantification of the positive area. (E) KIM-1 expression was quantified in injured renal cortices using qPCR. (F) BUN was measured in plasma from mice 4 weeks after uninephrectomy and placement of angiotensin II minipumps. (G) The albumin-to-creatinine ratio (ACR) was quantified from urine during the fourth week of injury (Concise Methods). Data are shown as means±SEM, with the number of mice in parentheses. Scale bars, 100 μM in A, upper panel and C, upper panel; 50 μM in A, lower panel and C, lower panel. *P<0.05; **P<0.01. GAPDH, glyceraldehyde 3-phosphate dehydrogenase; H&E, hematoxylin and eosin.
Figure 3.
Figure 3.
β-Catenin activity was reduced in TβRII−/− PT cells and renal cortices of γGT-Cre;Tgfbr2fl/fl mice compared with floxed controls. (A) RNAseq was performed on TβRIIfl/fl and TβRII−/− inner medullary collecting duct cells (Concise Methods), and Wnt/β-catenin was the pathway most affected by deleting TβRII as assessed by PANTHER pathway analysis of statistically significant changes in gene expression. Supplemental Table 1 has a complete listing of pathways. (B) Axin2, a target gene of Wnt/β-catenin signaling, was measured in PT cells with or without TβRII grown in complete PT media using qPCR. Data are presented as means of three separate experiments ±SEM. (C) γGT-Cre;Tgfbr2fl/fl and floxed control mice were injured by aristolochic acid as described in Concise Methods, except that they were euthanized 3 weeks after the last injection. Nuclear and cytosolic fractions of renal cortices were isolated using ultracentrifugation (Concise Methods) and immunoblotted for β-catenin using α-tubulin and histone H3 as loading controls for the cytosolic and nuclear compartments, respectively. (D) Nuclear β-catenin from the injured renal cortices was quantified, with the number of mice in parentheses and shown as means±SEM. *P<0.05; ***P<0.005. GAPDH, glyceraldehyde 3-phosphate dehydrogenase.
Figure 4.
Figure 4.
TGF-β signaling increases β-catenin nuclear localization and responsiveness to Wnt ligands. (A) PT cells were stimulated with TGF-β1 (2 ng/ml) for varying time points, and whole-cell lysates were immunoblotted for β-catenin and α-tubulin (loading control) and (B) quantified. (B and D) Quantification for β-catenin was normalized to that of untreated TβRIIflox/flox PT cells. (C) PT cells were stimulated with TGF-β1 (2 ng/ml) for varying amounts of time; then, cytoplasmic and nuclear fractions were isolated and immunoblotted for β-catenin, with α-tubulin and histone H3 as loading controls for the cytoplasmic and nuclear fractions, respectively. (D) Quantification of nuclear β-catenin (normalized to histone H3) is shown. (E) PT cells were incubated with Wnt3a (20 ng/ml) for 24 hours or dilution buffer, and then, levels of Axin2 transcripts were measured by qPCR. (F) PT cells were treated with either the GSK-3 inhibitor BIO (500 nM) or equivalent volumes of DMSO for 24 hours before measuring Axin2 by qPCR. Data are the means of three experiments ±SEM. *P<0.05; **P<0.01; ***P<0.005. GAPDH, glyceraldehyde 3-phosphate dehydrogenase.
Figure 5.
Figure 5.
Increasing β-catenin activity in TβRII−/− PT cells reduces aristolochic acid–induced G2/M arrest and apoptosis. (A) PT cells were incubated for 7 days with either 20 μM aristolochic acid (Concise Methods) or PT complete media (control), and then, TGF-β1 mRNA expression was measured by qPCR. (B) PT cells with or without 20 μM aristolochic acid for 2 days underwent cell cycle modeling with DAPI by flow cytometry, and (C) the percentage of cells in G2/M is quantified. (D) PT cells treated with aristolochic acid (20 μM) for 7 days had CTGF mRNA measured by qPCR and expressed as a fold increase from baseline (no aristolochic acid treatment). (E) TβRII−/− PT cells were treated with the GSK inhibitor BIO (500 ng/ml) or equivalent amounts of DMSO with or without aristolochic acid (20 μM) (Concise Methods) for cell cycle analysis using flow cytometry, and G2/M arrest was quantified. (F) TβRII−/− PT cells were also treated with or without BIO and aristolochic acid for 7 days, and CTGF mRNA was quantified with qPCR. (G) PT cells were treated with varying amounts of aristolochic acid (0, 10, and 20 μM) for 7 days, and apoptosis was detected in cell lysates by immunoblotting for cleaved caspase 3, with α-tubulin as a loading control. (H) Expression of cleaved caspase 3 was quantified and normalized to that of uninjured TβRIIflox/flox PT cells. (I) PT cells were treated with aristolochic acid plus either BIO (500 ng/ml) or DMSO for 7 days. (I and J) Cell lysates were immunoblotted for cleaved caspase 3 and α-tubulin and quantified. Data are the means of three experiments ±SEM. *P<0.05; **P<0.01; ***P<0.005. AA, aristolochic acid; GAPDH, glyceraldehyde 3-phosphate dehydrogenase; CTGF, connective tissue growth factor; DAPI, 4′,6-diamidino-2-phenylindole.
Figure 6.
Figure 6.
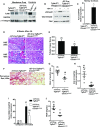
γGT-Cre;Tgfbr2fl/fl;Ctnnb1(ex3)fl/fl mice have reduced tubular injury and preserved renal function compared with γGT-Cre;Tgfbr2fl/fl mice after aristolochic acid–induced chronic injury. (A) Membrane preparations of uninjured renal cortices were immunoblotted with TβRII to verify recombination in γGT-Cre;Tgfbr2fl/fl;Ctnnb1(ex3)fl/fl mice, with β1-integrin as a loading control for membrane fractions. TβRIIflox/flox and TβRII−/− PT whole-cell lysates were used as controls, and a white line separates lanes that were moved within the same immunoblot. (B) Primary PTs (Concise Methods) were made from γGT-Cre;Tgfbr2fl/fl;Ctnnb1(ex3)fl/fl mice and floxed controls and stimulated with TGF-β1 (2 ng/ml) for 20 minutes, and cell lysates were immunoblotted for pSmad2 to indicate lack of responsiveness to TGF-β in γGT-Cre;Tgfbr2fl/fl;Ctnnb1(ex3)fl/fl mice. (C) To assess recombination at the Ctnnb1 locus, RNA was isolated from uninjured renal cortices, and Axin2 was measured by qPCR, with the means of three animals per genotype shown ±SEM. (D) Hematoxylin and eosin (H&E) sections from γGT-Cre;Tgfbr2fl/fl;Ctnnb1(ex3)fl/fl and γGT-Cre;Tgfbr2fl/fl mice 6 weeks after aristolochic acid injections are shown. (E) Tubular injury after aristolochic acid was quantified and expressed as means±SEM with five mice per genotype. (F and G) Picrosirius Red staining is shown with quantification of the positive area. (H) Collagen I mRNA was measured by qPCR from renal cortices. (I) To detect KIM-1 in injured kidneys, qPCR was performed for Havcr1 (KIM-1 gene) in renal cortices and shown as means±SEM, with number of mice in parentheses. (J) Plasma BUN is also shown as mean±SEM, with number of mice in parentheses. Scale bars, 100 μM in D, upper panel; 50 μM in D, lower panel and F. *P<0.05; **P<0.01; ***P<0.005. AA, aristolochic acid; GAPDH, glyceraldehyde 3-phosphate dehydrogenase.

Comment in

References

    1. Wrana JL, Attisano L, Cárcamo J, Zentella A, Doody J, Laiho M, Wang XF, Massagué J: TGF beta signals through a heteromeric protein kinase receptor complex. Cell 71: 1003–1014, 1992 - PubMed
    1. Yamashita H, ten Dijke P, Franzén P, Miyazono K, Heldin CH: Formation of hetero-oligomeric complexes of type I and type II receptors for transforming growth factor-beta. J Biol Chem 269: 20172–20178, 1994 - PubMed
    1. Hayashida T, Decaestecker M, Schnaper HW: Cross-talk between ERK MAP kinase and Smad signaling pathways enhances TGF-beta-dependent responses in human mesangial cells. FASEB J 17: 1576–1578, 2003 - PubMed
    1. Wang S, Wilkes MC, Leof EB, Hirschberg R: Noncanonical TGF-beta pathways, mTORC1 and Abl, in renal interstitial fibrogenesis. Am J Physiol Renal Physiol 298: F142–F149, 2010 - PMC - PubMed
    1. Nlandu Khodo S, Neelisetty S, Woodbury L, Green E, Harris RC, Zent R, Gewin L: Deleting the TGF-beta receptor in proximal tubules impairs HGF signaling. Am J Physiol Renal Physiol 310: F499–F510, 2016 - PMC - PubMed

MeSH terms