

Comparison among the Quantification of Bacterial Pathogens by qPCR, dPCR, and Cultural Methods
- PMID: 28702010
- PMCID: PMC5487435
- DOI: 10.3389/fmicb.2017.01174
Comparison among the Quantification of Bacterial Pathogens by qPCR, dPCR, and Cultural Methods
Abstract
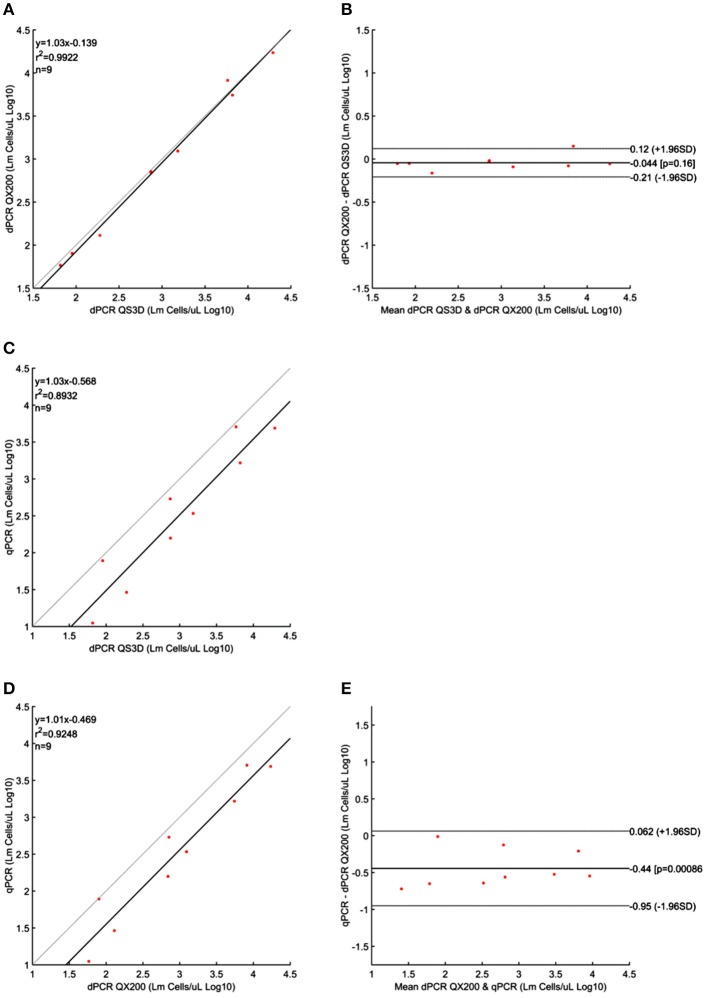
The demand for rapid methods for the quantification of pathogens is increasing. Among these methods, those based on nucleic acids amplification (quantitative PCRs) are the most widespread worldwide. Together with the qPCR, a new approach named digital PCR (dPCR), has rapidly gained importance. The aim of our study was to compare the results obtained using two different dPCR systems and one qPCR in the quantification of three different bacterial pathogens: Listeria monocytogenes, Francisella tularensis, and Mycobacterium avium subsp. paratuberculosis. For this purpose, three pre-existing qPCRs were used, while the same primers and probes, as well as PCR conditions, were transferred to two different dPCR systems: the QX200 (Bio-Rad) and the Quant Studio 3D (Applied Biosystems). The limits of detection and limits of quantification for all pathogens, and all PCR approaches applied, were determined using genomic pure DNAs. The quantification of unknown decimal suspensions of the three bacteria obtained by the three different PCR approaches was compared through the Linear Regression and Bland and Altman analyses. Our results suggest that, both dPCRs are able to quantify the same amount of bacteria, while the comparison among dPCRs and qPCRs, showed both over and under-estimation of the bacteria present in the unknown suspensions. Our results showed qPCR over-estimated the amount of M. avium subsp. paratuberculosis and F. tularensis cells. On the contrary, qPCR, compared to QX200 dPCR, under-estimated the amount of L. monocytogenes cells. However, the maximum difference among PCRs approaches was <0.5 Log10, while cultural methods underestimated the number of bacteria by one to two Log10 for Francisella tularensis and Mycobacterium avium subsp. paratuberculosis. On the other hand, cultural and PCRs methods quantified the same amount of bacteria for L. monocytogenes, suggesting for this last pathogen, PCRs approaches can be considered as a valid alternative to the cultural ones.
Keywords: bacteria; dPCR; pathogens; qPCR; quantification.
Figures


References
-
- Anonymous (1998). ISO 11290-2: Microbiology of Food and Animal Feeding Stuffs - Horizontal Method for the Detection and Enumeration of Listeria monocytogenes - Part 2: Enumeration Method. Geneva.
-
- Anonymous (2005). COMMISSION REGULATION (EC) No 2073/2005 of 15 November 2005 on Microbiological Criteria for Foodstuffs. Rome.
-
- Anonymous (2009). ISO/TS 19036:2006: Microbiology of Food and Animal Feeding Stuffs – Guidelines for the Estimation of Measurement Uncertainty for Quantitative Determinations. Geneva: AMEDMENT 1.
-
- Anonymous (2012). ISO/TS 12869: Water quality — Detection and Quantification of Legionella spp. and/or Legionella pneumophila by Concentration and Genic Amplification by Quantitative Polymerase Chain reaction (qPCR). Geneva.
-
- Anonymous (2014). OIE Validation Guidelines (2014). VALIDATION GUIDELINE 3.6.5. STATISTICAL APPROACHES TO VALIDATION. Paris: World Organisation for Animal Health, 1–12.
LinkOut - more resources
Full Text Sources
Other Literature Sources
Molecular Biology Databases