

Acetic Acid Causes Endoplasmic Reticulum Stress and Induces the Unfolded Protein Response in Saccharomyces cerevisiae
- PMID: 28702017
- PMCID: PMC5487434
- DOI: 10.3389/fmicb.2017.01192
Acetic Acid Causes Endoplasmic Reticulum Stress and Induces the Unfolded Protein Response in Saccharomyces cerevisiae
Abstract
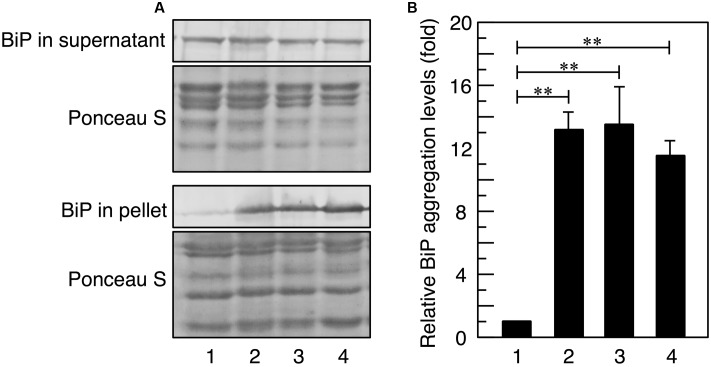
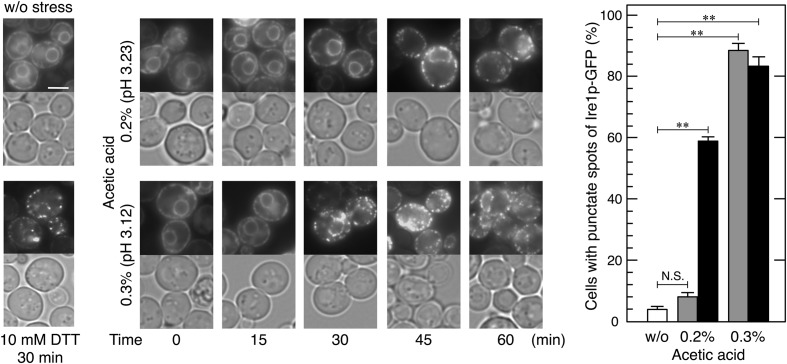
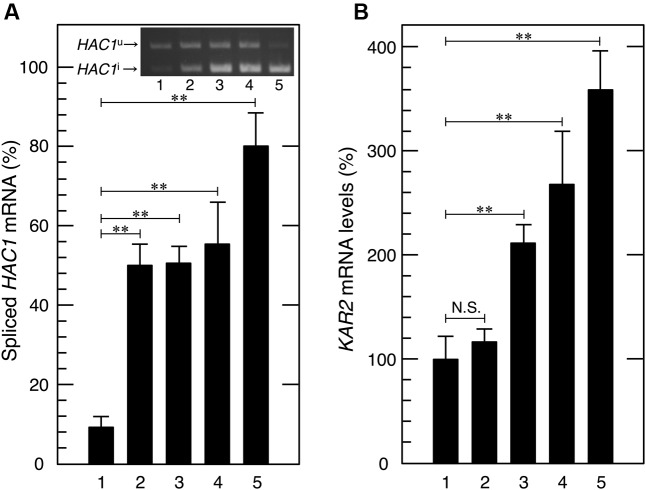
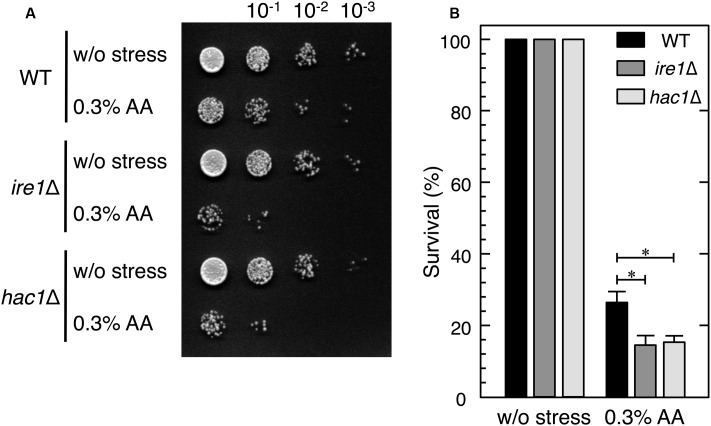
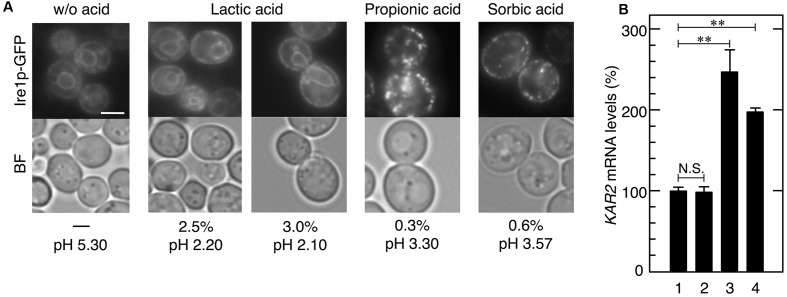
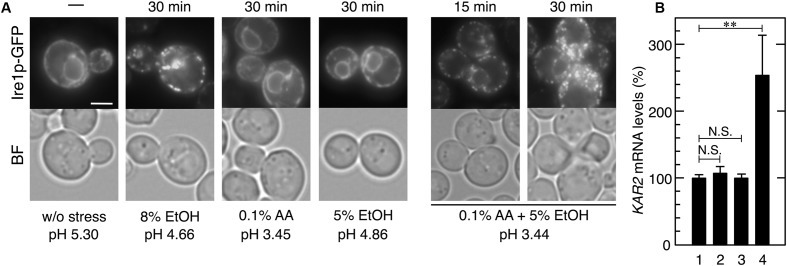
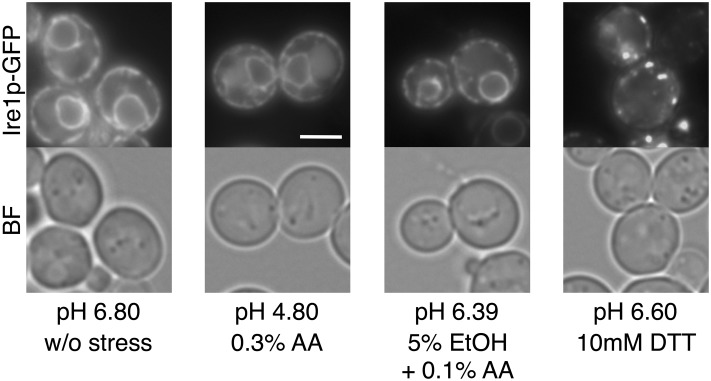
Since acetic acid inhibits the growth and fermentation ability of Saccharomyces cerevisiae, it is one of the practical hindrances to the efficient production of bioethanol from a lignocellulosic biomass. Although extensive information is available on yeast response to acetic acid stress, the involvement of endoplasmic reticulum (ER) and unfolded protein response (UPR) has not been addressed. We herein demonstrated that acetic acid causes ER stress and induces the UPR. The accumulation of misfolded proteins in the ER and activation of Ire1p and Hac1p, an ER-stress sensor and ER stress-responsive transcription factor, respectively, were induced by a treatment with acetic acid stress (>0.2% v/v). Other monocarboxylic acids such as propionic acid and sorbic acid, but not lactic acid, also induced the UPR. Additionally, ire1Δ and hac1Δ cells were more sensitive to acetic acid than wild-type cells, indicating that activation of the Ire1p-Hac1p pathway is required for maximum tolerance to acetic acid. Furthermore, the combination of mild acetic acid stress (0.1% acetic acid) and mild ethanol stress (5% ethanol) induced the UPR, whereas neither mild ethanol stress nor mild acetic acid stress individually activated Ire1p, suggesting that ER stress is easily induced in yeast cells during the fermentation process of lignocellulosic hydrolysates. It was possible to avoid the induction of ER stress caused by acetic acid and the combined stress by adjusting extracellular pH.
Keywords: BiP; ER stress; Hac1p; Ire1p; Saccharomyces cerevisiae; acetic acid; lactic acid; unfolded protein response.
Figures
Similar articles
-
The cellular response to protein misfolding in the endoplasmic reticulum.Gene Expr. 1999;7(4-6):293-300. Gene Expr. 1999. PMID: 10440230 Free PMC article. Review.
-
mRNA splicing-mediated C-terminal replacement of transcription factor Hac1p is required for efficient activation of the unfolded protein response.Proc Natl Acad Sci U S A. 2000 Apr 25;97(9):4660-5. doi: 10.1073/pnas.050010197. Proc Natl Acad Sci U S A. 2000. PMID: 10781071 Free PMC article.
-
Dissociation of Kar2p/BiP from an ER sensory molecule, Ire1p, triggers the unfolded protein response in yeast.Biochem Biophys Res Commun. 2000 Dec 20;279(2):445-50. doi: 10.1006/bbrc.2000.3987. Biochem Biophys Res Commun. 2000. PMID: 11118306
-
Differences in HAC1 mRNA processing and translation between yeast and mammalian cells indicate divergence of the eukaryotic ER stress response.Biochem Biophys Res Commun. 2001 Sep 28;287(3):789-800. doi: 10.1006/bbrc.2001.5633. Biochem Biophys Res Commun. 2001. PMID: 11563865
-
Translation Control of HAC1 by Regulation of Splicing in Saccharomyces cerevisiae.Int J Mol Sci. 2019 Jun 12;20(12):2860. doi: 10.3390/ijms20122860. Int J Mol Sci. 2019. PMID: 31212749 Free PMC article. Review.
Cited by
-
ScEnSor Kit for Saccharomyces cerevisiae Engineering and Biosensor-Driven Investigation of the Intracellular Environment.ACS Synth Biol. 2023 Aug 18;12(8):2493-2497. doi: 10.1021/acssynbio.3c00124. Epub 2023 Aug 8. ACS Synth Biol. 2023. PMID: 37552581 Free PMC article.
-
Four ways of implementing robustness quantification in strain characterisation.Biotechnol Biofuels Bioprod. 2023 Dec 19;16(1):195. doi: 10.1186/s13068-023-02445-6. Biotechnol Biofuels Bioprod. 2023. PMID: 38115067 Free PMC article.
-
A CRISPR Interference Screen of Essential Genes Reveals that Proteasome Regulation Dictates Acetic Acid Tolerance in Saccharomyces cerevisiae.mSystems. 2021 Aug 31;6(4):e0041821. doi: 10.1128/mSystems.00418-21. Epub 2021 Jul 27. mSystems. 2021. PMID: 34313457 Free PMC article.
-
Unmasking the Antifungal Activity of Anacardium occidentale Leaf Extract against Candida albicans.J Fungi (Basel). 2024 Jun 29;10(7):464. doi: 10.3390/jof10070464. J Fungi (Basel). 2024. PMID: 39057348 Free PMC article.
-
A functional unfolded protein response is required for chronological aging in Saccharomyces cerevisiae.Curr Genet. 2020 Feb;66(1):263-277. doi: 10.1007/s00294-019-01019-0. Epub 2019 Jul 25. Curr Genet. 2020. PMID: 31346745
References
-
- Almeida J. R. M., Modig T., Petersson A., Hähn-Hägerdal B., Lidén G., Gorwa-Grauslund M. F. (2007). Increased tolerance and conversion of inhibitors in lignocellulosic hydrolysates by Saccharomyces cerevisiae. J. Chem. Technol. Biotechnol. 82 340–349. 10.1007/s10295-014-1431-6 - DOI
-
- Arneborg N., Moos M., Jakobsen M. (1995). The effect of acetic acid and specific growth rate on acetic acid tolerance and trehalose content of Saccharomyces cerevisiae. Biotechnol. Lett. 17 1299–1304. 10.1007/BF00189214 - DOI
LinkOut - more resources
Full Text Sources
Other Literature Sources