. 2017 Jun;20(6):662-675.
doi: 10.22038/IJBMS.2017.8834.

Establishment of human hair follicle mesenchymal stem cells with overexpressed human hepatocyte growth factor

Affiliations

Establishment of human hair follicle mesenchymal stem cells with overexpressed human hepatocyte growth factor

Dan Zhou et al. Iran J Basic Med Sci. 2017 Jun.

Abstract

Objectives: Chronic liver disease has become a major health problem that causes serious damage to human health. Since the existing treatment effect was not ideal, we need to seek new treatment methods.

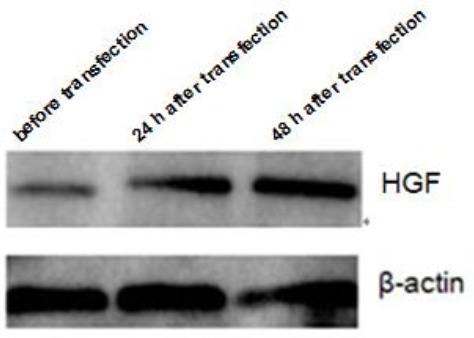
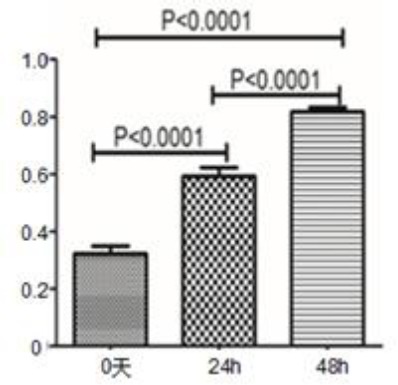
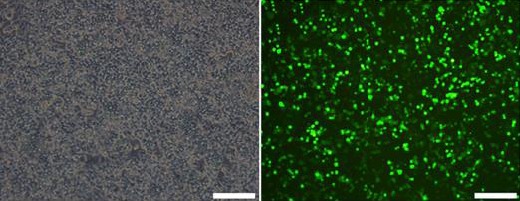
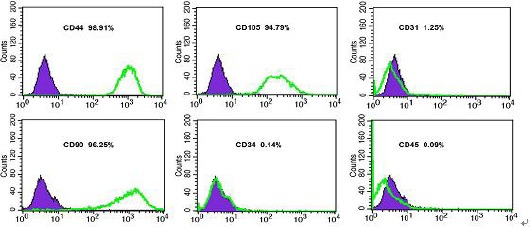
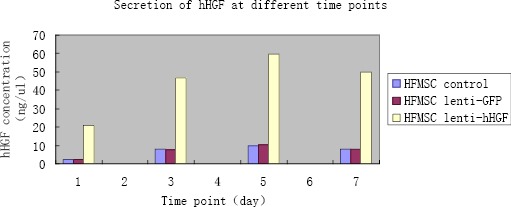
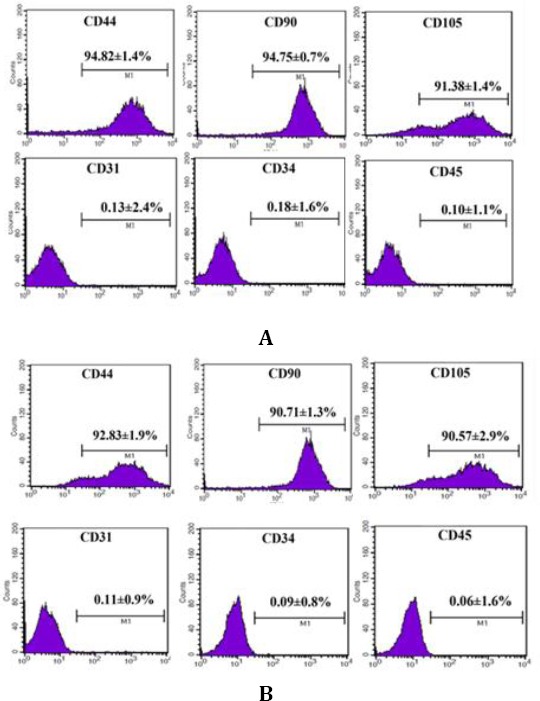
Materials and methods: We utilized the gene recombination technology to obtain the human hair mesenchymal stem cells which overexpression of human hepatocyte growth factor (hHGF). Furthermore, we verified the property of transfected cells through detecting surface marker by flow cytometry.

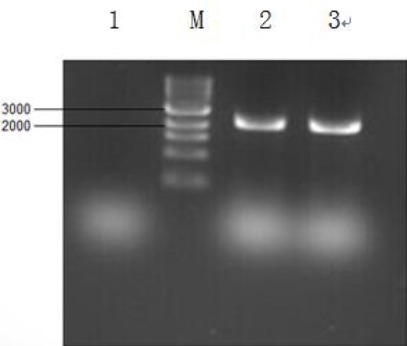
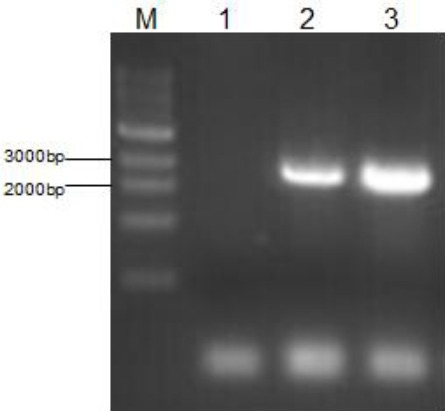
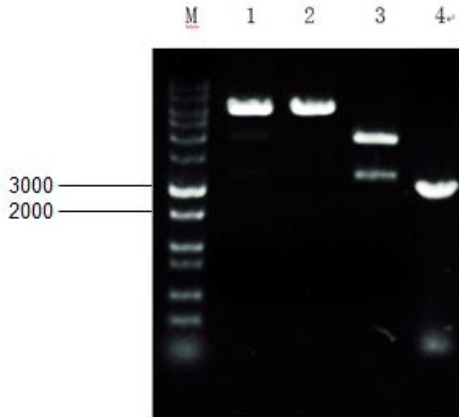
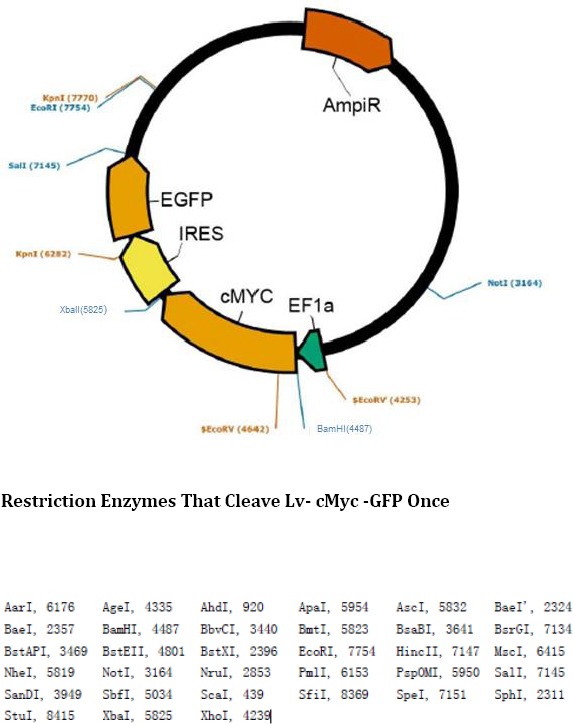
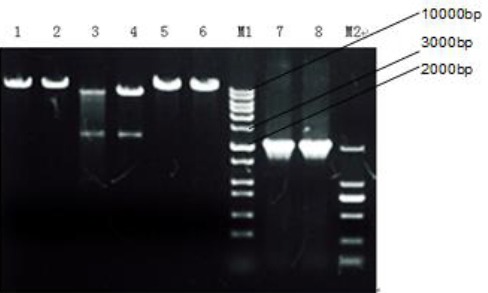
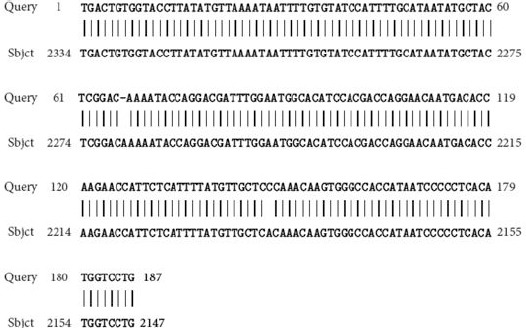
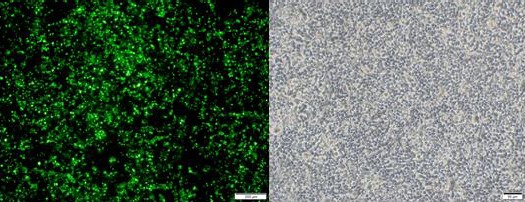
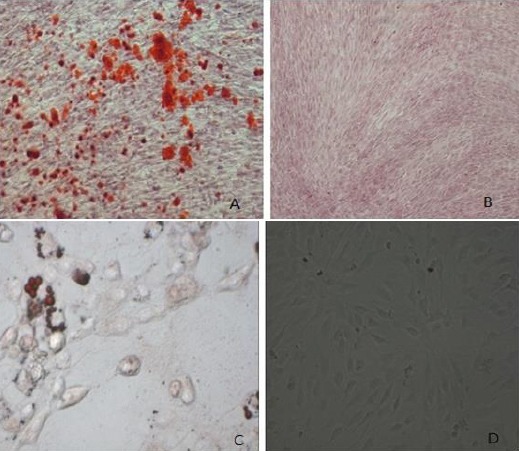
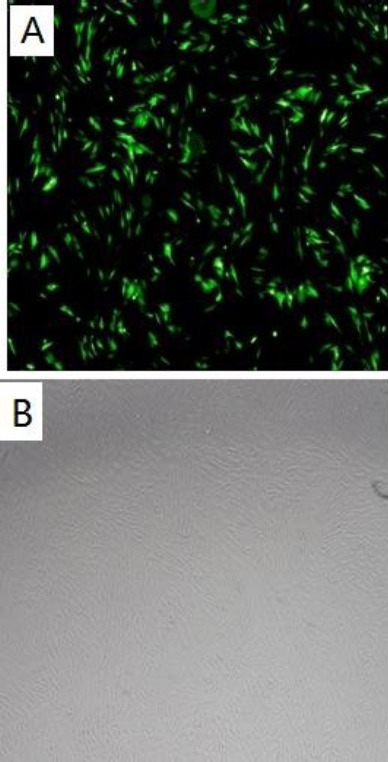
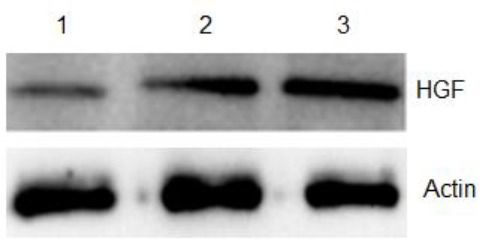
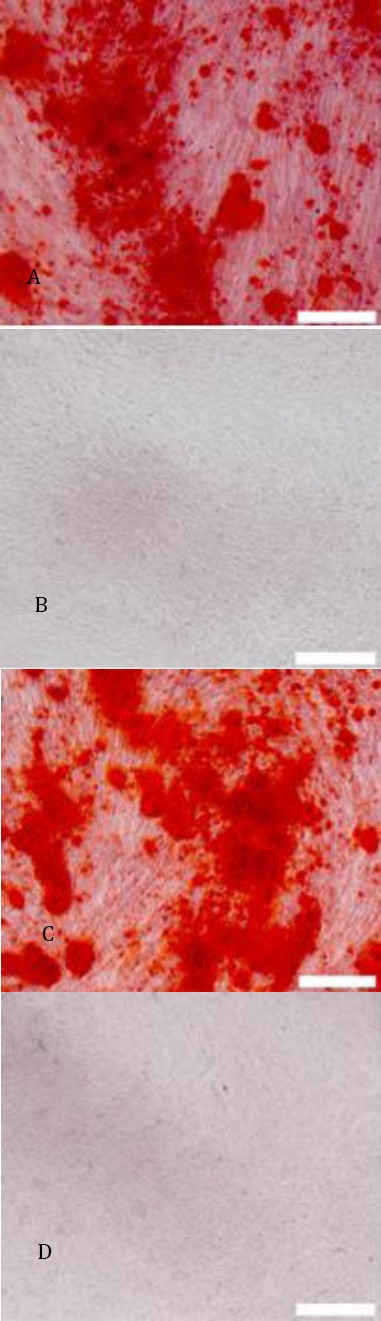
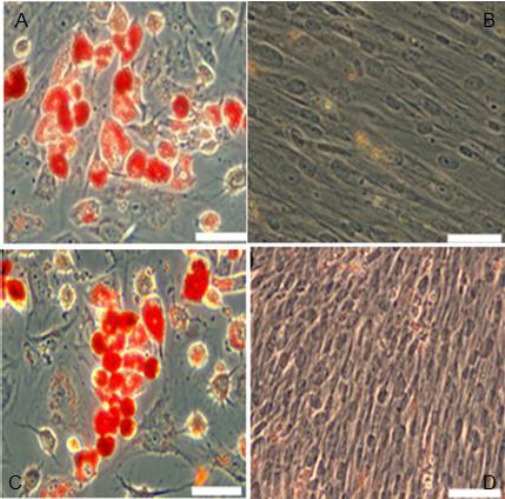
Results: We show here establishment of the hHGF-overexpressing lentivirus vector, and successfully transfection to human hair follicle mesenchymal stem cells. The verified experiments could demonstrate the human hair follicle mesenchymal stem cells which have been transfected still have the properties of stem cells.

Conclusion: We successfully constructed human hair follicle mesenchymal stem cells which overexpression hHGF, and maintain the same properties compared with pro-transfected cells.

Keywords: HGF; Hair follicle; Lentivirus; Liver diseases; Stem cells.


Figures

Figure 1
Figure 1
Gel electrophoresis pattern of total RNA
Figure 2
Figure 2
Gel electrophoresis pattern for hepatocyte growth factor (HGF) gene obtained by PCR. Reverse transcription was performed to obtain the cDNA of HGF by using total RNA extracted from liver tissue as template, followed by PCR to obtain the HGF gene. M is marker 10000; 1 is negative control, 2 and 3 are positive controls with cDNA as the template Translation for embedded text:
Figure 3
Figure 3
Gel electrophoresis pattern for PCR identification after binding with hepatocyte growth factor (HGF)-T1 vector Escherichia coli plasmid infected with HGF-T1 was used as the template to perform PCR identification, verifying the presence of HGF gene in the E. coli. M is marker 10000; 1 is negative control;2 is the cDNA with HGF as the template; 3 is the plasmid extracted from infected E. coli
Figure 4
Figure 4
Gel electrophoresis pattern for digestion products after transduction and T1 vector binding. 1 and 2 are products of single digestion by BamHI and XbaI after T1 vector binding; 3 is the products of double digestion. M is marker 10000 Restriction Enzymes That Cleave Lv- cMyc -GFP Once
Figure 5
Figure 5
Existing Lenti- EF1a-cMyc-IRES-eGFP plasmid diagram and enzyme cleavage sites. According to the enzyme cleavage sites on the plasmid diagram, two common enzyme cleavage sites for BamH1 (4487) and XbaI (5825) were selected for double digestion
Figure 6
Figure 6
Gel electrophoresis pattern for identification of plasmid after binding with T4 ligase. 1 and 2 show bands after single digestion with XbaI while, 3 and 4 show bands after double digestion with XbaI and BamHI, 5 and 6 show bands after single digestion with BamHI, and 7 and 8 show PCR products. M1 and M2 represent marker 10000 and marker 2000, respectively
Figure 7
Figure 7
Gene sequencing data after hHGF insertion and positive expression. This indicates successful construction of lentivirus plasmid expressing hHGF
Figures 8
Figures 8
A and B are the images of 293T cells transfected with hHGF seen under a fluorescence microscope (A) and regular microscope (B) (40×)
Figure 9
Figure 9
Expression level of hepatocyte growth factor (HGF) protein after transfection of target plasmid into 293T cells
Figure 10
Figure 10
Expression of hepatocyte growth factor (HGF) mRNA after 24 hr and 48 hr following transfection of target plasmid into 293T cells
Figure 11
Figure 11
Lentivirus transfected 293 T cells that secreted the overexpressed hepatocyte growth factor (HGF) (48 hr after transfection, 40×)
Figure 12
Figure 12
Identification of adipogenesis and osteogenesis of hair follicle mesenchymal stem cells (HFMSCs). A: After 3 weeks of induction of HFMSCsin osteogenic differentiation medium, staining with alizarin red revealed mineralized cells in a reddish-brown color; C: After 2 weeks of induction in adipogenic differentiation medium, oil red O staining showed bright fat droplets in bright red color; B and D: Cells cultured for 2 weeks in basic medium instead of osteogenic and adipogenic differentiation media were used as the negative control. Alizarin red and oil red O staining revealed that cells did not change color. (200×)
Figure 13
Figure 13
Determination of phenotype characteristics of hair follicle mesenchymal stem cells by flowcytometry
Figure 14
Figure 14
The Growth status of cells under different culture conditions
Figure 15
Figure 15
A: Image of hair follicle mesenchymal stem cells after viral transfection seen under a fluorescence microscope, B: Image of cells after transfection as seen under an inverted microscope (40×)
Figure 16
Figure 16
Expression level of hHGF in human hair follicle mesenchymal stem cells. 1, 2, and 3 show the protein expression of the control group, only GFP transfection G-HFMSCs group, and human hepatocyte growth factor (hHGF) lentivirus transfection hHGF-HFMSCs group, respectively
Figure 17
Figure 17
Data from ELISA assay showing the amount of human hepatocyte growth factor (hHGF) secreted into the cell culture supernatant at different time points
Figure 19
Figure 19
A C:hHGF-HFMSCs group and GFP-HFMSCs guoup; alizarin red staining revealed red cells at the deposition sites of calcium salt after 4 weeks of induction(40×); B D: Cells cultured for 4 weeks in basic medium instead of osteogenic differentiation media were used as the negative control. Alizarin red staining revealed that cells did not change color (40×)
Figure 20
Figure 20
AC: hHGF-HFMSCs group and GFP-HFMSCs guoup change in cellular morphology was observed and oil red O staining revealed the presence of orange fat droplets inside cells after 2 weeks of induction; BD: Cells cultured for 2 weeks in basic medium instead of adipogenic differentiation media were used as the negative control. Oil red O staining revealed that cells did not change color (100×)
Figure 21
Figure 21
Detection of surface markers for hHGF-HFMSCs group and GFP-HFMSCs group by flow cytometry: A: Detection of surface markers for HGF-HFMSCs group; B: Detection of surface markers for GFP-HFMSCs group

Similar articles

Cited by

References

    1. Neuberger J. An update on liver transplantation: A critical review. J Autoimmun. 2016;66:51–59. - PubMed
    1. Desai R, Neuberger J. Donor transmitted and de novo cancer after liver transplantation. World J Gastroentrol. 2014;20:6170–6179. - PMC - PubMed
    1. Yan L, Cai C, Li J, Xu S, Chang Q, Li Y, et al. Present status and perspectives of stem cell- based therapies for gastrointestinal diseases. Stem Cell Rev. 2009;5:278–282. - PubMed
    1. Ferrer JR, Chokechanachaisakul A, Wertheim JA. New tools in experimental cellular therapy for the treatment of liver diseases. Curr Transplant Rep. 2015;2:202–210. - PMC - PubMed
    1. Zhou H, Liu H, Ezzelarab M, Schmelzer E, Wang Y, Gerlach J, et al. Experimental hepatocyte xenotransplantation-a comprehen-sive review of the literature. Xenotransplantation. 2015;22:239–48. - PMC - PubMed

LinkOut - more resources