. 2017:2017:1537538.
doi: 10.1155/2017/1537538. Epub 2017 Jun 18.

Antioxidant System Response and cDNA-SCoT Marker Profiling in Phoenix dactylifera L. Plant under Salinity Stress

Affiliations

Antioxidant System Response and cDNA-SCoT Marker Profiling in Phoenix dactylifera L. Plant under Salinity Stress

Fahad Al-Qurainy et al. Int J Genomics. 2017.

Abstract

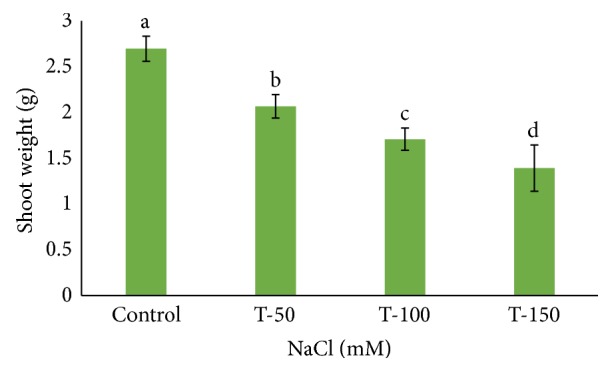
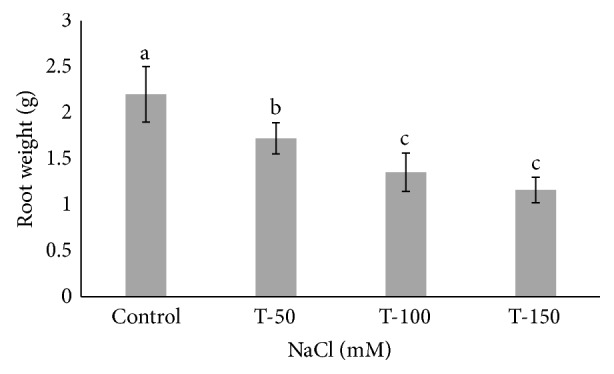
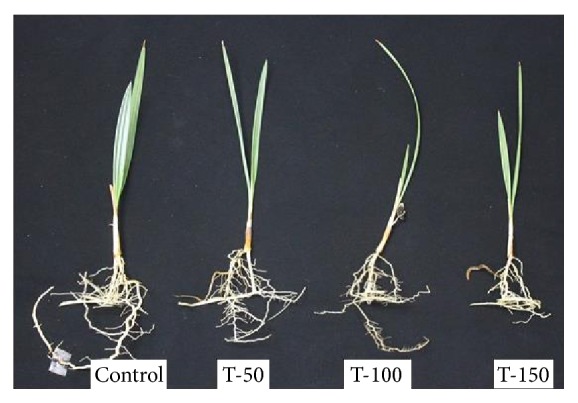
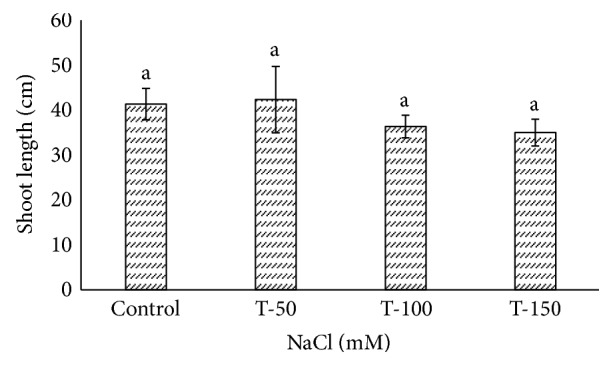
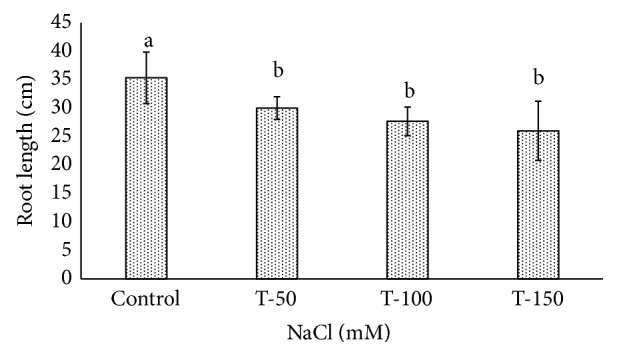
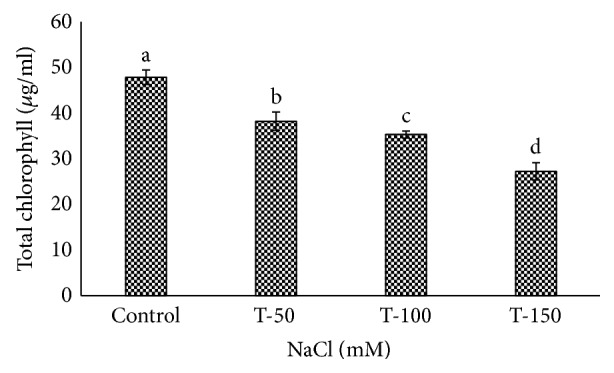
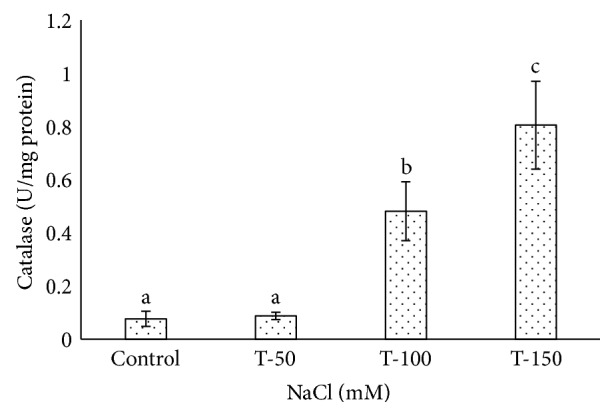
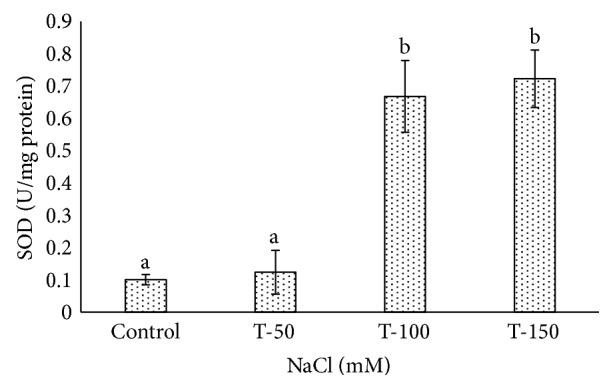
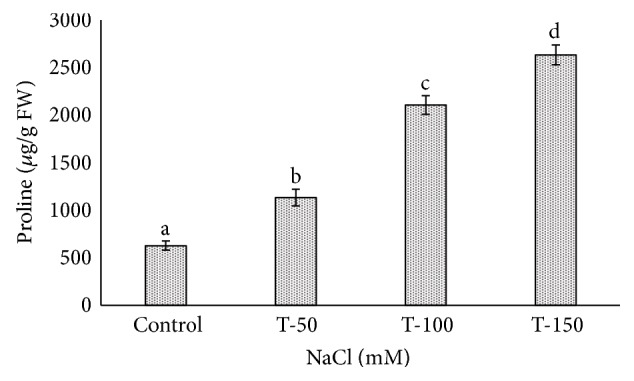
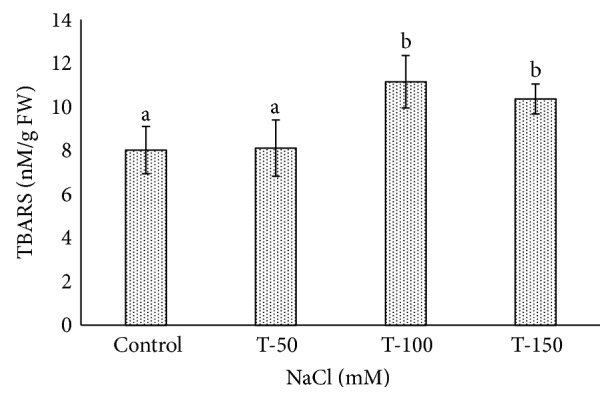
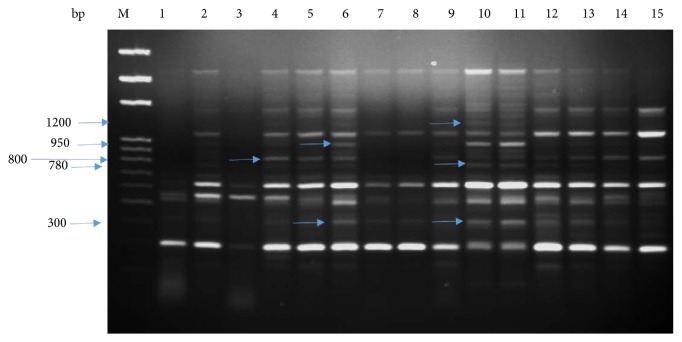
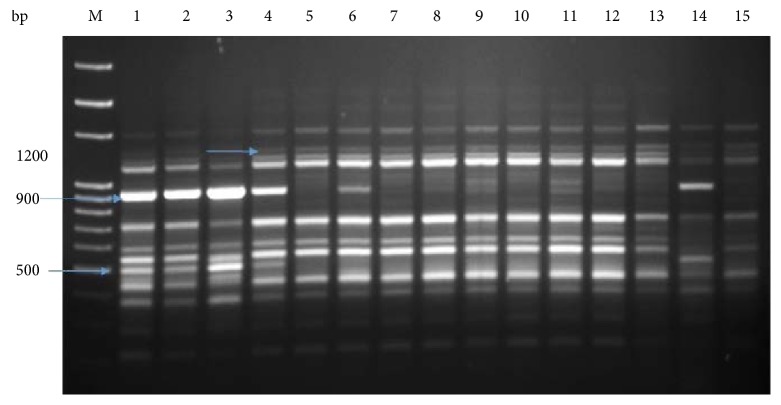
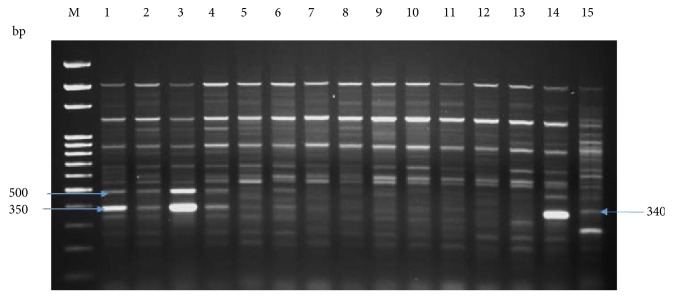
Many Phoenix dactylifera (date palm) cultivars are grown in the arid and semiarid regions of the world, including Saudi Arabia. P. dactylifera is highly tolerant to salinity stress. To investigate the response of Khalas cultivar of P. dactylifera, two-month-old plants were treated with sodium chloride (50, 100, and 150 mM NaCl) for three months. Our result showed that proline content was higher in all treated plants compared to control plants. Thiobarbituric acid reactive substances (TBARS) were increased at 100 and 150 mM NaCl treatments; however, the result was found nonsignificant between control and plants treated at 50 mM NaCl. Similarly, enzyme activities of catalase (CAT) and superoxide dismutase (SOD) were 0.805 and 0.722 U/mg protein/min, respectively, and were greater at 100 and 150 mM NaCl treatments compared to the control plants. Total chlorophyll content and fresh weight of shoots and roots decreased substantially with the increase of salinity. A cDNA start codon-targeted (cDNA-SCoT) marker showed a variation in different gene expressions profiling between treated and untreated plants under various NaCl concentrations.


Figures

Figure 1
Figure 1
Fresh shoot weight in Phoenix dactylifera grown in the pot at different concentrations of NaCl. Data represent means of four replicates ± standard deviation. Different letters on bars represent the significant values according to Duncan's test (p < 0.05).
Figure 2
Figure 2
Fresh root weight in Phoenix dactylifera grown at different concentrations of NaCl. Data represent means of four replicates ± standard deviation. Different letters on bars represent the significant values according to Duncan's test (p < 0.05).
Figure 3
Figure 3
Morphological variations in the root and shoot of Phoenix dactylifera grown under different NaCl concentrations (control: 0 mM, T-50: 50 mM, T-100: 100 mM, and T-150: 150 mM) for 3 months.
Figure 4
Figure 4
Shoot length variation in Phoenix dactylifera grown at different concentrations of NaCl. Data represent means of four replicates ± standard deviation. Different letters on bars represent the significant values according to Duncan's test (p < 0.05).
Figure 5
Figure 5
Root length variation in Phoenix dactylifera grown at different concentrations of NaCl. Data represent means of four replicates ± standard deviation. Different letters on bars represent the significant values according to Duncan's test (p < 0.05).
Figure 6
Figure 6
Effect of salinity on chlorophyll content in Phoenix dactylifera. Data represent means of four replicates ± standard deviation. Different letters on bars represent the significant values according to Duncan's test (p < 0.05).
Figure 7
Figure 7
Catalase activity in Phoenix dactylifera grown at different concentrations of NaCl. Data represent means of four replicates ± standard deviation. Different letters on bars represent the significant values according to Duncan's test (p < 0.05).
Figure 8
Figure 8
Superoxide dismutase activity in Phoenix dactylifera grown at different concentrations of NaCl. Data represent means of four replicates ± standard deviation. Different letters on bars represent the significant values according to Duncan's test (p < 0.05).
Figure 9
Figure 9
Proline accumulation in the leaf of Phoenix dactylifera grown at different concentrations of NaCl. Data represent means of four replicates ± standard deviation. Different letters on bars represent the significant values according to Duncan's test (p < 0.05).
Figure 10
Figure 10
Effect of salinity stress on TBARS accumulation in Phoenix dactylifera. Data represent means of four replicates ± standard deviation. Different letters on bars represent the significant values according to Duncan's test (p < 0.05).
Figure 11
Figure 11
cDNA-SCoT marker profiling generated from individual plant leaf of Phoenix dactylifera at different concentrations of NaCl (SCoT primer 3). Lane M: 100 bp ladder; lanes 1, 2, and 3 (control); lanes 4, 5, 6, and 7 (50 mM NaCl); lanes 8, 9, 10, and 11 (100 mM NaCl); lanes 12, 13, 14, and 15 (150 mM NaCl).
Figure 12
Figure 12
cDNA-SCoT marker profiling generated from individual plant leaf of Phoenix dactylifera at different concentrations of NaCl (SCoT primer 18). Lane M: 100 bp ladder; lanes 1, 2, and 3 (control); lanes 4, 5, 6, and 7 (50 mM NaCl); lanes 8, 9, 10, and 11 (100 mM NaCl); lanes 12, 13, 14, and 15 (150 mM NaCl).
Figure 13
Figure 13
cDNA-SCoT marker profiling generated from individual plant leaf of Phoenix dactylifera at different concentrations of NaCl (SCoT primer 4). Lane M: 100 bp ladder; lanes 1, 2, and 3 (control); lanes 4, 5, 6, and 7 (50 mM NaCl); lanes 8, 9, 10, and 11 (100 mM NaCl); lanes 12, 13, 14, and 15 (150 mM NaCl).

References

    1. Rengasamy P. World salinization with emphasis on Australia. Journal of Experimental Botany. 2006;57(5):1017–1023. doi: 10.1093/jxb/erj108. - DOI - PubMed
    1. Munns R., Tester M. Mechanisms of salinity tolerance. Annual Review of Plant Biology. 2008;59:651–681. doi: 10.1146/annurev.arplant.59.032607.092911. - DOI - PubMed
    1. Ashraf M. Biotechnological approach of improving plant salt tolerance using antioxidants as markers. Biotechnology Advances. 2009;27(1):84–93. doi: 10.1016/j.biotechadv.2008.09.003. - DOI - PubMed
    1. Tanji K. K. Nature and extent of agricultural salinity. In: Tangi K. K., editor. Agricultural Salinity Assessment and Management. New York: American Society of Civil Engineers; 1990. pp. 1–17.
    1. Szabolcs I. Soil salinization. In: Pessarakli M., editor. Handbook of Plant Crop Stress. New York: Marcel Dekker; 1994. pp. 3–11.

LinkOut - more resources