Review
. 2017 Oct 30;46(21):6492-6531.
doi: 10.1039/c7cs00372b.

Implications of peptide assemblies in amyloid diseases

Affiliations
Review

Implications of peptide assemblies in amyloid diseases

Pu Chun Ke et al. Chem Soc Rev. .

Abstract

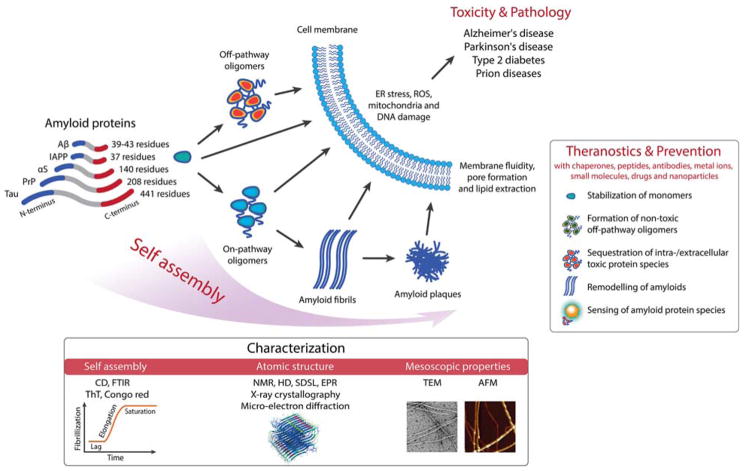
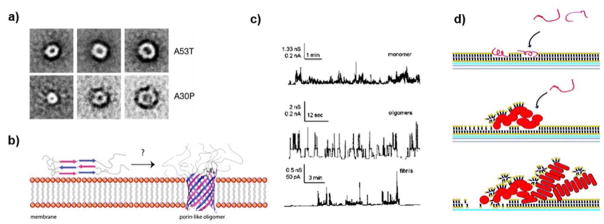
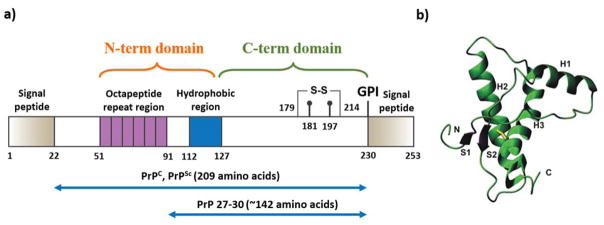
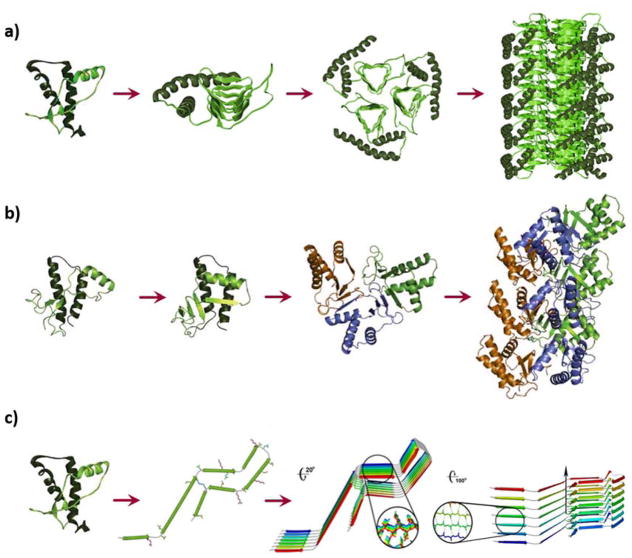
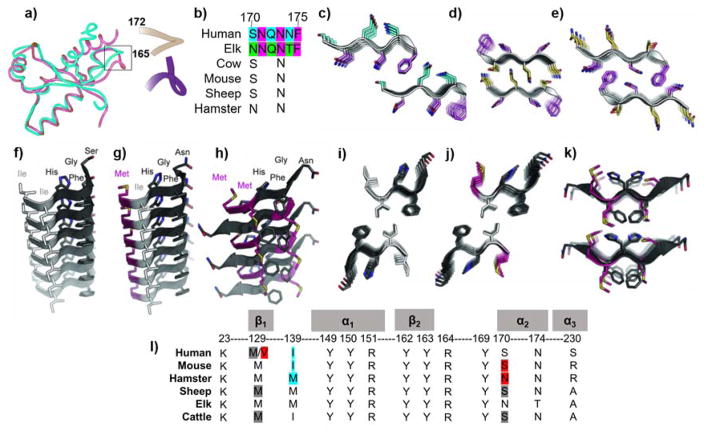
Neurodegenerative disorders and type 2 diabetes are global epidemics compromising the quality of life of millions worldwide, with profound social and economic implications. Despite the significant differences in pathology - much of which are poorly understood - these diseases are commonly characterized by the presence of cross-β amyloid fibrils as well as the loss of neuronal or pancreatic β-cells. In this review, we document research progress on the molecular and mesoscopic self-assembly of amyloid-beta, alpha synuclein, human islet amyloid polypeptide and prions, the peptides and proteins associated with Alzheimer's, Parkinson's, type 2 diabetes and prion diseases. In addition, we discuss the toxicities of these amyloid proteins based on their self-assembly as well as their interactions with membranes, metal ions, small molecules and engineered nanoparticles. Through this presentation we show the remarkable similarities and differences in the structural transitions of the amyloid proteins through primary and secondary nucleation, the common evolution from disordered monomers to alpha-helices and then to β-sheets when the proteins encounter the cell membrane, and, the consensus (with a few exceptions) that off-pathway oligomers, rather than amyloid fibrils, are the toxic species regardless of the pathogenic protein sequence or physicochemical properties. In addition, we highlight the crucial role of molecular self-assembly in eliciting the biological and pathological consequences of the amyloid proteins within the context of their cellular environments and their spreading between cells and organs. Exploiting such structure-function-toxicity relationship may prove pivotal for the detection and mitigation of amyloid diseases.


Figures

Figure 1
Figure 1
Scope of the present review, highlighting protein self-assembly, its biological and pathological implications, theranostics and prevention. Aβ: amyloid-beta; IAPP: islet amyloid polypeptide; αS: alpha-synuclein; PrP: prion protein; CD: circular dichroism spectroscopy; FTIR: Fourier transform infrared spectroscopy; ThT: thioflavin T assay; NMR: nuclear magnetic resonance; HD: hydrogen-deuterium exchange; SDSL: site directed spin labelling; EPR: electron paramagnetic resonance; TEM: transmission electron microscopy; AFM: atomic force microscopy. ER: endoplasmic reticulum; ROS: reactive oxygen species.
Figure 2
Figure 2
(a) Non-amyloidogenic pathway triggered by the location of APP at the plasma membrane interface; and (b) Amyloidogenic pathway induced through APP endocytosis into endosomal vesicles containing the protease BACE1. Aβ peptides are then prone to aggregation and can be either secreted extracellularly or remain in the intracellular space to target other organelles, such as mitochondria, or be degraded by proteases such as cathepsin B.
Figure 3
Figure 3
(a) Aβ peptide sequence (CINEMA color code), potential post-modification sites and physicochemical properties; and (b) Intramolecular interactions stabilizing the typical hairpin β-sheet structure. Red and orange dashes: molecular contacts. Blue dashes: side-chain packing. Green: hydrophobic residues. Black: salt bridge. Adapted from reference . Copyright Nature Publishing Group.
Figure 4
Figure 4
Aβ aggregation pathways from monomer to fibril formation and toxic outcomes.
Figure 5
Figure 5
Aβ40 structural polymorphism depending on experimental conditions. Rendered from PDB 1BA4, 1AML, 2MVX and 2MJ4.
Figure 6
Figure 6
Two recent solid-state NMR Aβ42 fibril structures identifying different assemblies by (left) Griffin and co-workers (PDB: 5kk3) and (right) Ishii and co-workers (2MXU). High similarity is apparent with the β-sheet domain (purple ribbons) and the unstructured strand (gray ribbons) forming an S-shape. The hydrophobic surfaces are based on Kyte-Doolittle scale (red: hydrophobic, white: neutral, blue: hydrophilic).
Figure 7
Figure 7
Structural studies of IAPP. (a) The primary structure of IAPP peptide. Solution NMR structures of IAPP monomers stabilized by SDS micelle at (b) pH 4.2 (PDB: 2KB8) and (c) pH 7.3 (PDB: 2L86). (d) Solution NMR structure of IAPP whose aggregation is reduced at pH 5.3, 4 °C, and 100 μM in concentration (PDB: 5MGQ). Residues 1–19 are colored purple and His18 is in sticks. The overall U-shaped IAPP fibril models are derived from experimental constraints by (e) solid-state NMR and (f) X-ray crystallography of short peptides. In panels (e) and (f), two peptides in the fibril cross-section are shown in sticks viewed along the fibril axis. (g) EPR constraints were applied to reconstruct the fibril model of disulfide reduced IAPP. The sub-panels A and B correspond to views along and perpendicular to the fibril axis, and sub-panels C and D are the accordingly reconstructed fibril models with two different views perpendicular to the fibril axis. Copyright The American Chemical Society, John Wiley & Sons, and The American Society for Biochemistry and Molecular Biology.
Figure 8
Figure 8
Morphology of IAPP amyloid fibrils. (a) Lateral association of ribbon-like IAPP protofibrils revealed by TEM of freeze-dried tungsten-shadowed samples. Subpanels ad depict ribbons assembled by lateral association of 1 to 4 protofibrils. Ribbons with multiple protofibrils often crossed over in a left-handed sense at moderately regular intervals. Subpanel e corresponds to lateral assembly of protofibrils into single-layered, sheet-like arrays. Scale bar: 100 nm. (b) IAPP fibrils with coiled morphologies., Subpanels a and b denote coiled fibrils visualized by TEM and AFM, respectively. Arrows point to a left-handed fibril with a 25 nm cross-over periodicity. Longer periodicities of approximately 50 nm can also be seen in both subpanels. Subpanel c shows the AFM height distribution, and d compares the 25 nm periodicity fibril in TEM and AFM. Scale bars: 100 nm in subpanels a, b; and 50 nm in d. Copyright Elsevier.
Figure 9
Figure 9
Effects of β-cell granule components on IAPP aggregation. (a) A representative IAPP-insulin complex from DMD simulations, where the amyloidogenic residues of IAPP (residues 22–29) are shown in orange. The residues in the B-chain of insulin important for binding IAPP are highlighted in stick representation. (b) The residues of an insulin monomer are colored according to IAPP binding frequencies in the structure of an insulin hexamer. The view with an 180° rotation is also presented. The residues with strong IAPP-binding are located at the insulin monomer–monomer interface. (c) A representative IAPP tetramer with His18 (highlighted as sticks in pink) coordinated by a Zn2+ (blue sphere) from DMD simulations. The amyloidogenic sequences from each IAPP monomer are highlighted in rainbow colors. (d) A mechanistic scheme demonstrating the dependence of IAPP aggregation on relative zinc concentration. Copyright The American Chemical Society and Elsevier.
Figure 10
Figure 10
Inhibition of IAPP aggregation. (a) Left: High-throughput dynamic light scattering measurement of IAPP size distributions with and without resveratrol (2:1 ligand/IAPP ratio). Right: Distribution of IAPP aggregates of different molecular weights with and without resveratrol in silico. Stable IAPP/resveratrol oligomer has the resveratrol molecules forming a nano-sized core and IAPP peptides a corona, which prevents aggregation. (b) Left: a typical IAPP dimer in DMD simulations. Right: Binding to a PAMAM-OH dendrimer (spheres) inhibits self-association of the amyloidogenic sequences (yellow region) between two IAPP peptides. The peptides are shown in cartoon representation with rainbow color from blue (N-terminus) to red (C-terminus). Copyright Nature Publishing Group and John Wiley & Sons.
Figure 11
Figure 11
(a) (Large image) Pigmented nerve cells containing αS-positive Lewy body (thin arrows) and Lewy neurites (thick arrow). Small image: a pigmented nerve cell with two αS-positive Lewy bodies. Scale bar: 8 μm. (b) Hypothesized αS toxicity and spread of pathology in Parkinson’s disease (PD) and Parkinson’s disease dementia (PDD). UPS: Ubiquitin proteasome system. Copyright Nature Publishing Group.
Figure 12
Figure 12
Landmark studies concerning the structures of αS fragments with respect to its full 140 residues consisting of N terminus, NAC and C terminus. The researcher teams are chronicled on the left while the employed techniques are abbreviated on the right. EPR: electron paramagnetic resonance; ssNMR: solid-state nuclear magnetic resonance; HD: hydrogen-deuterium exchange; SDSL: site directed spin labelling. Copyright Nature Publishing Group.
Figure 13
Figure 13
(a) Top and side views of the structures of NACore (orange; residues 68–78, sequence also see Fig. 12) and PreNAC segments (blue; residues 47–56, sequence also see Fig. 12). The A53T mutation in PreNAC is shown in black. (b–e) Three-dimensional structure of a full αS fibril. (b) A central monomer from residues 44 to 96 looking down the fibril axis showing the Greek-key motif of the fibril core. (c) Stacked monomers showing the sidechain alignment between each monomer down the fibril axis. (d) Residues 25 to 105 of 8 monomers displaying the β-sheet alignment of each monomer in the fibril and the Greek-key topology of the core. (e) Overlaid ten lowest energy structures, showing sidechain positions within the core. Residues 51–57 are indicated in red with side chains removed. Copyright Nature Publishing Group.
Figure 14
Figure 14
(A) AFM image showing a periodicity of 100–150 nm along an αS protofibril. The peak (red arrow) to trough (blue arrow) differs by ~1 nm in height. (Inset) A section of a protofilament with an average height of 3.8 nm. (B) Proposed fold of an αS fibril. A monomeric αS within a protofilament (center). Incorporation of protofilaments into a straight or twisted fibril is illustrated in the left and right panel, respectively. Copyright Cell Press and National Academy of Sciences.
Figure 15
Figure 15
Proposed mechanisms of membrane damage induced by αS aggregation. (a) Projection averages of annular oligomers formed by αS mutants A53T and A30P. (b) αS oligomer spans the membrane in a porin-like fashion to induce toxicity. (c) Oligomers but not monomers or fibrils induced frequent channel formation in planar lipid bilayers formed from diphytanoylphosphatidylcholine dissolved in n-decane in 1 M KCl, at a bias of +100 mV. (d) (Top panel) Monomeric αS adsorbed to a lipid bilayer. (Middle panel) Aggregation of αS monomers causes membrane thinning and lipid extraction. (Lower panel) Further incubation results in assembly of mature αS fibrils and disassembly of the lipid membrane. Copyright Nature Publishing Group, Portland Press and The American Chemical Society.
Figure 16
Figure 16
(a) Overview of the PrP sequence and architecture., The residue numbering refers to human PrP. (b) 3D representation of the secondary structure of mouse PrPC. The unordered N-terminus is omitted and the sulphur bridge between Cys179 and Cys214 is indicated in yellow. Copyright Nature Publishing Group.
Figure 17
Figure 17
Structural models for the PrPSc aggregates: (a) In the β-helical model the N-terminal region (90–177 residues, light green) of PrP 27–30 refolds into a β-helix motif and the C-terminal region (residues 178–230, dark green) maintains α-helical secondary structure as in native PrPC. (b) The β-spiral model consists of a spiralling core of extended sheets consisting of short β-strands, comprising residues 116–119, 129–132 and 160–164. The three α-helices in C-terminus maintain this conformational motif. (c) The parallel in-register extended β-sheet model of PrPSc, where PrPC refolds into a structure consisting mainly of β-sheets. Copyright National Academy of Sciences.
Figure 18
Figure 18
Electron microscopy of prion fibrils. (a) Aggregates of wild-type 22L scrapie prion aggregates. (b) Prion rods of PrP 27–30. (c) Wild type RML scrapie prion structure obscured by non-fibrillar material, while (d) anchorless RML fibril morphology was much cleaner. (e) Celery stalk-like brain-derived GPI-anchorless 22L fibril and proposed parallel in-register β-sheet model of PrP (90–231) octametric segment. Scale bars: 100 nm. Copyright Elsevier, National Academy of Sciences and American Society for Biochemistry and Molecular Biology.
Figure 19
Figure 19
Amino acid sequence and 3D structural comparison of β-sheet stacking from steric zones of PrPSc in different mammalian species. Superimposition of mouse (grey) and hamster (blue) PrPSc with 165–172 backbone fold (a). Amino acid sequence from 170–175 backbone region (b). Cyan highlights human while orange highlights elk specific residues. Stick representation of steric zipper interfacing β-sheet back bone region for human (c) and both alignments of elk (d, e). X-ray crystallographic atomic structures from barrier determining steric zippers from human, mouse and hamster, side view for single β-sheet stacking (f, g, h) and top view of steric zipper (i, j, k). Sequence differences at molecular switches, defining the conformational and transmission barrier between different species (l)., Grey and red indicate transmission and barrier while cyan at 139 presents molecular switch for parallel or anti-parallel sheet stacking in human, mouse and hamster. Copyright The American Chemical Society.
Figure 20
Figure 20
Prion diagnostics and therapeutics at the nano and medicinal chemistry fronts. Compilated from references –. PrPSc can be sensed by turning on/off the fluorescence of fluorescein-AuNPs (a), free QDs (g) or QD-FeNP sandwiches (f), or by resonance light scattering (RLS) of lipoic acid-AuNP aggregates (b). Quantitative sensing can be performed by Raman spectroscopy of Au nanorods (j). PrPSc can be captured by AuNPs with polyamines and sulphonates surface layers of (c) or by FeNPs with mercaptopropionic acid, aspartic acid (d) or RNA aptamer surface layers (e). Cell bound PrPSc can be captured by aptamer-AgNP conjugates (i) while complete denaturation of PrPSc can be observed with 5G polyamine dendrimers (h). The TEM images in h are reproduced from ref. with permission from the Royal Society of Chemistry. The TEM images in b and Raman spectra in j are copyrights of The American Society of Chemistry and National Academy of Science.

Similar articles

Cited by

References

    1. Knowles TPJ, Vendruscolo M, Dobson CM. Nat Rev Mol Cell Biol. 2014;15:384–396. - PubMed
    1. Cohen SIA, Linse S, Luheshi LM, Hellstrand E, White DA, Rajah L, Otzen DE, Vendruscolo M, Dobson CM, Knowles TPJ. Proc Natl Acad Sci USA. 2013;110:9758–9763. - PMC - PubMed
    1. Knowles TPJ, Waudby CA, Devlin GL, Cohen SIA, Aguzzi A, Vendruscolo M, Terentjev EM, Welland ME, Dobson CM. Science. 2009;326:1533–1537. - PubMed
    1. Guijarro JI, Sunde M, Jones JA, Campbell ID, Dobson CM. Proc Natl Acad Sci USA. 1998;95:4224–4228. - PMC - PubMed
    1. Chiti F, Webster P, Taddei N, Clark A, Stefani M, Ramponi G, Dobson CM. Proc Natl Acad Sci USA. 1999;96:3590–3594. - PMC - PubMed

MeSH terms

Substances