. 2017 Sep;28(9):947-958.
doi: 10.1007/s10552-017-0907-x. Epub 2017 Jul 12.

Evaluating the impact of varied compliance to lung cancer screening recommendations using a microsimulation model

Affiliations

Evaluating the impact of varied compliance to lung cancer screening recommendations using a microsimulation model

Summer S Han et al. Cancer Causes Control. 2017 Sep.

Abstract

Background: The US preventive services task force (USPSTF) recently recommended that individuals aged 55-80 with heavy smoking history be annually screened by low-dose computed tomography (LDCT), thereby extending the stopping age from 74 to 80 compared to the national lung screening trial (NLST) entry criterion. This decision was made partly with model-based analyses from cancer intervention and surveillance modeling network (CISNET), which assumed perfect compliance to screening.

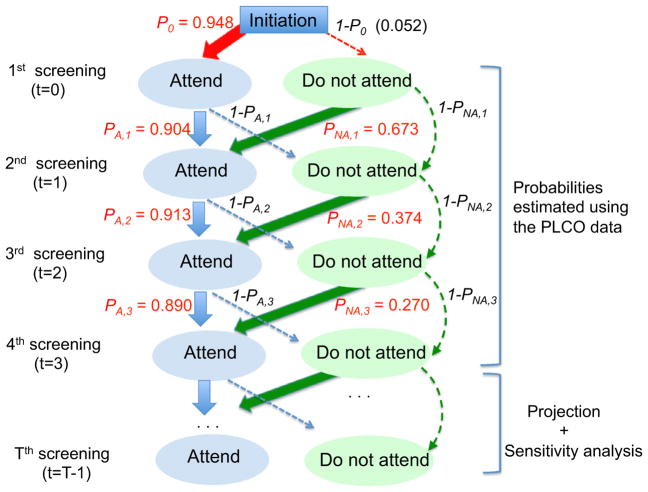
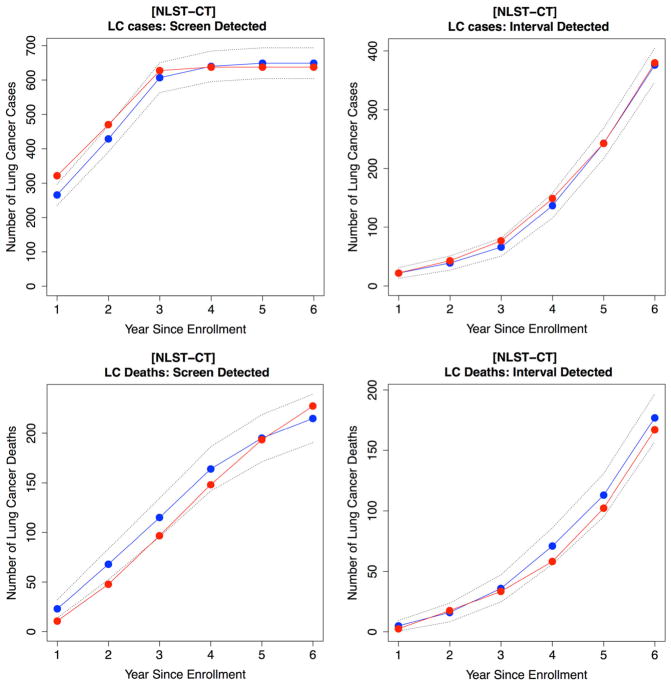
Methods: As part of CISNET, we developed a microsimulation model for lung cancer (LC) screening and calibrated and validated it using data from NLST and the prostate, lung, colorectal, and ovarian cancer screening trial (PLCO), respectively. We evaluated population-level outcomes of the lifetime screening program recommended by the USPSTF by varying screening compliance levels.

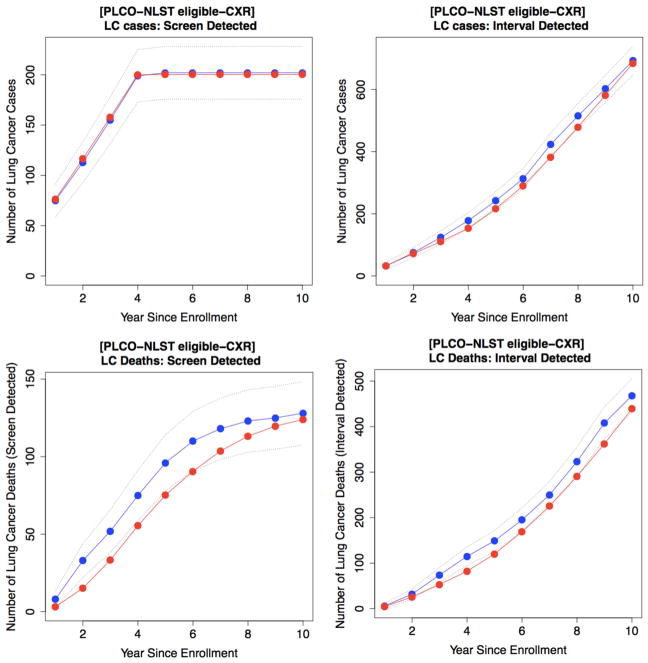
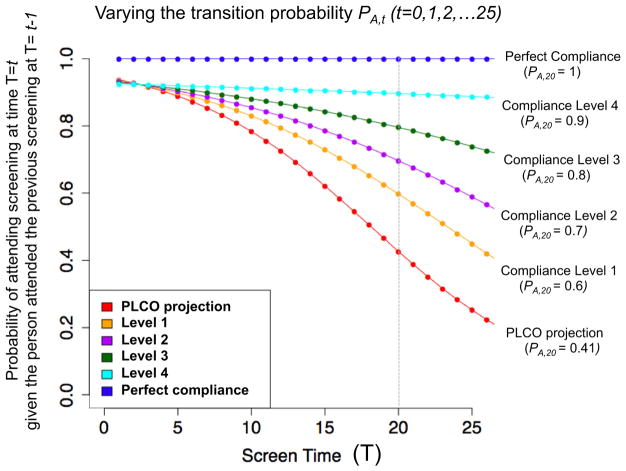
Results: Validation using PLCO shows that our model reproduces observed PLCO outcomes, predicting 884 LC cases [Expected(E)/Observed(O) = 0.99; CI 0.92-1.06] and 563 LC deaths (E/O = 0.94 CI 0.87-1.03) in the screening arm that has an average compliance rate of 87.9% over four annual screening rounds. We predict that perfect compliance to the USPSTF recommendation saves 501 LC deaths per 100,000 persons in the 1950 U.S. birth cohort; however, assuming that compliance behaviors extrapolated and varied from PLCO reduces the number of LC deaths avoided to 258, 230, and 175 as the average compliance rate over 26 annual screening rounds changes from 100 to 46, 39, and 29%, respectively.

Conclusion: The implementation of the USPSTF recommendation is expected to contribute to a reduction in LC deaths, but the magnitude of the reduction will likely be heavily influenced by screening compliance.

Keywords: CISNET; CT screening; Lung cancer; Microsimulation; NLST; Public health policy; USPSTF.


Figures

Fig. 1
Fig. 1
Diagram for a Markov model for screening compliance. The numbers in red are the estimates of transition probabilities using the PLCO data. Note In this Markov model, there are two possible states, “attend” or “not attend” and these states are influenced by the states of the previous year. The state of the first screening attendance is decided by initial probability p0 = 0.948 that is estimated using the attendance rate of the first screening from the PLCO data. The state of the second screening is then decided, informed by the state of the first screening. Among those who attended (A) the first screening, the attendance probability of the second screening is pA,1 = 0.904 (PLCO estimation) and 1- pA,1 (= 0.096) for probability of not attending the second screening. For those who did not attend (NA) the first screening, the attendance probability of the second screening is pNA,1 = 0.673 (PLCO estimation). The states of the third through fourth screening are also decided by the states of the screening of the previous year. The PLCO data have only four screenings (T = 0, 1, 2, and 3), and hence transition probabilities estimated based on four years were extrapolated for T ≥ to be used for evaluating the impact of the lifetime USPSTF-recommended screen program and varied for sensitivity analysis (see Methods “Evaluation of the USPSTF-recommended and the NLST-like screening program with lifetime screening and follow-up”)
Fig. 2
Fig. 2
Model calibration results using the NLST data for CT arm. Cumulative lung cancer incidence and mortality over study time. Observed data are in blue and predicted data are in red. Dotted lines are 95% confidence interval. First row is for lung cancer incidence and second row is for lung cancer death
Fig. 3
Fig. 3
Model validation results using the PLCO data for CXR arm. Cumulative lung cancer incidence and mortality over study time. Observed data are in blue and predicted data are in red. Dotted lines are 95% confidence interval. First row is for lung cancer incidence and second row is for lung cancer death
Fig. 4
Fig. 4
Varying the levels of transition probability pA, t (t = 0, 1, 2,.., 25) in a Markov model for screening compliance for sensitivity analysis. The results on this sensitivity analysis are shown in Table 2. Note: PA, t is the probability of attending the screening at each time T = t (t = 1, 2,…, 25) given the person attended the previous screening at time T = t-1(transition probability). The red curve is the transition probability (pA, t) extrapolated based on the estimation using the PLCO data that have only four screenings (T = 0, 1, 2, and 3), and hence data points for T4 were predicted based on the log-transformed regression (see “Evaluation of the USPSTF-recommended and the NLST-like screening program with lifetime screening and follow-up”). In order to take into account uncertainty raised from this extrapolation, we conducted sensitivity analysis varying the levels of pA, t over t. The orange curve obtained by fitting log-transformed regression by including one hypothetical data point at t = 20 with a value pA, 20 = 0.6 (increased from pA, 20 = 0.41 in the red curve for the PLCO projection). Similarly, Level 2, Level 3, and Level 4 curves were obtained by restraining the value of pA, 20 as 0.7, 0.8, and 0.9, respectively. Finally the top blue line is the transition probability under perfect compliance

References

    1. Carbone D. Smoking and cancer. Am J Med. 1992;93:S13–S17. - PubMed
    1. Aberle D, Adams A, Berg C, et al. Reduced lung-cancer mortality with low-dose computed tomographic screening. N Eng J Med. 2011;365:395. - PMC - PubMed
    1. Moyer VA. Screening for lung cancer: US preventive services task force recommendation statement. Ann Intern Med. 2014;160:330–338. - PubMed
    1. de Koning HJ, Meza R, Plevritis SK, et al. Benefits and harms of computed tomography lung cancer screening strategies: a comparative modeling study for the US preventive services task force. Ann Intern Med. 2014;160:311–320. - PMC - PubMed
    1. Meza R, Haaf K, Kong CY, et al. Comparative analysis of 5 lung cancer natural history and screening models that reproduce outcomes of the NLST and PLCO trials. Cancer. 2014;120:1713–1724. - PMC - PubMed