. 2017 Jul 13:8:16068.
doi: 10.1038/ncomms16068.

Flat clathrin lattices are dynamic actin-controlled hubs for clathrin-mediated endocytosis and signalling of specific receptors

Affiliations

Flat clathrin lattices are dynamic actin-controlled hubs for clathrin-mediated endocytosis and signalling of specific receptors

Daniela Leyton-Puig et al. Nat Commun. .

Abstract

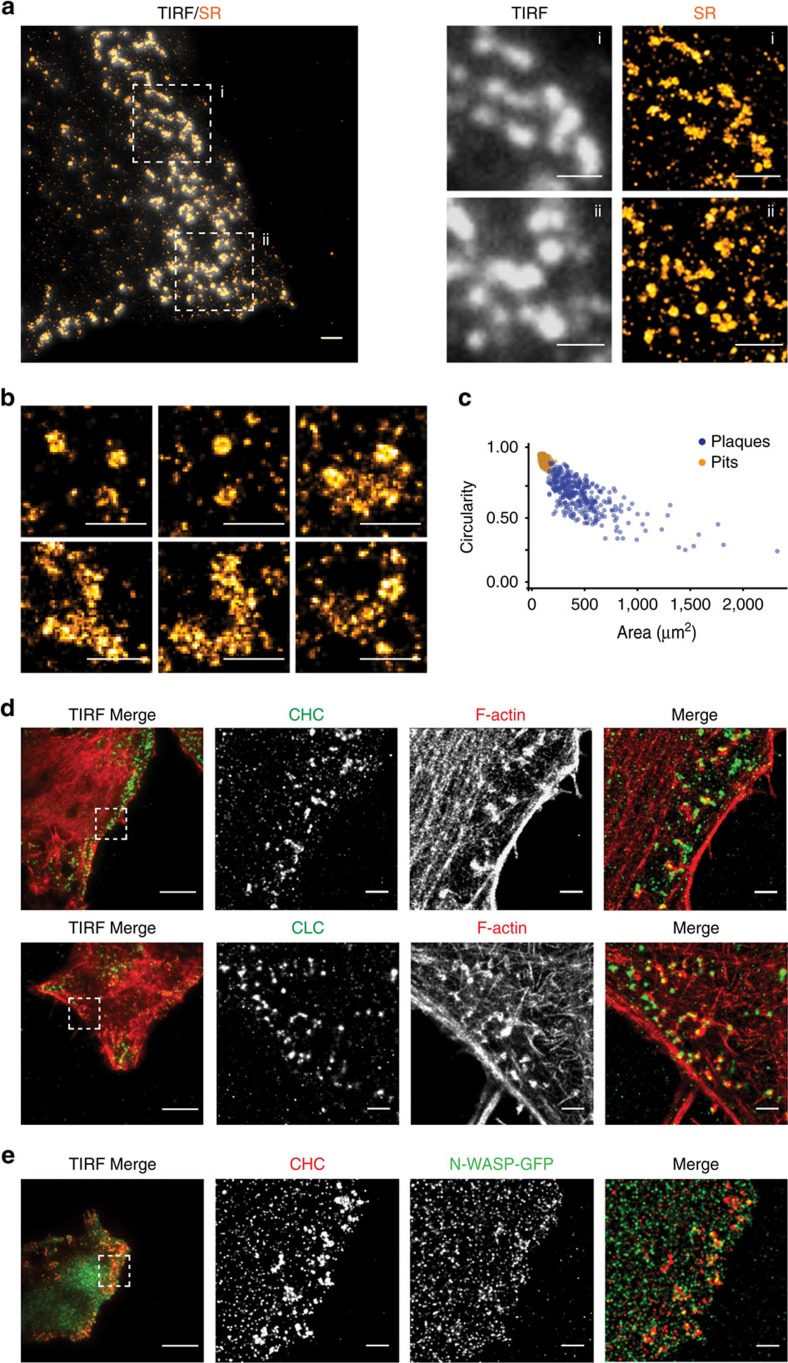
Clathrin lattices at the plasma membrane coat both invaginated and flat regions forming clathrin-coated pits and clathrin plaques, respectively. The function and regulation of clathrin-coated pits in endocytosis are well understood but clathrin plaques remain enigmatic nanodomains. Here we use super-resolution microscopy, molecular genetics and cell biology to show that clathrin plaques contain the machinery for clathrin-mediated endocytosis and cell adhesion, and associate with both clathrin-coated pits and filamentous actin. We also find that actin polymerization promoted by N-WASP through the Arp2/3 complex is crucial for the regulation of plaques but not pits. Clathrin plaques oppose cell migration and undergo actin- and N-WASP-dependent disassembly upon activation of LPA receptor 1, but not EGF receptor. Most importantly, plaque disassembly correlates with the endocytosis of LPA receptor 1 and down-modulation of AKT activity. Thus, clathrin plaques serve as dynamic actin-controlled hubs for clathrin-mediated endocytosis and signalling that exhibit receptor specificity.


Conflict of interest statement

The authors declare no competing financial interests.

Figures

Figure 1
Figure 1. SR microscopy enables in-depth characterization of clathrin-coated structures.
(a) Representative correlative TIRF-SR image of the CCSs on the basal membrane of HeLa cells. HeLa cells were fixed and stained with anti-clathrin heavy chain (CHC) antibodies as indicated in the Methods. Overlay of the TIRF (grey) and the SR (orange) images and zoomed-in regions (i, ii) are depicted. Scale bar, 1 μm. (b) Gallery of SR images showing the diversity of the CCSs (pits, plaques and combination thereof) found on the basal membrane of HeLa cells. Scale bar, 1 μm. (c) Morphometric analysis of CCSs on the basal membrane of HeLa cells. Circularity (1=high circularity, 0=high asymmetry) and surface area (μm2) of individual CCS were obtained as described in the Methods. (d) Actin associates with CCSs. Representative two-colour TIRF and SR images of F-actin (red in merge) with either CHC or CLC tagged with mTurquoise2 (CLC-mTQ2) (green in merge). HeLa cells were fixed and stained with anti-CHC or anti-GFP antibodies and phalloidin to detect CCSs and F-actin, respectively. CLC-mTQ2 was transfected as described in the Methods. Scale bar, 1 μm. (e) N-WASP associates with CCSs. Representative two-colour TIRF and SR images of CHC (red in merge) and N-WASP tagged with GFP (N-WASP-GFP, green in merge). HeLa cells were transfected, processed and imaged as illustrated above. Scale bar, 1 μm.
Figure 2
Figure 2. N-WASP is a key plaque regulator.
(a) Characterization of control (CTR) knockdown (KD) and N-WASP KD HeLa cells. Total cell lysates were compared using the indicated antibodies. One of three experiments that were performed with similar results is shown. (b) N-WASP regulates the association between CCSs and F-actin. Representative two-colour SR images of control (CTR) KD and N-WASP KD cells stained for CHC (green in merge) and F-actin (red in merge). Dashed white boxes mark the position of the zoom-in. Scale bar, 1 μm. (c) Knockdown of N-WASP increases plaque presence on the basal membrane. Representative TIRF and SR images of CHC on the basal membrane of control (CTR) KD and N-WASP KD cells. Scale bar TIRF, 10 μm. Scale bar SR, 1 μm. (d) Bar graphs show the number of pits per μm2 and percentage of total area of the ROI covered by plaques (plaque covered area). ROIs were defined as three μm-wide regions on the periphery of the cells and segmented for quantification (mean±s.e.m., **P<0.01, t-test, ns=not significant). (e) Representative TIRF and SR images of CHC in N-WASP KD cells transfected with full-length shRNA-resistant N-WASP tagged with GFP (N-WASP-GFP). Scale bar TIRF, 10 μm; SR, 1 μm. (f) Number of pits and plaque-covered area were obtained as above (mean±s.e.m., ****P<0.0001, t-test, ns, not significant).
Figure 3
Figure 3. Actin polymerization controlled by N-WASP and the Arp2/3 complex has a key role in regulating plaques but not pits.
(a) Schematic of N-WASP and mutants thereof (asterisk=H208D mutation). Supplementary Fig. 1c decodes abbreviations. (b) Representative TIRF and SR images of CHC on the basal membrane of cells expressing the GFP-tagged N-WASP mutants described in a. Scale bar TIRF, 10 μm; SR, 1 μm. (c) Active N-WASP regulates plaques through its VCA, WH1 and PRD domains. Bar graph shows normalized plaque covered area (mean±s.e.m., **P<0.01, ***P<0.001, ****P<0.0001, one-way ANOVA, ns, not significant). (d) Localization of N-WASP at plaques requires active N-WASP, the WH1 and the PRD domains. Bar graph shows coordinate-based colocalization (CBC) for the association between plaques and the N-WASP mutants or GFP (mean±s.e.m., ***P<0.001, ****P<0.0001, one-way ANOVA). (e) Neither N-WASP nor its mutants perturb pits. Bar graph shows normalized number of pits (mean±s.e.m., one-way ANOVA, ns=not significant). (f) Localization of N-WASP at pits requires active N-WASP, the WH1 and the PRD domains. Bar graph shows the CBC for the association between pits and the N-WASP mutants or GFP (mean±s.e.m., ****P<0.0001, one-way ANOVA, ns=not significant). (g) Characterization of ArpC2 KD HeLa cells. Control (CTR) KD and ArpC2 KD cells (#1 and #2 obtained using different hairpins) were compared using the indicated antibodies. One of two similar experiments is shown. (h) The Arp2/3 complex controls CCS morphology. Representative TIRF and SR images of CHC on the basal membrane of the above-characterized cells. Scale bar TIRF, 10 μm; SR, 1 μm. (i) Knockdown of the Arp2/3 complex phenocopies that of N-WASP. Bar graphs show number of pits per μm2 and plaque covered area (mean±s.e.m., *P<0.05, **P<0.01, one-way ANOVA, ns=not significant). (j) N-WASP regulates plaques through the Arp2/3 complex. Bar graph shows plaque covered area in ArpC2 KD cells transfected with N-WASP-GFP or GFP (mean±s.e.m., one-way ANOVA, ns=not significant).
Figure 4
Figure 4. Plaques remodel in response to external stimuli.
(a) Representative SR images of the basal membrane of control (CTR) KD and N-WASP KD HeLa cells grown in either 0.1 or 10% serum and stained with anti-CHC antibodies to detect CHC. Scale bar, 1 μm. (b) Serum affects the presence of plaques, but not that of pits. Bar graph shows number of pits per μm2 and plaque covered area (percentage) of cells grown in either 0.1 or 10% serum (mean±s.e.m., **P<0.01, ****P<0.0001, t-test, ns=not significant). (c) Plaques rapidly respond to serum stimulation. Bar graph shows number of pits per μm2 and plaque covered area of serum-starved cells stimulated with 10% serum for 3, 7, 15, 30 and 60 min (mean±s.e.m.). (d) The knockdown of N-WASP increases the persistence of CCSs in cells stimulated with serum. Representative images of live-cell TIRF movies of control (CTR) KD and N-WASP KD cells expressing CLC-RFP, stimulated with 10% serum at time 0. Bar graph shows CCS track duration (sec.=seconds, mean±s.e.m., ****P<0.0001, t-test). Scale bar, 1 μm. (e) LPA recapitulates the effects of serum on plaques. Representative SR images control (CTR) KD cells that were serum starved and stimulated with 100 ng ml−1 EGF, 5 μM LPA or 10% FCS for 30 min or left untreated (NS) and subsequently stained for CHC. Scale bar, 1 μm. (f) Bar graphs show number of pits per μm2 and plaque covered area (mean±s.e.m., ***P<0.001, one-way ANOVA, ns=not significant). (g) LPAR1 mediates the effects of LPA on plaques. Representative SR images of CHC on the basal membrane of control (CTR) KD and LPAR1 KD HeLa cells (#1 and #2 obtained using different hairpins). Scale bar, 1 μm. (h) Bar graphs show number of pits per μm2 and plaque covered area (mean±s.e.m., **P<0.01, t-test, ns=not significant).
Figure 5
Figure 5. Plaques are sites of pit formation.
(a) CCSs exhibit different dynamics and fate. Three representative kymographs of large CCSs from live-cell TIRF movies of HeLa cells expressing CLC-RFP that were serum starved overnight and then stimulated with 10% serum. CCSs can dissociate into smaller structures (i and ii) or fluctuate (iii). Time (t) is in seconds (s). Representative stages are shown below each kymograph. (b) Plaques are sites of pit formation. Two representative 3D SR image slices of HeLa cells stained for CHC showing CCVs (whose position is marked by arrowheads in the Z stacks) in areas covered by plaques. Scale bar, 1 μm. (c) Inhibition of dynamin perturbs the morphology of CCSs. Representative 3D SR image slices of HeLa cells treated with DMSO or the dynamin inhibitor Dynasore (80 μM, 30 min) stained for CHC. Arrowheads mark pits in the Z stacks. Scale bar, 1 μm. (d) Representative SR images of HeLa cells treated with DMSO or the dynamin inhibitor Dynasore (80 μM, 30 min) stained for CHC. Scale bar, 1 μm. (e) Inhibition of dynamin reduces plaques and increases pit number. Bar graph shows number of pits per μm2 and plaque covered area (percentage) (mean±s.e.m., ***P<0.001, ****P<0.0001, t-test).
Figure 6
Figure 6. LPAR1 and EGFR are recruited to plaques.
(a) Activated EGFR is recruited to CCSs. Representative two-colour SR images of control (CTR) KD and N-WASP KD cells stained for CHC (red in merge) and EGFR (green in merge). Cells were stimulated with 100 ng ml−1 EGF for 5 min. Scale bar, 1 μm. Bar graph shows CBC for the association of EGFR with either pits or plaques before and after EGF stimulation (mean±s.e.m., *P<0.05, **P<0.01, ****P<0.0001, t-test). (b) Activated LPAR1 is recruited to CCSs. Representative two-colour SR images of control (CTR) KD and N-WASP KD cells stably expressing LPAR1-GFP stained for CHC (red in merge) and GFP (green in merge). Cells were stimulated with 5 μM LPA for 5 min. Scale bar, 1 μm. Bar graph shows CBC for the association of EGFR with either pits or plaques before and after LPA stimulation (mean±s.e.m., ***P<0.001, ****P<0.0001, t-test). (c) Internalization of EGFR and LPAR1 is impaired in cells lacking N-WASP. Graphs show internalization level of EGFR and LPAR1 measured as the ratio of EPI images versus TIRF images of control (CTR) KD and N-WASP KD cells after stimulation with EGF or LPA, respectively, for 3, 7, 15, 30 and 60 min (mean±s.e.m., *P<0.05, **P<0.01, ***P<0.001, ****P<0.0001, one-way ANOVA).
Figure 7
Figure 7. Plaques are hubs for clathrin-mediated endocytosis and signalling of LPAR1.
(a) Knockdown of N-WASP does not perturb the activation of AKT or ERK induced by EGF. Serum-starved control (CTR) KD and N-WASP KD HeLa cells were left untreated (0) or stimulated with 100 ng ml−1 EGF as indicated. Total cell lysates were analysed with the indicated antibodies. One of three similar experiments is shown. (b) Knockdown of N-WASP induces hyper-activation of AKT after LPA stimulation. Serum-starved control (CTR) KD and N-WASP KD HeLa cells were left untreated (0) or stimulated with 5 μM LPA as indicated. Total cell lysates were analysed with the indicated antibodies. One of three similar experiments is shown. (c) Knockdown of N-WASP increases PIP3 formation after LPA but not EGF stimulation. Representative PIP3 formation tracking images using a PIP3 sensor (GRP1) tagged with GFP in live cell confocal images of control (CTR) KD and N-WASP KD HeLa cells stimulated with 100 ng ml−1 EGF and 5 μM LPA. Scale bar, 10 μm. Representative traces (one cell per trace) of brightness ratio between membrane and cytoplasm (M/C ratio). Bar graph shows percentage of responsive cells (mean±s.e.m., ***P<0.001, t-test). (d) Activated LPAR1 is recruited to CCSs, and its internalization is impaired in cells lacking N-WASP. Representative images of two-colour live cell TIRF movies of control (CTR) KD and N-WASP KD cells expressing CLC-RFP (red in merge) and LPAR1-GFP (green in merge), before and after stimulation with 5 μM LPA. Scale bar, 10 μm. (e) Graph shows LPAR1-GFP enrichment in CLC-RFP positive structures in control (CTR) KD and N-WASP KD cells. (f) Representative kymographs of non-diffraction limited structures selected in the CLC-RFP channel of two-colour live cell TIRF movies showing CLC-RFP (red) and LPAR1-GFP (green) of control (CTR) KD and N-WASP KD HeLa cells, before and after stimulation with 5 μM LPA. (g) Knockdown of Arpc2 induces hyper-activation of AKT after LPA stimulation. Serum-starved control (CTR) KD and Arpc2 KD cells were stimulated with 5 μM LPA for 5 min. Total cell lysates were analysed with the indicated antibodies. One of two similar experiments is shown.

Similar articles

Cited by

References

    1. McMahon H. T. & Boucrot E. Molecular mechanism and physiological functions of clathrin-mediated endocytosis. Nat. rev. Mol. cell biol. 12, 517–533 (2011). - PubMed
    1. Ehrlich M. et al.. Endocytosis by random initiation and stabilization of clathrin-coated pits. Cell 118, 591–605 (2004). - PubMed
    1. Laroche G., Rochdi M. D., Laporte S. A. & Parent J. L. Involvement of actin in agonist-induced endocytosis of the G protein-coupled receptor for thromboxane A2: overcoming of actin disruption by arrestin-3 but not arrestin-2. J. biol. chem. 280, 23215–23224 (2005). - PubMed
    1. Wolfe B. L. & Trejo J. Clathrin-dependent mechanisms of G protein-coupled receptor endocytosis. Traffic 8, 462–470 (2007). - PubMed
    1. Fujimoto L. M., Roth R., Heuser J. E. & Schmid S. L. Actin assembly plays a variable, but not obligatory role in receptor-mediated endocytosis in mammalian cells. Traffic 1, 161–171 (2000). - PubMed

Publication types

MeSH terms

Substances

LinkOut - more resources