. 2017 Jul 13:8:16072.
doi: 10.1038/ncomms16072.

Structural insights into the mycobacteria transcription initiation complex from analysis of X-ray crystal structures

Affiliations

Structural insights into the mycobacteria transcription initiation complex from analysis of X-ray crystal structures

Elizabeth A Hubin et al. Nat Commun. .

Abstract

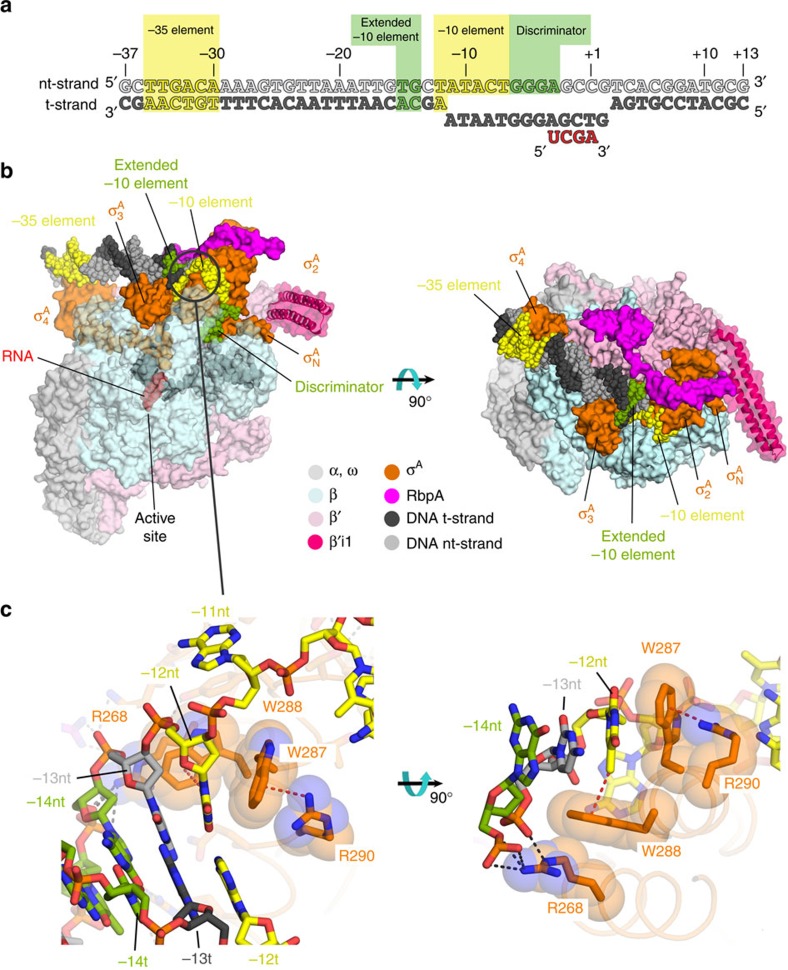
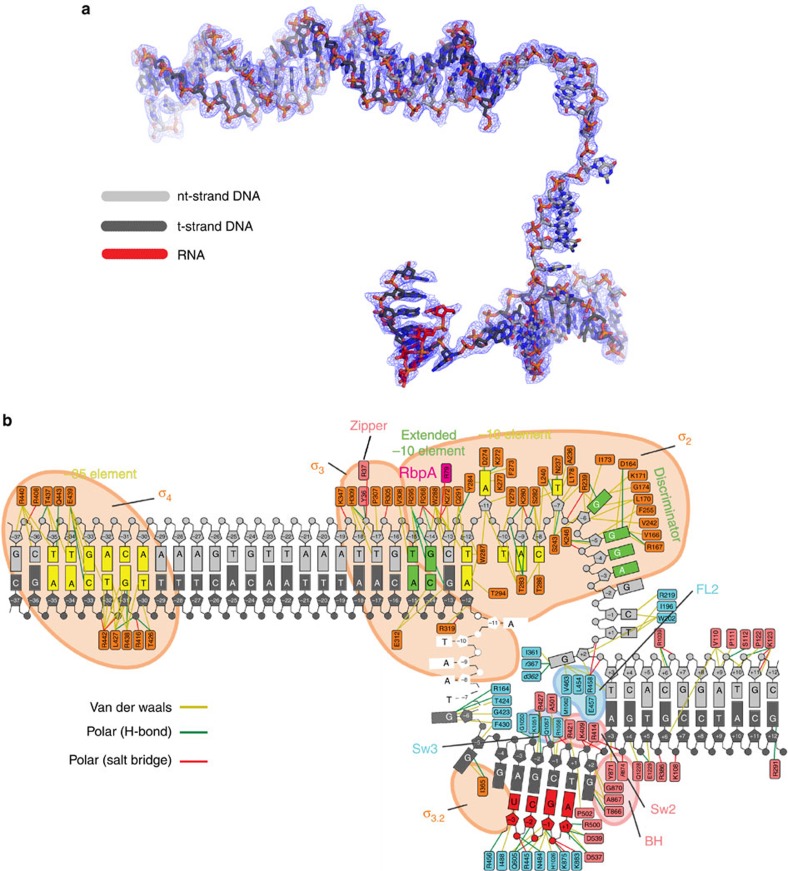
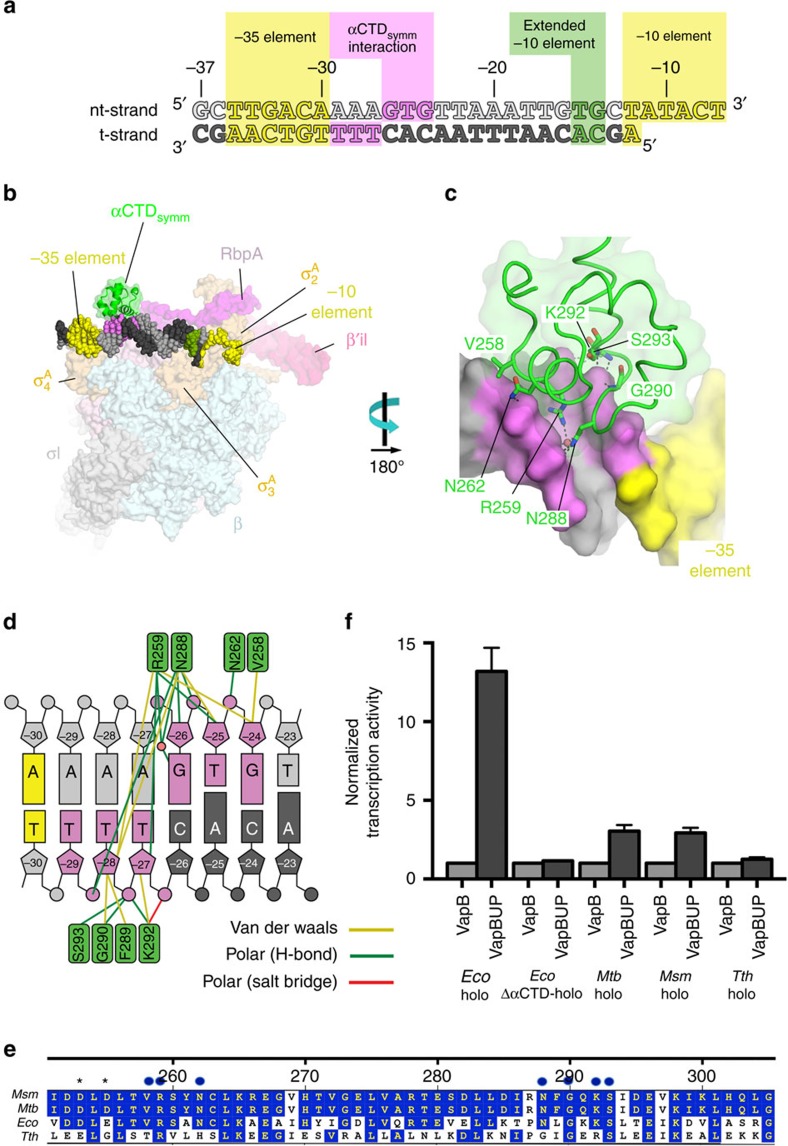
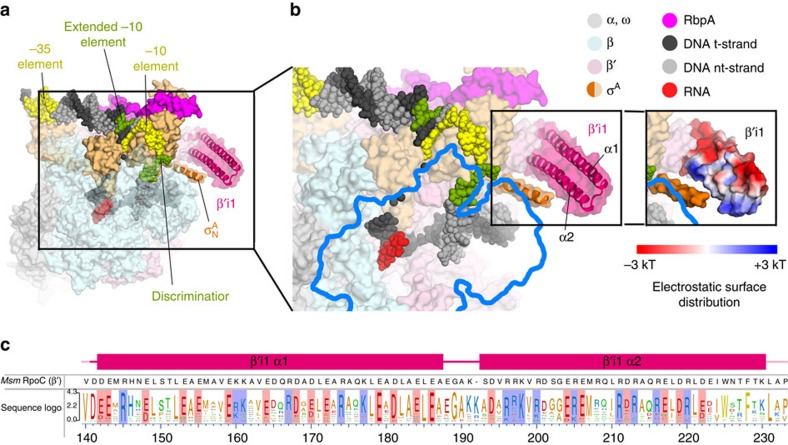
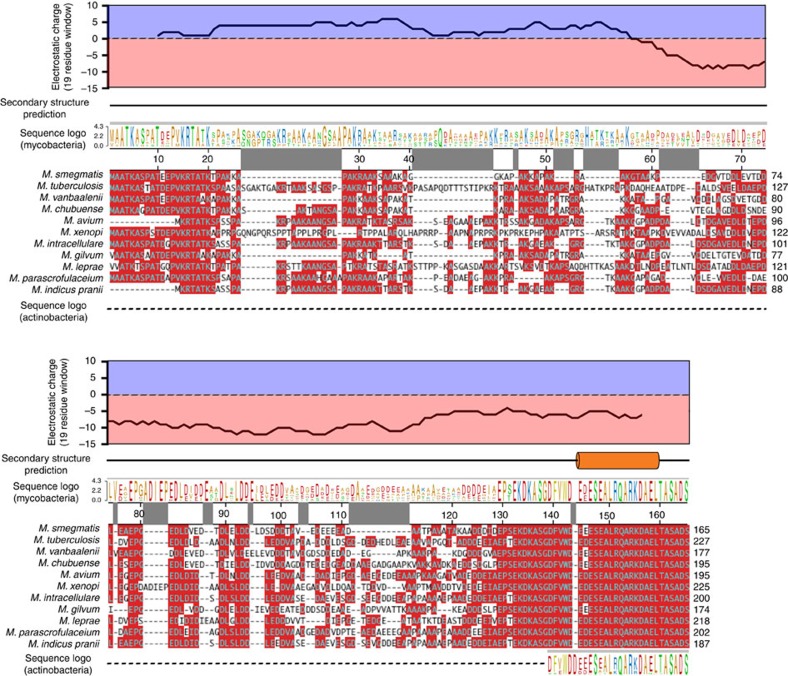
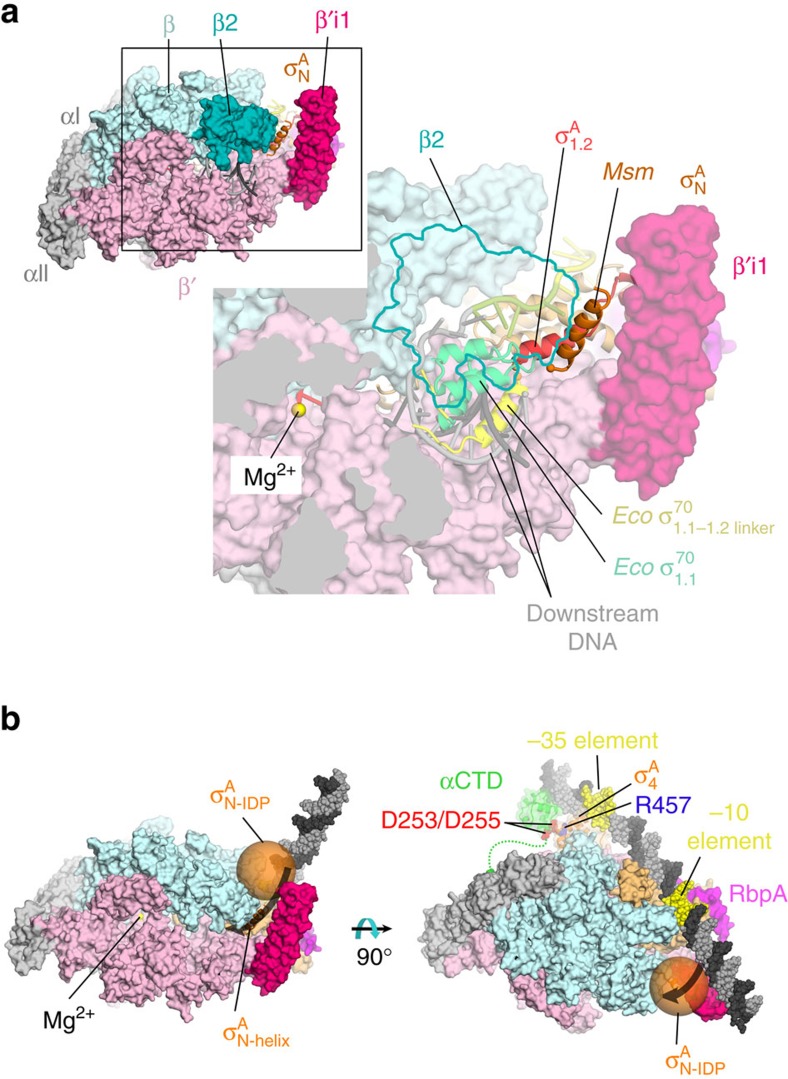
The mycobacteria RNA polymerase (RNAP) is a target for antimicrobials against tuberculosis, motivating structure/function studies. Here we report a 3.2 Å-resolution crystal structure of a Mycobacterium smegmatis (Msm) open promoter complex (RPo), along with structural analysis of the Msm RPo and a previously reported 2.76 Å-resolution crystal structure of an Msm transcription initiation complex with a promoter DNA fragment. We observe the interaction of the Msm RNAP α-subunit C-terminal domain (αCTD) with DNA, and we provide evidence that the αCTD may play a role in Mtb transcription regulation. Our results reveal the structure of an Actinobacteria-unique insert of the RNAP β' subunit. Finally, our analysis reveals the disposition of the N-terminal segment of Msm σA, which may comprise an intrinsically disordered protein domain unique to mycobacteria. The clade-specific features of the mycobacteria RNAP provide clues to the profound instability of mycobacteria RPo compared with E. coli.


Conflict of interest statement

The authors declare no competing financial interests.

Figures

Figure 1
Figure 1. Structure of the Msm RbpA/RPo.
(a) Synthetic oligonucleotides used for the Msm RbpA/RPo crystallization. The numbers above denote the DNA position with respect to the RNA transcript 3′-end (+1). The DNA sequence is derived from the full con promoter. The nt-strand DNA (top strand) is coloured light grey; the t-strand DNA (bottom strand), dark grey; RNA, red. The −35 and −10 elements are shaded yellow. The extended −10 (ref. 38) and discriminator elements are coloured green. (b) Overall structure of the Msm RbpA/RPo. The color-coding of most of the structural features is denoted in the legend. Protein components (core RNAP, σA, RbpA) are shown as molecular surfaces. The surface of the RNAP β subunit is transparent, revealing the nucleic acids and σA elements located in the RNAP active centre cleft. The surface of the lineage-specific insert β′i1 is transparent, revealing the α-carbon backbone ribbon underneath. The nucleic acids are shown as CPK atoms, coloured as in Fig. 1a. The circled region in the left view is magnified in Fig. 1c. (c) Magnified views showing the upstream ds/ss junction of the transcription bubble in RPo (obscuring elements of the structure have been removed). Side chains of the absolutely conserved σA W-dyad (W288/W287) and conserved σA Arg residues that buttress the W-dyad (R268, R290) are shown in orange along with transparent CPK spheres (Supplementary Fig. 2D). Polar interactions (hydrogen bonds, salt bridges) are shown as grey dashed lines. The cation-π interaction (R290-W287) and the methyl-π interaction [T−12(nt)-W288] are shown as red dashed lines.
Figure 2
Figure 2. Msm RPo electron density and protein–DNA interactions.
(a) Electron density and model for RPo nucleic acids. Blue mesh, 3.2 Å resolution 2FoFc map for nucleic acids (contoured at 1.0σ). (b) The nucleic acids shown are from the RPo structure (Fig. 1a). The protein–DNA interactions for the −10 element and upstream were derived from the 2.76 Å-resolution Msm RbpA/EσA/us-fork complex (PDB ID 5VI8), but only a small handful of these interactions differed in the 3.2 Å-resolution RPo structure. The protein/nucleic acid interactions for nucleic acids downstream of the −10 element were derived from the 3.2 Å-resolution RPo structure (Figs 1b and 2a). The t-strand DNA from −7 to −11 was disordered and not modelled. Protein/DNA interactions were defined as follows: van der Waals (≤ 4.5 Å), yellow lines; H-bonds (≤ 3.5 Å); salt bridges (≤ 4.5 Å), red lines.
Figure 3
Figure 3. Mycobacteria αCTD/DNA interactions.
(a) Sequence of the us-fork promoter fragment used in the 2.76 Å-resolution Msm TIC structure. The numbers above denote the DNA position with respect to the transcription start site (+1). The DNA sequence is derived from the full con promoter. The nt-strand DNA (top strand) is coloured light grey; the t-strand DNA (bottom strand), dark grey. The −35 and −10 elements are shaded yellow. The extended −10 (ref. 38) is coloured green. The DNA nts interacting with a symmetry-related αCTD (αCTDsymm) are coloured violet. (b) Overall view of the Msm RbpA/EσA/us-fork complex. The color-coding is the same as Fig. 1b. The RNAP is shown as a molecular surface. The DNA is shown in CPK format, color-coded as Fig. 2a. Also shown is αCTDsymm (green backbone ribbon with transparent green molecular surface). (c) Close-up of αCTDsymm/DNA interactions (viewed from the back side of Fig. 2b). The αCTDsymm is shown as a green backbone worm with conserved DNA-interacting side chains shown (polar interactions are shown as grey dashed lines). A well-ordered water molecule mediating αCTDsymm interactions is shown as a pink sphere. The DNA is shown as a molecular surface. (d) Schematic illustrating αCTDsymm/DNA interactions. (e) Sequence alignment of Msm, Mtb, Eco and Tth αCTDs. The numbering at the top denotes the Msm and Mtb numbering. Residues conserved in at least three of the seqences are shaded blue. Residues that interact with the DNA are denoted with blue dots above the sequences. The DNA-interacting residues are all conserved between Msm, Mtb, and Eco, but not with Tth. Negatively charged residues shown to be important for Eco αCTD/σ704 interactions that play a role in stimulating transcription are are denoted with asterisks (*) above. We infer that these residues also play a role in stimulatory Msm and Mtb αCTD/σA4 interactions as well since they are conserved as negatively charged residues in Msm and Mtb. (f) Histogram showing abortive transcription activity of various holoenzymes (shown below) on the Mtb VapB promoter (normalized to 1) and VapBUP (engineered to contain a proximal UP-element sequence (Supplementary Fig. 6B,C). The values are the average of triplicate experiments. The error bars denote the s.e.m.
Figure 4
Figure 4. The Actinobacteria β′i1.
(a) Overall view of the Msm RbpA/RPo. The color-coding of most of the structural features is denoted in the legend (Fig. 3b). Protein components (core RNAP, σA, RbpA) are shown as molecular surfaces. The surface of the RNAP β subunit is transparent, revealing the nucleic acids and σA elements located in the RNAP active centre cleft. The surfaces of σAN and the lineage-specific insert β′i1 are transparent, revealing the α-carbon backbone ribbons underneath. The nucleic acids are shown as CPK atoms. The boxed region is magnified in Fig. 3b. (b) Magnified view of the boxed region from Fig. 3a. Obscuring elements of the RNAP β subunit have been removed (outlined in blue), revealing the nucleic acids in the RNAP active site cleft. The boxed region shows β′i1, with the two α-helices (α1, α2) labelled. The boxed region on the right shows the same view of β′i1 but with the molecular surface coloured according to the electrostatic surface potential (red, −3 kT; blue, +3 kT), illustrating the asymmetric charge distribution. (c) The secondary structure of the Msm β′i1 (Msm β′ residues 141–230, Msm numbering shown at the bottom) is schematically illustrated (α-helices are shown as rectangles), with the Msm β′ sequence shown below. The sequence logo shown below was derived from a sequence alignment of 720 Msm β′i1 homologues (all Actinobacteria). Conserved negatively charged (D/E) and positively charged (K/R) positions on the α-helices are shaded red or blue, respectively. The α1 harbours 14 positions of conserved negative charge and 6 positions of conserved positive charge (net charge −8), while α2 harbours 7 positions of conserved negative charge and 9 positions of conserved positive charge (net charge +2).
Figure 5
Figure 5. Sequence characteristics of the σAN> of mycobacteria and Actinobacteria.
The Msm σAN (163 residues N-terminal of conserved region 1.2 (ref. 68)) is aligned with representative mycobacteria σAN sequences (the number scale on top of the alignment shows the Msm σA numbering). Residues conserved in more than half of the sequences are shaded red. The sequence logo shown above was derived from an alignment containing 45 mycobacteria σAN sequences. The predicted secondary structure for the Msm σAN is shown schematically above the logo. One α-helix is predicted (Msm σAN residues 144–159, orange cylinder), with the rest of the sequence lacking any secondary structure. The net electrostatic charge of the derived consensus sequence, calculated in a 19-residue window, is plotted at the top (net positive charge is shaded blue, negative charge shaded red). A sequence logo derived from the Msm σAN with 199 Actinobacteria σAN sequences (excluding other mycobacteria sequences) is shown below. The region corresponding to Msm σAN residues 139–165, which includes the predicted α-helix, was conserved with all Actinobacteria σAN sequences, while Msm σAN residues 1–138 (the region predicted to lack secondary structure) showed no sequence relationship with other Actinobacteria σAN sequences (except for other mycobacteria σAN sequences) and could not be aligned.
Figure 6
Figure 6. Structural and functional context of the Msm σAN.
(a) (upper left) Overall view of the Msm RbpA/RPo. The color-coding is the same as Fig. 1b except the β2 domain is coloured slate blue. The RNAP is shown as a molecular surface except σA is shown as a backbone ribbon. The nucleic acids are shown in cartoon format. The boxed region is magnified on the lower right. (lower right) Magnified view of the boxed region from the upper right. The β2 domain (outlined in blue) as well as other obscuring regions of the structure have been removed, revealing the RNAP active site cleft and the nucleic acids therein. The σA, shown as a backbone ribbon, is coloured light orange, except the σA1.2 N-terminal helix is coloured orange-red, and the σAN-α-helix is coloured orange. Shown in the downstream duplex DNA-binding channel is the superimposed position of Eco σ701.1 (light green) and the σ701.1–1.2 linker (yellow) from PDB ID 4LK1 (ref. 6). (b) Model of an Msm closed promoter complex (RPc or RP1) summarizing the role of the αCTD (green), β′i1 (hot pink), and σAN (orange) in RPo formation. The αCTD was modelled bound upstream of the −35 element, placing conserved negatively charged αCTD residues D253/D255 (Fig. 2e; shown as red CPK atoms) near conserved σA4 R457 (blue CPK atoms), inferring interactions analogous to Eco CTD D259/E261 with σ704 R603 (ref. 26). The σAN-helix is shown as an orange backbone ribbon as observed in the crystal structures (Fig. 5a). The rest of the σAN (approximately residues 1–143) is predicted to comprise an intrinsically disordered region (IDR) and is modelled as a (transparent orange) sphere with the expected radius (30 Å) of a Flory random coil for an IDR with κ (measurement of the extent of charge separation) of 0.42 (ref. 50). The sphere was placed to connect with the N-terminus of the σAN-helix and simultaneously minimize steric clashes. The combined placement of β′i1 and the σAN-IDR blocks the path the DNA must traverse to enter the active site cleft (indicated by thick black arrows).

References

    1. Chakraborty S. & Rhee K. Y. Tuberculosis drug development: history and evolution of the mechanism-based paradigm. Cold Spring Harb. Perspect. Med. 5, a021147 (2015). - PMC - PubMed
    1. Murakami K. S., Masuda S., Campbell E. A., Muzzin O. & Darst S. A. Structural basis of transcription initiation: an RNA polymerase holoenzyme-DNA complex. Science 296, 1285–1290 (2002). - PubMed
    1. Saecker R. M., Record M. T. Jr & deHaseth P. L. Mechanism of bacterial transcription initiation: RNA polymerase - promoter binding, isomerization to initiation-competent open complexes, and initiation of RNA synthesis. J. Mol. Biol. 412, 754–771 (2011). - PMC - PubMed
    1. Hubin E. A. et al. Structure and function of the mycobacterial transcription initiation complex with the essential regulator RbpA. Elife 6, e22520 (2017). - PMC - PubMed
    1. Zuo Y., Wang Y. & Steitz T. A. The mechanism of E. coli RNA polymerase regulation by ppGpp is suggested by the structure of their complex. Mol. Cell 50, 430–436 (2013). - PMC - PubMed

Publication types

MeSH terms

Substances

LinkOut - more resources