Clinical Trial
. 2017 Nov;57(11):1432-1443.
doi: 10.1002/jcph.955. Epub 2017 Jul 13.

The Effect of Renal Impairment on the Pharmacokinetics and Pharmacodynamics of Ertugliflozin in Subjects With Type 2 Diabetes Mellitus

Affiliations
Clinical Trial

The Effect of Renal Impairment on the Pharmacokinetics and Pharmacodynamics of Ertugliflozin in Subjects With Type 2 Diabetes Mellitus

V Sahasrabudhe et al. J Clin Pharmacol. 2017 Nov.

Abstract

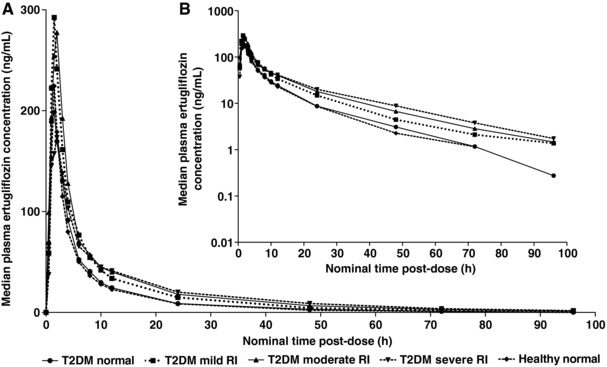
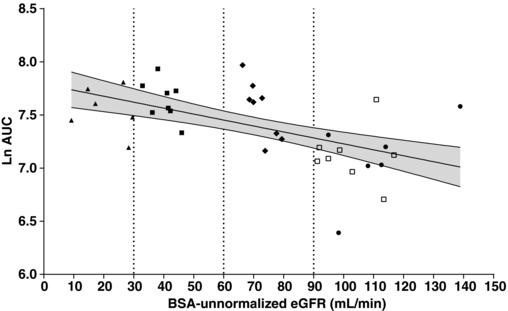
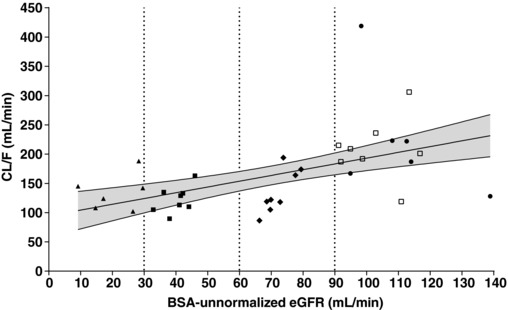
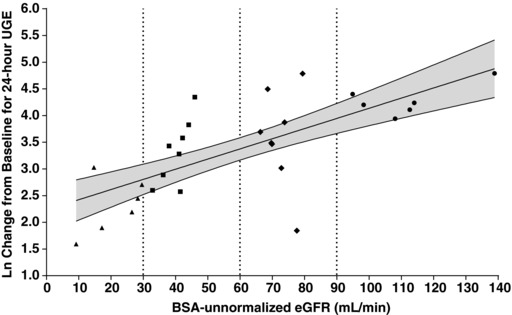
Ertugliflozin is a highly selective and potent inhibitor of the sodium-glucose cotransporter 2 in development for the treatment of type 2 diabetes mellitus. The glycemic efficacy of sodium-glucose cotransporter 2 inhibitors such as ertugliflozin depends on glucose filtration through the kidney. This phase 1, open-label study evaluated the effect of renal impairment on the pharmacokinetics, pharmacodynamics, and tolerability of ertugliflozin (15 mg) in type 2 diabetes mellitus and healthy subjects with normal renal function (estimated glomerular filtration rate not normalized for body surface area ≥90 mL/min) and type 2 diabetes mellitus subjects with mild (60-89 mL/min), moderate (30-59 mL/min), or severe (<30 mL/min) renal impairment (n = 36). Blood and urine samples were collected predose and over 96 hours postdose for pharmacokinetic evaluation and measurement of urinary glucose excretion over 24 hours. Log-linear regression analyses indicated predicted mean area under the concentration-time curve values for mild, moderate, and severe renal function groups that were ≤70% higher relative to subjects with normal renal function. Generally consistent results were obtained with categorical analysis based on analysis of variance. The increase in ertugliflozin exposure in subjects with renal impairment is not expected to be clinically meaningful. Regression analysis of change from baseline in urinary glucose excretion over 24 hours vs estimated glomerular filtration rate showed a decrease in urinary glucose excretion with declining renal function. A single 15-mg dose of ertugliflozin was well tolerated in all groups.

Keywords: ertugliflozin; renal impairment; sodium-glucose cotransporter 2; type 2 diabetes mellitus.


Figures

Figure 1
Figure 1
Median plasma ertugliflozin concentration‐time profiles following a single 15‐mg oral dose by renal function group. Plots show linear (A) and semilogarithmic (B) scales, respectively. Summary statistics were calculated by setting concentration values below the LLOQ to 0. The LLOQ was 0.500 ng/mL. Renal function groups were based on BSA‐unnormalized eGFR. Normal renal function, eGFR ≥90 mL/min; mild renal impairment, eGFR 60‐89 mL/min; moderate renal impairment, eGFR 30‐59 mL/min; severe renal impairment eGFR <30 mL/min. BSA indicates body surface area; eGFR, estimated glomerular filtration rate; h, hour; LLOQ, lower limit of quantification; RI, renal impairment; T2DM, type 2 diabetes mellitus.
Figure 2
Figure 2
Regression and 90%CI of Ln AUC vs BSA‐unnormalized eGFR after oral administration of ertugliflozin in subjects with varying degrees of renal function. R2 = 0.3142; Slope P‐value = .0004. Vertical lines represent the renal function group cutoff values. The solid line is the predicted line of the response variable. The shadowed area is the 90% confidence region of the response variable. AUC indicates area under the plasma concentration‐time profile from time 0 extrapolated to infinite time; BSA, body surface area; CI, confidence interval; eGFR, estimated glomerular filtration rate; Ln, natural logarithm; RI, renal impairment; T2DM, type 2 diabetes mellitus. Key to symbols: circles, T2DM with normal renal function (eGFR ≥90 mL/min); diamonds, T2DM with mild RI (eGFR 60‐89 mL/min); closed squares, T2DM with moderate RI (eGFR 30‐59 mL/min); triangles, T2DM with severe RI (eGFR <30 mL/min); open squares, healthy normal (eGFR ≥90 mL/min).
Figure 3
Figure 3
Regression and 90%CI of CL/F vs BSA‐unnormalized eGFR after oral administration of ertugliflozin in subjects with varying degrees of renal function. R2 = 0.2730; Slope P‐value = .0011. Vertical lines represent the renal function group cutoff values. The solid line is the predicted line of the response variable. The shadowed area is the 90% confidence region of the response variable. BSA indicates body surface area; CL/F, apparent clearance; CI, confidence interval; eGFR, estimated glomerular filtration rate; RI, renal impairment; T2DM, type 2 diabetes mellitus. Key to symbols: circles, T2DM with normal renal function (eGFR ≥90 mL/min); diamonds, T2DM with mild RI (eGFR 60‐89 mL/min); closed squares, T2DM with moderate RI (eGFR 30‐59 mL/min); triangles, T2DM with severe RI (eGFR <30 mL/min); open squares, healthy normal (eGFR ≥90 mL/min).
Figure 4
Figure 4
Plot of Ln change from baseline for 24‐hour urinary glucose excretion vs BSA‐unnormalized eGFR in subjects with T2DM after administration of a single 15‐mg oral dose of ertugliflozin. R2 = 0.5036; Slope P‐value < .0001. The solid line is the predicted line of the Ln (change from baseline in 24‐hour UGE). The shadowed area is the 90% confidence region for the Ln (change from baseline in 24‐hour UGE). Vertical lines represent the renal function group cutoff values. BSA indicates body surface area; eGFR, estimated glomerular filtration rate; Ln, natural logarithm; RI, renal impairment; T2DM, type 2 diabetes mellitus; UGE, urinary glucose excretion. Key to symbols: circles, T2DM with normal renal function (eGFR ≥90 mL/min); diamonds, T2DM with mild RI (eGFR 60‐89 mL/min); closed squares, T2DM with moderate RI (eGFR 30‐59 mL/min); triangles, T2DM with severe RI (eGFR <30 mL/min).

References

    1. de Boer IH, Rue TC, Hall YN, et al. Temporal trends in the prevalence of diabetic kidney disease in the United States. JAMA. 2011;305:2532–2539. - PMC - PubMed
    1. Tuttle KR, Bakris GL, Bilous RW, et al. Diabetic kidney disease: a report from an ADA Consensus Conference. Am J Kidney Dis. 2014;64:510–533. - PubMed
    1. Wu B, Bell K, Stanford A, et al. Understanding CKD among patients with T2DM: prevalence, temporal trends, and treatment patterns—NHANES 2007‐2012. BMJ Open Diabetes Res Care. 2016;4:e000154. - PMC - PubMed
    1. Wright EM, Loo DD, Hirayama BA. Biology of human sodium glucose transporters. Physiol Rev. 2011;91:733–794. - PubMed
    1. Abdul‐Ghani MA, Norton L, DeFronzo RA. Renal sodium‐glucose cotransporter inhibition in the management of type 2 diabetes mellitus. Am J Physiol Renal Physiol. 2015;309:F889–F900. - PMC - PubMed

Publication types