. 2017 Jul 13;13(7):e1006886.
doi: 10.1371/journal.pgen.1006886. eCollection 2017 Jul.

Mouse models of 17q21.31 microdeletion and microduplication syndromes highlight the importance of Kansl1 for cognition

Affiliations

Mouse models of 17q21.31 microdeletion and microduplication syndromes highlight the importance of Kansl1 for cognition

Thomas Arbogast et al. PLoS Genet. .

Abstract

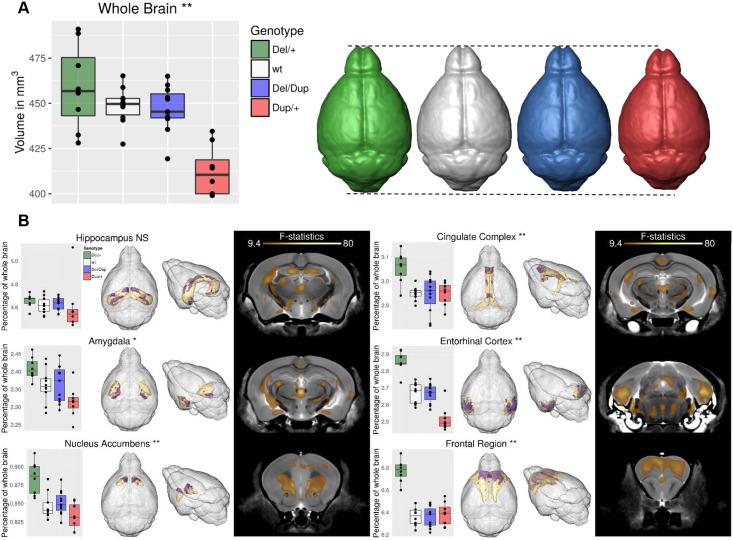
Koolen-de Vries syndrome (KdVS) is a multi-system disorder characterized by intellectual disability, friendly behavior, and congenital malformations. The syndrome is caused either by microdeletions in the 17q21.31 chromosomal region or by variants in the KANSL1 gene. The reciprocal 17q21.31 microduplication syndrome is associated with psychomotor delay, and reduced social interaction. To investigate the pathophysiology of 17q21.31 microdeletion and microduplication syndromes, we generated three mouse models: 1) the deletion (Del/+); or 2) the reciprocal duplication (Dup/+) of the 17q21.31 syntenic region; and 3) a heterozygous Kansl1 (Kans1+/-) model. We found altered weight, general activity, social behaviors, object recognition, and fear conditioning memory associated with craniofacial and brain structural changes observed in both Del/+ and Dup/+ animals. By investigating hippocampus function, we showed synaptic transmission defects in Del/+ and Dup/+ mice. Mutant mice with a heterozygous loss-of-function mutation in Kansl1 displayed similar behavioral and anatomical phenotypes compared to Del/+ mice with the exception of sociability phenotypes. Genes controlling chromatin organization, synaptic transmission and neurogenesis were upregulated in the hippocampus of Del/+ and Kansl1+/- animals. Our results demonstrate the implication of KANSL1 in the manifestation of KdVS phenotypes and extend substantially our knowledge about biological processes affected by these mutations. Clear differences in social behavior and gene expression profiles between Del/+ and Kansl1+/- mice suggested potential roles of other genes affected by the 17q21.31 deletion. Together, these novel mouse models provide new genetic tools valuable for the development of therapeutic approaches.


Conflict of interest statement

The authors have declared that no competing interests exist.

Figures

Fig 1
Fig 1. Mouse models of 17q21.31 rearrangements.
(A) Top: haplotype H1 of the human 17q21.31 region. All genomic positions are given according to the UCSC human genome browser GRCh38/hg38. Bottom: 17q21.31 syntenic region on mouse chromosome 11E1. All genomic positions are given according to UCSC mouse genome browser GRCm38/mm10. (B) Strategy for in vivo Cre-mediated recombination and targeted meiotic recombination (TAMERE) crossing strategy. LoxP sites were inserted upstream of Arf2 and downstream of Kansl1. The breeding strategy aimed to have trans-loxer females expressing the Hprttm1(cre)Mnn transgene and carrying the two loxP sites in a trans configuration. The last step consisted of mating trans-loxer females with wt males to generate progeny carrying the deletion (Del/+) or the duplication (Dup/+) of the Arf2-Kansl1 region. Del/+ and Dup/+ animals were crossed together to generate Del-Dup cohorts. (C) Molecular validation. PCR products specific for the Del and Dup alleles are 448-bp and 653-bp respectively. (D) Evolution of body weight (g) of adult animals (F(3,300) = 5.529, P = 0.002; Del/+ vs wt: P = 0.101, Dup/+ vs wt: P = 0.002, Del/Dup vs wt: P = 0.109). (E) Body length (distance from the snout to the tail base) of 20-week old animals (H(3, 55) = 28.036, P < 0.001; Del/+ vs wt: P = 0.004, Dup/+ vs wt: P < 0.001, Del/Dup vs wt: P = 0.003). (F) Body fat percentage of 20-week-old animals measured by qNMR (H(3, 55) = 8.120, P = 0.044; Del/+ vs wt: P = 0.027). Data are represented as the mean ± s.e.m. Cohort used included 18 Del/+, 24 wt, 11 Del/Dup, and 11 Dup/+ animals. (A) Repeated Measures ANOVA “genotype” analysis, Tukey's post hoc test. (B, C, E, F) Kruskal-Wallis analysis, Mann-Whitney U test. *P < 0.05 vs wt, **P < 0.01 vs wt, ***P < 0.001 vs wt, # P < 0.05 vs all other groups.
Fig 2
Fig 2. Behavioral characterization of Del-Dup cohorts.
(A) Circadian activity test. Graphs plot the spontaneous ambulatory activity (count) and the vertical activity/rears (count) during dark and light phases. Del/+ mice showed reduced ambulatory activity during the dark phase (F(3,46) = 5.791, P = 0.002; Del/+ vs wt: P = 0.002) and the light phase (F(3,46) = 4.260, P = 0.010; Del/+ vs wt: P = 0.006) as well as reduced rearing behavior during the light phase (H(3, 46) = 12.861, P = 0.005; Del/+ vs wt: P = 0.002) (B) Open field test. Distance travelled (m), and vertical activity/rears (count) over 30 min of testing. (C) Novel object recognition test. Discrimination index was calculated as the ratio of time spent exploring the novel object vs the total time for object sniffing in the choice trial after a 3 h retention delay. The dashed line denotes a chance level of 50% (F(3,43) = 3.081, P = 0.037; Del/+ vs wt: P = 0.040). (D) Fear conditioning test. Plots represent the percentage of time spent freezing during test sessions. The 6-min context session was run 24 h after conditioning. The 8-min cue session was performed 5 h after the context session. A sequence of 2-min without cue and 2 min with light/auditory conditioning stimulus was repeated twice. (E) Cued fear extinction. Independent group of Del /+ and Dup/+ mutant mice with their respective wt control littermates were evaluated for cued fear extinction. Immobility was increased in Dup/+ compared to control while it was decreased in the Del/+ carriers during the two test periods for extinction (Ext1 (24 h) and Ext2 (48 h)). After one week the cued fear retrieval was observed in the Dup/+ mice compared to their wt littermates whereas it was absent in the Del/+ compared to their control. (F-G) Three-chamber sociability test. (F) Exploration time (s) of the first congener in the social interest session (session 1) and total exploration time of familiar and novel congeners in the social discrimination session (session 2). No delay was used between the two sessions. (G) Discrimination index was calculated as the ratio of time spent exploring the novel congener vs the familiar one. Data are represented as the mean ± s.e.m. Cohort used included 18 Del/+, 24 wt, 11 Del/Dup, and 11 Dup/+ animals. Post hoc Tukey's and Mann Whitney U tests were performed following significant results in one-way ANOVA or Kruskal Wallis analysis, respectively. *P < 0.05 vs wt, **P < 0.01 vs wt, ***P < 0.001 vs wt, # P < 0.05 vs all other groups.
Fig 3
Fig 3. Differences in whole brain volume and relative volumes (normalized or overall brain volume) for the hippocampus, amygdala, nucleus accumbens, cingulate complex, entorhinal cortex and the frontal region of the 17q21.31 mouse models.
All plots use box-and-whiskers diagrams. The box indicates data that lie within the 25th and 75th percentile. The horizontal line in the box specifies the median of the data, and the whiskers the full range of the data with the individual dots being the outliers. (A) Total brain volume is significantly different between the 4 genotypes at 0.1% FDR. (B) Relative volumes. For each structure, the following data are shown: on the left a bar graph indicating the relative size of the entire structure/region expressed as a percentage of total brain volume. Significance is based on the f-statistic resulting from comparing the 4 genotypes. NS = not significant, * = significant at 1% FDR, ** = significant at 0.1% FDR. In the center, the 3D surface renderings focus on significant changes for the structure of interest only. In grey the surface of the entire brain, in yellow the surface of the structure/region of interest and in purple all areas inside that structure/region that are significantly different between the genotypes at 0.1% FDR. On the right is a coronal slice through the average MR brain image. All colored regions indicate areas where the relative volume is significantly different between the 4 genotypes at 0.1% FDR. Cohort used included 8 Del/+, 10 wt, 11 Del/Dup, and 8 Dup/+ animals.
Fig 4
Fig 4. General behavioral characterization of Kansl1+/- cohorts.
(A) Body weight (g) of adult animals at 15, 17 and 19 weeks of age with Body length (distance from snout to tail basis) and Body fat percentage measured by qNMR of 20-week-old animals. Compared to wt littermates, Kansl1+/- animals show body weight, size and adiposity deficits. (B) Circadian activity test. Graphs plot the spontaneous ambulatory activity (count) and the vertical activity/rears (count) during dark and light phases. (C) Open field test. Distance travelled (m), and vertical activity/rears (count) over 30 min of testing. (D) Repetitive behaviors. Graph plots occurences of rearing, jumping, climbing and digging behaviors (count) during 10 min of observation in a novel home cage. Kansl1+/- animals show increase of rearing and decrease of digging levels reflecting an alteration of exploration activity. (E) Results are expressed as the time (s) that mice remained on an accelerating rod before falling during the training phase over 3 consecutive days of the rotarod test. (F) Corresponding rotational velocity (rpm) at the time of falling during the challenge phase of the rotarod test. The graph plots the time (s) that mice stayed on the rod when tested at constant speeds between 4 and 40 rpm. (D) Four-paw grip test. The conclusion of the rotarod and grip tests is that Kansl1+/- animals show locomotor coordination improvements without alterations of muscular strenght. Graphs depict mean + s.e.m.. (B-D) Student’s t-test, *P < 0.05, **P < 0.01. (A, E-G) Repeated Measures ANOVA "genotype" analysis, Tukey's test, *P < 0.05, **P < 0.01, ***P < 0.001.
Fig 5
Fig 5. Learning and memory phenotypes in the Kansl1+/-.
(A) Novel object recognition test. Discrimination index was calculated as the ratio of time spent exploring the novel object vs the familiar object in the choice trial after a 3 h retention delay. (B) Fear conditioning test. Plots represent the fraction of time spent freezing during test sessions. As above the 6-min context session was run 24 h after conditioning and the 8-min cue session was performed 5h after the context. A sequence of 2-min with no cue and 2 min with light/auditory conditioning stimulus was repeated two times. (C-D) Three-chamber sociability test. (C) Exploration time (s) of the first congener in the social interest session (session 1) and total exploration time of familiar and novel congeners in the social discrimination session (session 2). No delay was used between the two sessions. (D) Discrimination index was calculated as the ratio of time spent exploring the novel congener vs the familiar one. Data are represented as the mean ± s.e.m.. Cohort used included 8 Kansl1+/- and 10 wt animals. Tukey's and Mann Whitney U tests following a significant one-way ANOVA and Kruskal Wallis analysis, respectively. *P < 0.05 vs wt, **P < 0.01 vs wt, ***P < 0.001 vs wt, # P < 0.05 vs all other groups.
Fig 6
Fig 6. Epigenetic profiling in the hippocampus of KdV mouse models demonstrated non-neuronal and neuronal cell-specific alterations.
(A) H3K4me3 pattern in the deleted region and its flanking sequences. Graph with a schematic representation of H3k4me3 peaks (averaged over three biological replicates) at the promoters of the genes in the 17q21.31 deleted region and flanking regions. Peaks within the deletion show half intensity as compared to wt, while peaks in the surrounding regions show the same intensity and patterning, thus confirming the absence of nonspecific-effects. (B) Overview of promoter deregulations. For each mouse model (Kansl1+/- or Del/+) 3 wt biological replicas and 3 mutant biological replicas were generated for H3K4me3 ChIP-seq. DEseq2 algorithm was used to call the significant deregulations (P value<0.01) in the promoters. False positives, as detected by comparing the two groups of WT samples, can be estimated to only 4%. Given that no consistent changes were found among WT sets we opted to collapse all the 6 wts in one group and use it as the common control for both Kansl1+/- and Del/+ samples, thus increasing the sensitivity and detecting more dysregulation (right histograms) (C) Clustering of Pearson correlation calculated over the total dysregulated promoters clearly segregates the different conditions. (D) Cell types of Del/+ up-regulated genes. The Stacked histogram represents the enrichment of cell-type specific markers in the Del/+ UP-regulated genes. The strongest enrichment is for CA1 pyramidal neurons markers, followed by genes specific to somatosensory cortex pyramidal neurons, astrocytes and interneurons. A milder, but still significant, enrichment was found for endothelial cells. Together, these results suggest that Del/+ deletion causes perturbations that are cell-type specific. (E) Overview of Del/+ misregulation in the Kansl1+/- model. Pie charts summarize the behavior of Del/+ deregulated genes in the Kansl1+/- model to evaluate the extent to which Kansl1 alone is able to mimic the Del/+ misregulations. To better describe the shades of gray always inherent to the P values, we classified the strength of Kansl1+/- deregulation in four classes, ranging from no-change to the same intensity of Del/+. We could not detect any ‘reversal’ in the deregulations (i.e. genes up-regulated in one mutant being down-regulated in the other and vice versa) (E) Clustering of the Del/+ and Kansl1+/- deregulated genes. The heat map includes all the genes that are significantly UP-regulated in either of the models. Enrichment of neuronal markers are based on published work. (F) Study of cell-type markers. The heat map represents the significance of the enrichments for specific markers in the 4 different clusters of section E. (G) Study of Cluster GO enrichments. The heat map represents the significance of the GO enrichments in the 4 clusters of section E. (I) overview of social behavior genes.

References

    1. Vulto-van Silfhout AT, Hehir-Kwa JY, van Bon BW, Schuurs-Hoeijmakers JH, Meader S, Hellebrekers CJ, et al. Clinical significance of de novo and inherited copy-number variation. Hum Mutat. 2013;34(12):1679–87. Epub 2013/09/17. doi: 10.1002/humu.22442 . - DOI - PubMed
    1. Coe BP, Witherspoon K, Rosenfeld JA, van Bon BW, Vulto-van Silfhout AT, Bosco P, et al. Refining analyses of copy number variation identifies specific genes associated with developmental delay. Nature genetics. 2014;46(10):1063–71. Epub 2014/09/15. doi: 10.1038/ng.3092 ; - DOI - PMC - PubMed
    1. Koolen DA, Pfundt R, Linda K, Beunders G, Veenstra-Knol HE, Conta JH, et al. The Koolen-de Vries syndrome: a phenotypic comparison of patients with a 17q21.31 microdeletion versus a KANSL1 sequence variant. Eur J Hum Genet. 2015. doi: 10.1038/ejhg.2015.178 . - DOI - PMC - PubMed
    1. Koolen DA, Vissers LE, Pfundt R, de Leeuw N, Knight SJ, Regan R, et al. A new chromosome 17q21.31 microdeletion syndrome associated with a common inversion polymorphism. Nature genetics. 2006;38(9):999–1001. Epub 2006/08/15. doi: 10.1038/ng1853 . - DOI - PubMed
    1. Benda CE, Mann GV. The serum cholesterol and lipoprotein levels in mongolism. J Pediatr. 1955;46(1):49–53. . - PubMed

MeSH terms

Supplementary concepts