

The ancestral levels of transcription and the evolution of sexual phenotypes in filamentous fungi
- PMID: 28704372
- PMCID: PMC5509106
- DOI: 10.1371/journal.pgen.1006867
The ancestral levels of transcription and the evolution of sexual phenotypes in filamentous fungi
Abstract
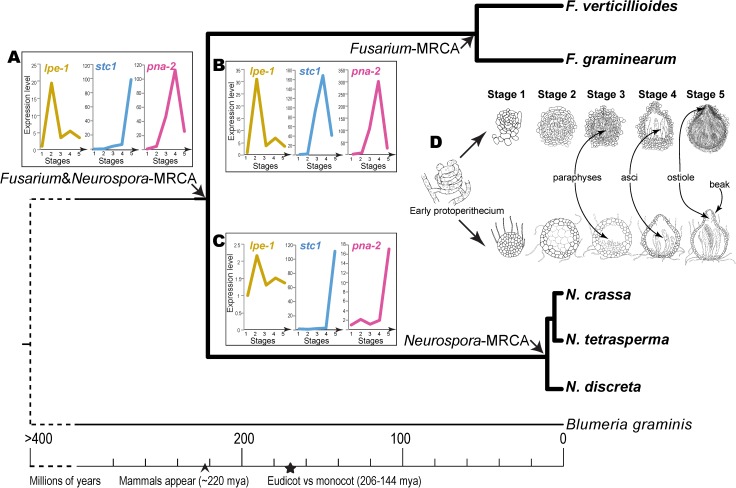
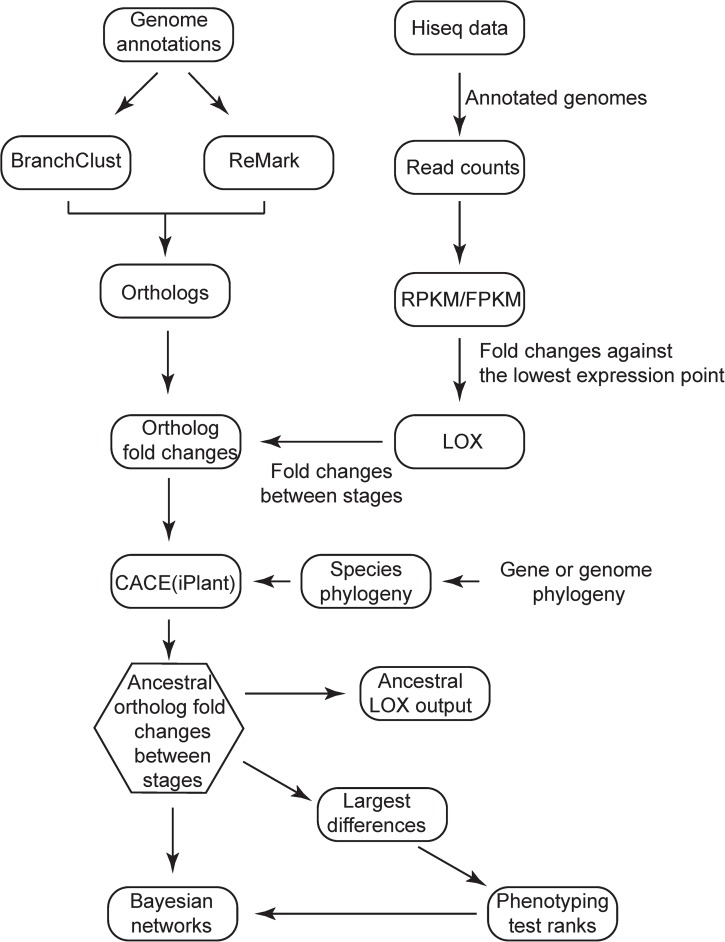
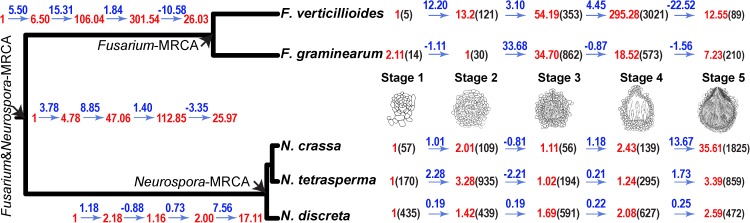
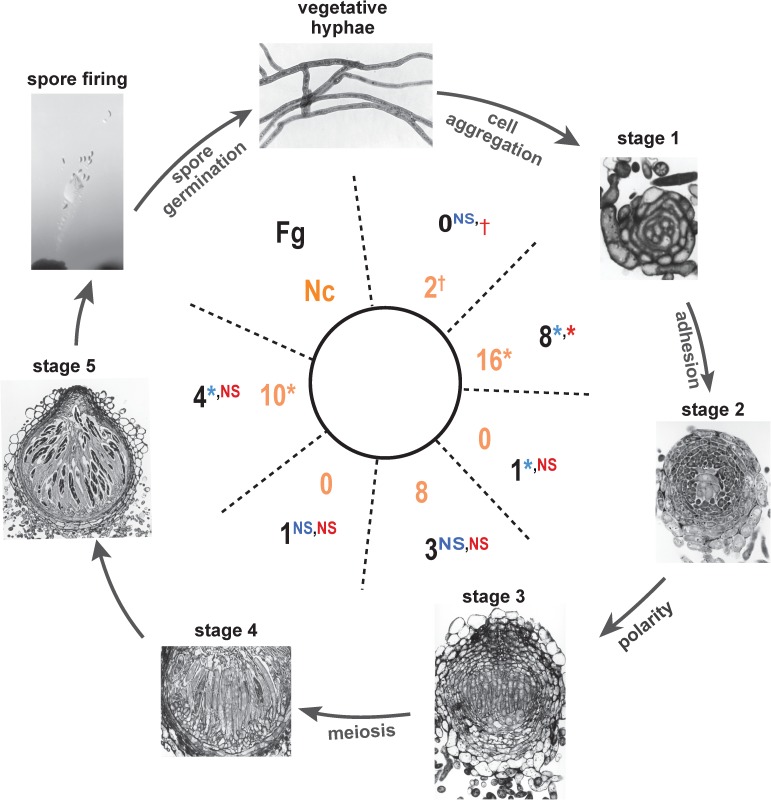
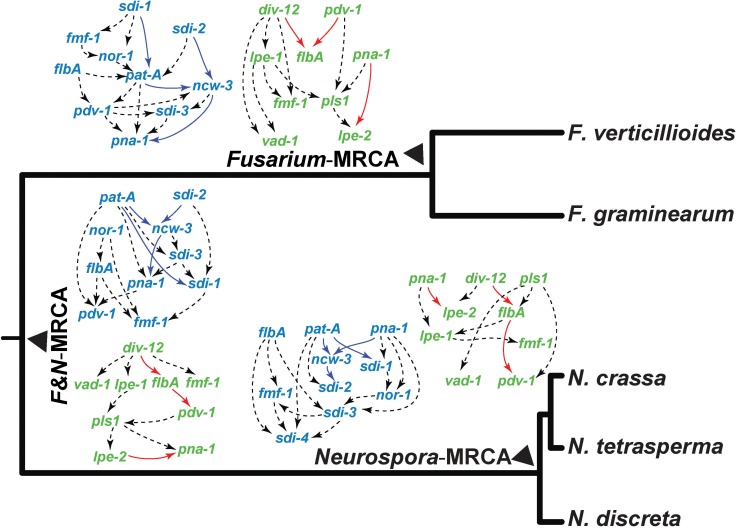
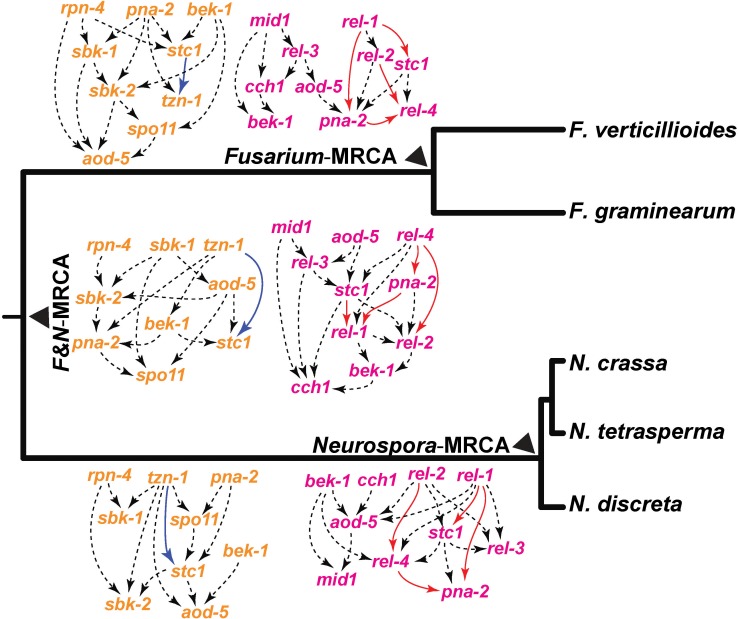
Changes in gene expression have been hypothesized to play an important role in the evolution of divergent morphologies. To test this hypothesis in a model system, we examined differences in fruiting body morphology of five filamentous fungi in the Sordariomycetes, culturing them in a common garden environment and profiling genome-wide gene expression at five developmental stages. We reconstructed ancestral gene expression phenotypes, identifying genes with the largest evolved increases in gene expression across development. Conducting knockouts and performing phenotypic analysis in two divergent species typically demonstrated altered fruiting body development in the species that had evolved increased expression. Our evolutionary approach to finding relevant genes proved far more efficient than other gene deletion studies targeting whole genomes or gene families. Combining gene expression measurements with knockout phenotypes facilitated the refinement of Bayesian networks of the genes underlying fruiting body development, regulation of which is one of the least understood processes of multicellular development.
Conflict of interest statement
The authors have declared that no competing interests exist.
Figures
Similar articles
-
Transcriptional Divergence Underpinning Sexual Development in the Fungal Class Sordariomycetes.mBio. 2022 Jun 28;13(3):e0110022. doi: 10.1128/mbio.01100-22. Epub 2022 May 31. mBio. 2022. PMID: 35638737 Free PMC article.
-
Gene expression differences among three Neurospora species reveal genes required for sexual reproduction in Neurospora crassa.PLoS One. 2014 Oct 20;9(10):e110398. doi: 10.1371/journal.pone.0110398. eCollection 2014. PLoS One. 2014. PMID: 25329823 Free PMC article.
-
The genome and development-dependent transcriptomes of Pyronema confluens: a window into fungal evolution.PLoS Genet. 2013;9(9):e1003820. doi: 10.1371/journal.pgen.1003820. Epub 2013 Sep 19. PLoS Genet. 2013. PMID: 24068976 Free PMC article.
-
Sordaria macrospora: 25 years as a model organism for studying the molecular mechanisms of fruiting body development.Appl Microbiol Biotechnol. 2020 May;104(9):3691-3704. doi: 10.1007/s00253-020-10504-3. Epub 2020 Mar 11. Appl Microbiol Biotechnol. 2020. PMID: 32162092 Free PMC article. Review.
-
Observing meiosis in filamentous fungi: Sordaria and Neurospora.Methods Mol Biol. 2009;558:91-114. doi: 10.1007/978-1-60761-103-5_7. Methods Mol Biol. 2009. PMID: 19685321 Review.
Cited by
-
The Sordariomycetes: an expanding resource with Big Data for mining in evolutionary genomics and transcriptomics.Front Fungal Biol. 2023 Jun 30;4:1214537. doi: 10.3389/ffunb.2023.1214537. eCollection 2023. Front Fungal Biol. 2023. PMID: 37746130 Free PMC article. Review.
-
Transcription factor-dependent regulatory networks of sexual reproduction in Fusarium graminearum.mBio. 2025 Jan 8;16(1):e0303024. doi: 10.1128/mbio.03030-24. Epub 2024 Nov 26. mBio. 2025. PMID: 39589130 Free PMC article.
-
Comparative Genomics and Transcriptomics To Analyze Fruiting Body Development in Filamentous Ascomycetes.Genetics. 2019 Dec;213(4):1545-1563. doi: 10.1534/genetics.119.302749. Epub 2019 Oct 11. Genetics. 2019. PMID: 31604798 Free PMC article.
-
Secondary Metabolism Gene Clusters Exhibit Increasingly Dynamic and Differential Expression during Asexual Growth, Conidiation, and Sexual Development in Neurospora crassa.mSystems. 2022 Jun 28;7(3):e0023222. doi: 10.1128/msystems.00232-22. Epub 2022 May 31. mSystems. 2022. PMID: 35638725 Free PMC article.
-
Differential Expression of Cell Wall Remodeling Genes Is Part of the Dynamic Phase-Specific Transcriptional Program of Conidial Germination of Trichoderma asperelloides.J Fungi (Basel). 2022 Aug 15;8(8):854. doi: 10.3390/jof8080854. J Fungi (Basel). 2022. PMID: 36012842 Free PMC article.
References
-
- Zuckerkandl E. Perspectives in molecular anthropology In: Washburn SL, editor. Classification and human evolution. New York: Wenner-Gren Foundation for Anthropological Research; 1974. pp. 243–272.
-
- Wilson AC, Carlson SS, White TJ. Biochemical evolution. Annu Rev Biochem. 1977;46: 573–639. doi: 10.1146/annurev.bi.46.070177.003041 - DOI - PubMed
-
- Macintyre RJ. Regulatory Genes and Adaptation. Evolutionary Biology. 1982. pp. 247–285.
-
- Paigen K. Gene regulation and its role in evolutionary processes In: Nevo E, editor. Evolutionary processes and theory New York: Harcourt Brace Jovanovich; 1986. pp. 3–23.
-
- Carroll SB. Evo-devo and an expanding evolutionary synthesis: a genetic theory of morphological evolution. Cell. 2008;134: 25–36. doi: 10.1016/j.cell.2008.06.030 - DOI - PubMed
MeSH terms
LinkOut - more resources
Full Text Sources
Other Literature Sources
