

Taxon abundance, diversity, co-occurrence and network analysis of the ruminal microbiota in response to dietary changes in dairy cows
- PMID: 28704445
- PMCID: PMC5509137
- DOI: 10.1371/journal.pone.0180260
Taxon abundance, diversity, co-occurrence and network analysis of the ruminal microbiota in response to dietary changes in dairy cows
Abstract
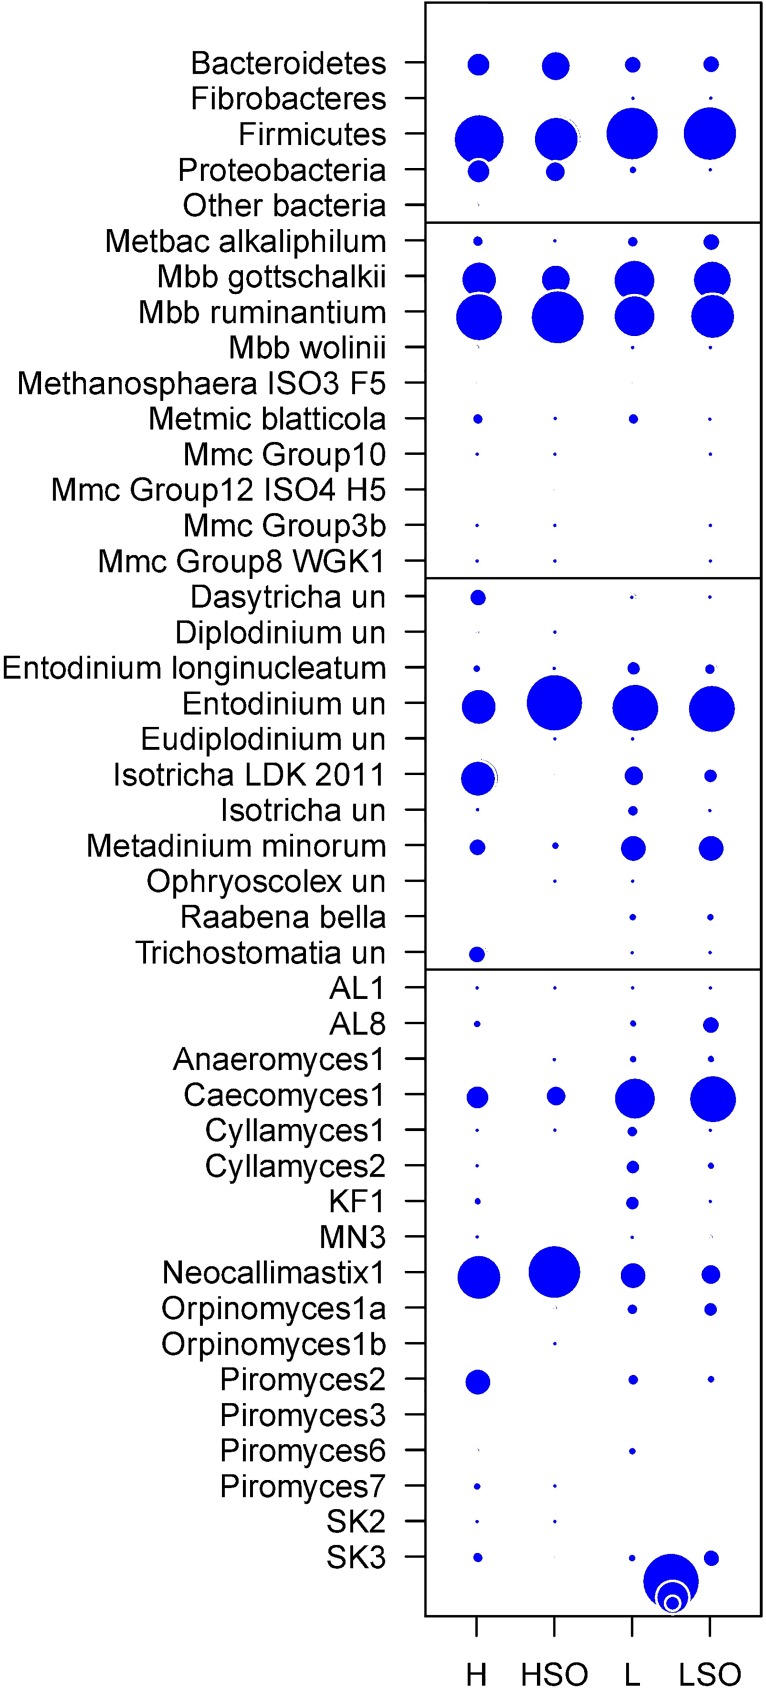
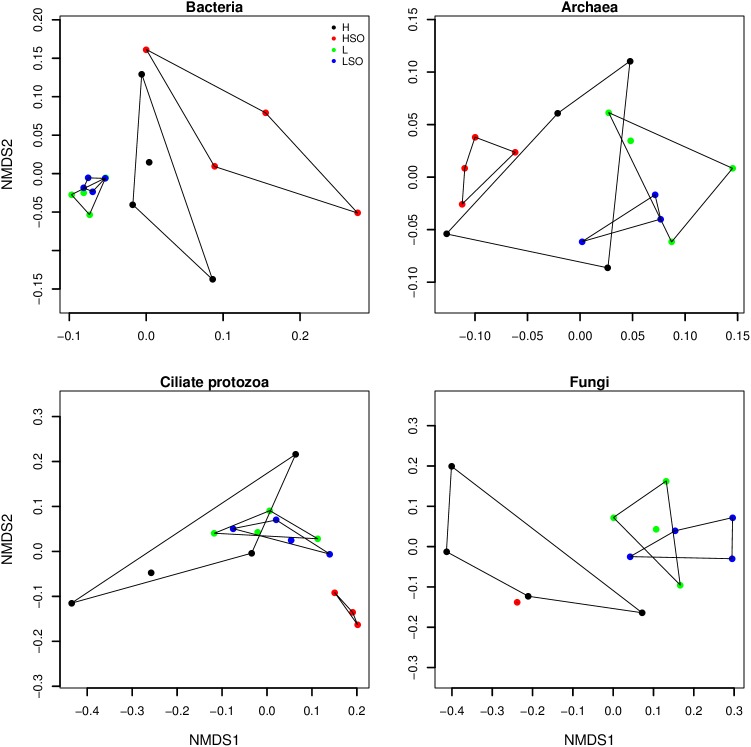
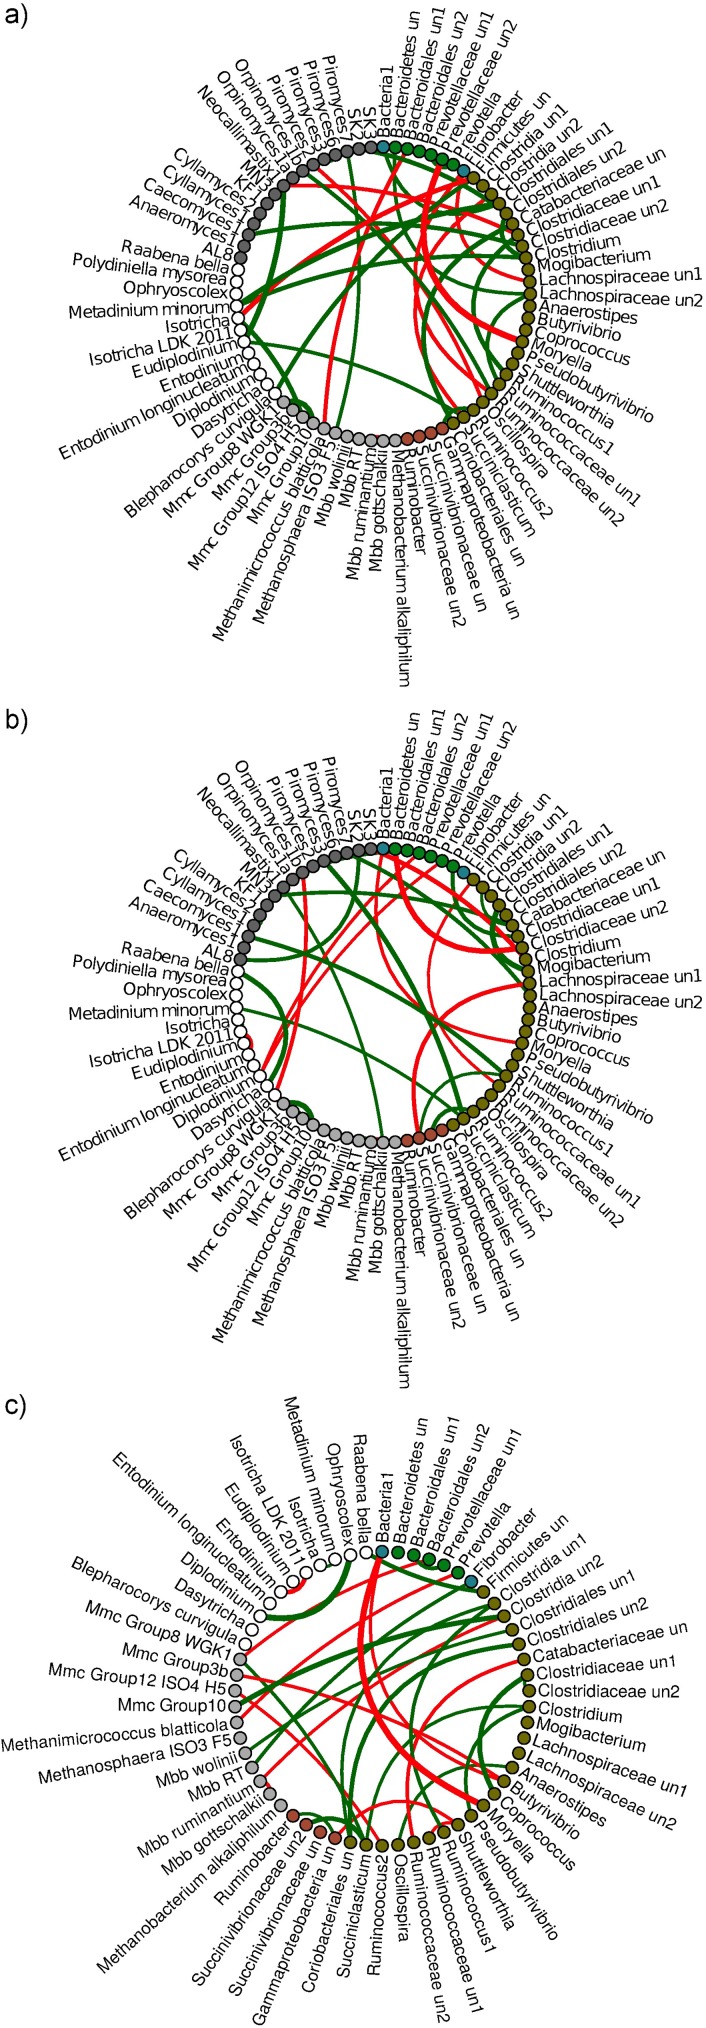
The ruminal microbiome, comprising large numbers of bacteria, ciliate protozoa, archaea and fungi, responds to diet and dietary additives in a complex way. The aim of this study was to investigate the benefits of increasing the depth of the community analysis in describing and explaining responses to dietary changes. Quantitative PCR, ssu rRNA amplicon based taxa composition, diversity and co-occurrence network analyses were applied to ruminal digesta samples obtained from four multiparous Nordic Red dairy cows fitted with rumen cannulae. The cows received diets with forage:concentrate ratio either 35:65 (diet H) or 65:35 (L), supplemented or not with sunflower oil (SO) (0 or 50 g/kg diet dry matter), supplied in a 4 × 4 Latin square design with a 2 × 2 factorial arrangement of treatments and four 35-day periods. Digesta samples were collected on days 22 and 24 and combined. QPCR provided a broad picture in which a large fall in the abundance of fungi was seen with SO in the H but not the L diet. Amplicon sequencing showed higher community diversity indices in L as compared to H diets and revealed diet specific taxa abundance changes, highlighting large differences in protozoal and fungal composition. Methanobrevibacter ruminantium and Mbb. gottschalkii dominated archaeal communities, and their abundance correlated negatively with each other. Co-occurrence network analysis provided evidence that no microbial domain played a more central role in network formation, that some minor-abundance taxa were at nodes of highest centrality, and that microbial interactions were diet specific. Networks added new dimensions to our understanding of the diet effect on rumen microbial community interactions.
Conflict of interest statement
Figures


References
-
- Kim M, Morrison M, Yu Z. Phylogenetic diversity of bacterial communities in bovine rumen as affected by diets and microenvironments. Folia microbiologica. 2011; 56(5):453–8. doi: 10.1007/s12223-011-0066-5 - DOI - PubMed
-
- Henderson G, Cox F, Ganesh S, Jonker A, Young W, Global Rumen Census Collaborators, et al. Rumen microbial community composition varies with diet and host, but a core microbiome is found across a wide geographical range. Scientific Reports 2015; 5:14567 doi: 10.1038/srep14567 - DOI - PMC - PubMed
-
- Gruninger RJ, Puniya AK, Callaghan TM, Edwards JE, Youssef N, Dagar SS, et al. Anaerobic fungi (phylum Neocallimastigomycota): advances in understanding their taxonomy, life cycle, ecology, role and biotechnological potential. FEMS microbiology ecology. 2014; 90(1):1–7. doi: 10.1111/1574-6941.12383 - DOI - PubMed
-
- Janssen PH, Kirs M. Structure of the archaeal community of the rumen. Applied and Environmental Microbiology. 2008; 74(12):3619–25. doi: 10.1128/AEM.02812-07 - DOI - PMC - PubMed
-
- Taxis TM, Wolff S, Gregg SJ, Minton NO, Zhang C, Dai J, et al. The players may change but the game remains: network analyses of ruminal microbiomes suggest taxonomic differences mask functional similarity. Nucleic acids research. 2015; doi: 10.1093/nar/gkv973 - DOI - PMC - PubMed
MeSH terms
LinkOut - more resources
Full Text Sources
Other Literature Sources
Medical
