Meta-Analysis
. 2017 Jul 13;12(7):e0180795.
doi: 10.1371/journal.pone.0180795. eCollection 2017.

Hand-arm vibration and the risk of vascular and neurological diseases-A systematic review and meta-analysis

Affiliations
Meta-Analysis

Hand-arm vibration and the risk of vascular and neurological diseases-A systematic review and meta-analysis

Tohr Nilsson et al. PLoS One. .

Abstract

Background: Increased occurrence of Raynaud's phenomenon, neurosensory injury and carpal tunnel syndrome has been reported for more than 100 years in association with work with vibrating machines. The current risk prediction modelling (ISO-5349) for "Raynaud's phenomenon" is based on a few studies published 70 to 40 years ago. There are no corresponding risk prediction models for neurosensory injury or carpal tunnel syndrome, nor any systematic reviews comprising a statistical synthesis (meta-analysis) of the evidence.

Objectives: Our aim was to provide a systematic review of the literature on the association between Raynaud's phenomenon, neurosensory injuries and carpal tunnel syndrome and hand-arm vibration (HAV) exposure. Moreover the aim was to estimate the magnitude of such an association using meta-analysis.

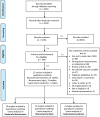
Methods: This systematic review covers the scientific literature up to January 2016. The databases used for the literature search were PubMed and Science Direct. We found a total of 4,335 abstracts, which were read and whose validity was assessed according to pre-established criteria. 294 articles were examined in their entirety to determine whether each article met the inclusion criteria. The possible risk of bias was assessed for each article. 52 articles finally met the pre-established criteria for inclusion in the systematic review.

Results: The results show that workers who are exposed to HAV have an increased risk of vascular and neurological diseases compared to non-vibration exposed groups. The crude estimate of the risk increase is approximately 4-5 fold. The estimated effect size (odds ratio) is 6.9 for the studies of Raynaud's phenomenon when including only the studies judged to have a low risk of bias. The corresponding risk of neurosensory injury is 7.4 and the equivalent of carpal tunnel syndrome is 2.9.

Conclusion: At equal exposures, neurosensory injury occurs with a 3-time factor shorter latency than Raynaud's phenomenon. Which is why preventive measures should address this vibration health hazard with greater attention.


Conflict of interest statement

Competing Interests: The study was supported by Swedish AFA Insurance, The funders had no role in study design, data collection and analysis, decision to publish, or preparation of the manuscript, this does not alter our adherence to the PLOS ONE policies on sharing data and material.

Figures

Fig 1
Fig 1. Flow chart of the search strategy and selection of studies in order to evaluate the relationship between the hand-arm vibration and health outcomes in accordance with the PRISMA (Raynaud’s phenomenon, neurosensory injury, carpal tunnel syndrome).
Fig 2
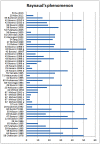
Fig 2. The prevalence of Raynaud’s phenomenon in the included studies sorted by year of publication.
Fig 3
Fig 3. Statistics and forest plot of a “random - effect” meta-analysis of the prevalence of Raynaud’s phenomenon between the groups exposed to HAV and non-exposed reference groups.
The size of the square of the individual studies is proportional to the study’s weight in the analysis. The red diamond indicates the overall risk. The studies have been ranked in order from highest to lowest quality score points according to quality criteria in appendix (S1 Table) and Table 1. The asterisk indicates that the study data presented made it possible to calculate the unadjusted odds ratio.
Fig 4
Fig 4. Statistics and forest plot of the weighting for each dose studies in Raynaud’s phenomenon sorted by various measuring cup.
The size of the square of the individual studies is proportional to the study’s importance in the analysis. The blue diamond’s (rhomboids) shows the combined effect of the subgroups of measuring cup; Dose 1 = Number of exposure years (year); Dose 2 = Number of exposure hours (h); Dose 3 = Daily vibration exposure, A (8) (m/s2); Dose 4 = Cumulative vibration exposure (mh/s2, m2h/s4 or m2h3/s4). The studies have been ranked in order from highest to lowest quality score points according to Table 1. The asterisk indicates that the study data presented made it possible to calculate the unadjusted odds ratio.
Fig 5
Fig 5. Meta-Regression analysis of the relationship between the logarithm of the prevalence of Raynaud’s phenomenon in vibration-exposed and vibration exposure A(8) (random effect; n = 14).
The figure also shows the regression line’s 95% confidence intervals intervals (red lines). Blue lines show the prediction interval. The size of the circles represents the importance of the study results in the estimates of the regression.
Fig 6
Fig 6. Funnel plot with pseudo 95% confidence interval for publication bias in studies of the association between the occurrence of Raynaud’s phenomenon among groups exposed to HAV and non-exposed reference groups.
Beggs test shows no evidence of publication bias (p = 0.14), while Eggers test indicates such an effect (p <0.01). The trim and fill method imputed three missing studies to the left of the mean (random-effects model).
Fig 7
Fig 7. Funnel l plot with pseudo 95% confidence interval for publication bias in studies of the association between the occurrences of Raynaud’s phenomenon among groups exposed to different levels of HAV.
Beggs test (p = 0.04), but not Eggers test (p = 0.36), showed evidence of publication bias and trim and fill method imputed seven studies lacked the left of the mean (random-effect model).
Fig 8
Fig 8. The prevalence of neuro-sensory injury in the studies included sorted by year of publication.
Fig 9
Fig 9. Statistics and “forest plot” with aggregate from “random - effect” meta-analysis of the incidence of neurosensory injury between groups exposed to HAV and non-exposed reference groups.
The size of the squares of the individual studies is proportional to the importance of the study in the analysis. The red diamond represents the weighted risk for all studies. The studies have been sorted in order from highest to lowest quality score points according to Table 2. The asterisk indicates that the study data presented made it possible to calculate the unadjusted odds ratio.
Fig 10
Fig 10. Statistics and Forest plot of the weighting for each dose studies in neuro-sensory injury sorted by the various dose measures.
The size of the square of the individual studies is proportional to the study’s importance in the analysis. The blue diamonds (rhomboids) shows the combined effect of the subgroups of dose measures. Dose 2 = Number of exposure hours (h); Dose 4 = Cumulative vibration exposure (mh/s2, m2h/s4 or m2h3/s4). The studies have been ranked in order from highest to lowest quality score points according to Table 2. The asterisk indicates that the study data presented made it possible to calculate the unadjusted odds ratio.
Fig 11
Fig 11. Meta-Regression analysis of the relationship between the logarithm of the prevalence of neurosensory injury in vibration-exposed and vibration exposure A(8) (random effect; n = 15).
The figure also shows the regression line 95% confidence limits (red lines). Blue lines show the prediction interval. The size of the circles represents the importance of the study results in the estimates of the regression.
Fig 12
Fig 12. Funnel plot with pseudo 95% confidence interval for publication bias in studies of the association between the occurrences of neuro-sensory injury among groups exposed to HAV and non-exposed reference groups.
A Beggs test shows evidence of publication bias (p = 0.04), while Eggers test indicates no evidence the effect (p = 0.07). The trim and fill method imputed no missing study (random-effects model).
Fig 13
Fig 13. Funnel l plot with pseudo 95% confidence interval for publication bias in studies of the association between the occurrences of neuro-sensory impairment among groups exposed to different levels of HAV.
A Beggs test (p = 0.04) and Eggers test (p = 0.02) showed evidence of publication bias while the trim and fill method imputed no missing study (random-effects model).
Fig 14
Fig 14. The prevalence of CTS in the studies included sorted by year of publication.
Fig 15
Fig 15. Statistics and “forest plot” with aggregate from “random - effect” meta-analysis of the prevalence of CTS among groups exposed to HAV and non-exposed reference groups.
The size of the squares of the individual studies is proportional to the study’s importance in the analysis. The red diamond represents the weighted risk for all studies. The studies have been sorted in order from highest to lowest quality score points according to Table 3. The asterisk indicates that the study data presented made it possible to calculate the unadjusted odds ratio.
Fig 16
Fig 16. Funnel plot with pseudo 95% confidence interval for publication bias in studies of the association between the occurrences of CTS among groups exposed to HAV and non-exposed reference groups.
A Beggs and Eggers test showed no evidence of publication bias (p = 0.50; p = 0.21) and the trim and fill method imputed one missing study to the right of the mean (random-effects model).
Fig 17
Fig 17. Calculated 10% correlation between the prevalence of Raynaud phenomenon (25 studies; 40 values) and neurosensory injury (17 studies; 21 values) as a function of the 8-hour equivalent frequency-weighted acceleration and number of years of exposure.
In the figure shown, the linear regression line for the two outcomes, and the corresponding curve of ISO 5349–1 [(Equations: Prevalence Raynaud phenomenon (%) = 10 ^ (1.35+ log10 (A (8) + - 0.53)) r = 12.39; Prevalence neurosensory damage (%) = 10 ^ (0.9+ log10 (A (8) + - 0.54)), r = 12.55)].

Comment in

References

    1. Lawson I, Burke F, McGeoch K, Nilsson T, Proud G. Hand-arm vibration syndrome In: Baxter P, Aw T, Cockcroft A, Durrington P, Harrington J, editors. Hunters Diseases of Occupations. 10th ed London: Hodder Arnold; 2010. p. 489–512.
    1. Pelmear PL, Wasserman DE. Hand-arm vibration. Second ed: OEM Press Beverly Farms, MA; 1998. p. 1–272.
    1. Nilsson T. Neurological diagnosis: aspects of bedside and electrodiagnostic examinations in relation to hand-arm vibration syndrome. Int Arch Occup Environ Health. 2002;75(1–2):55–67. Epub 2002/03/20. . - PubMed
    1. ISO 5349–1. Mechanical vibration—Measurement and evaluation of human exposure to hand-transmitted vibration—Part 1: General guidelines. Draft International Standard. Genevé, Schweiz: International Organization for Standardization, 2001 May 1999. Report No.
    1. Hamilton A. A study of spastic anaemia in the hands of stonecutters. Industrial Accident Hygiene Service Bulletin. 1918:53–66.

MeSH terms