. 2017 Jul 13;13(7):e1006440.
doi: 10.1371/journal.ppat.1006440. eCollection 2017 Jul.

Streptococcus gallolyticus subsp. gallolyticus promotes colorectal tumor development

Affiliations

Streptococcus gallolyticus subsp. gallolyticus promotes colorectal tumor development

Ritesh Kumar et al. PLoS Pathog. .

Abstract

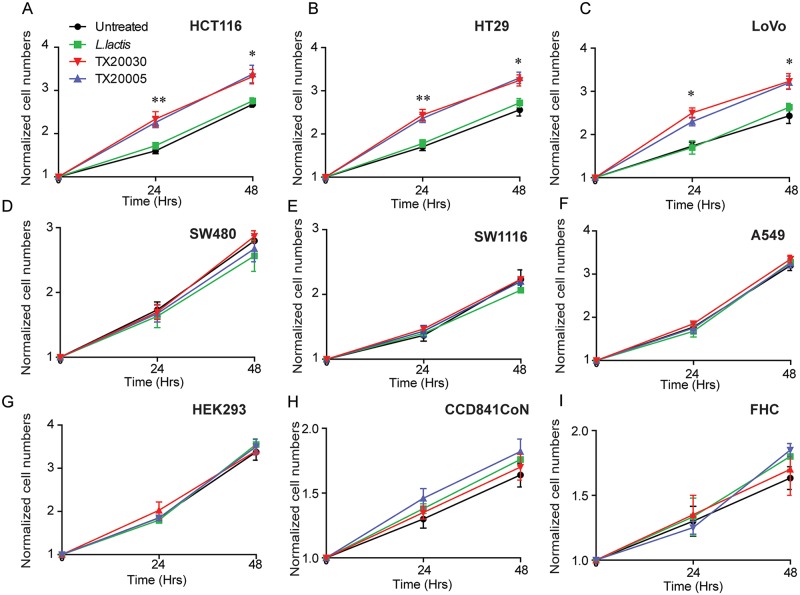
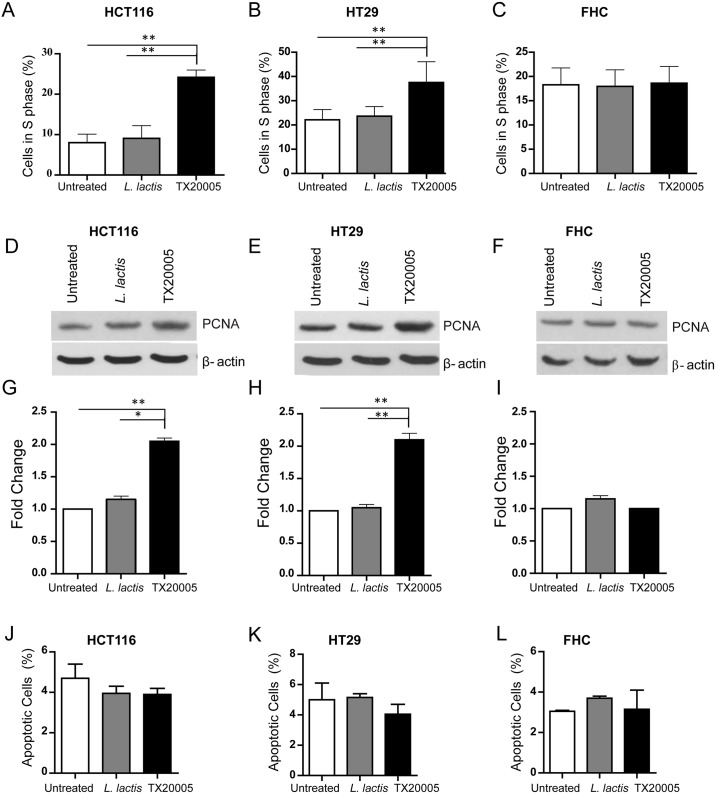
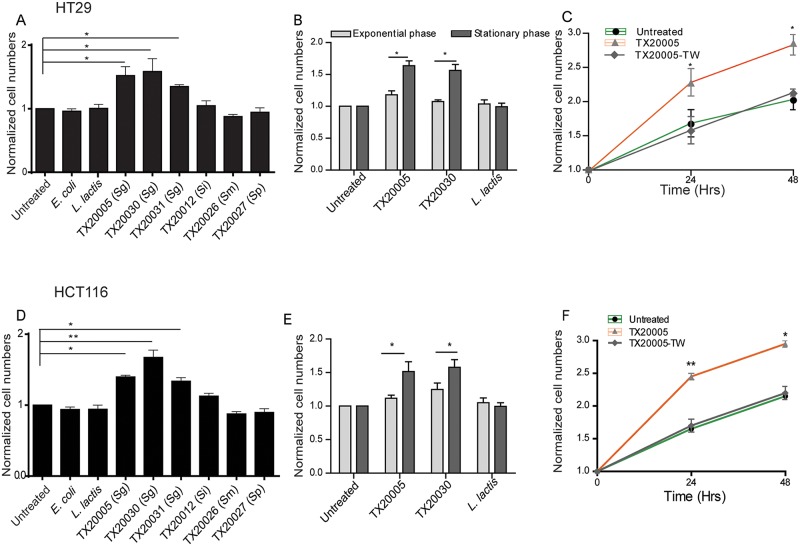
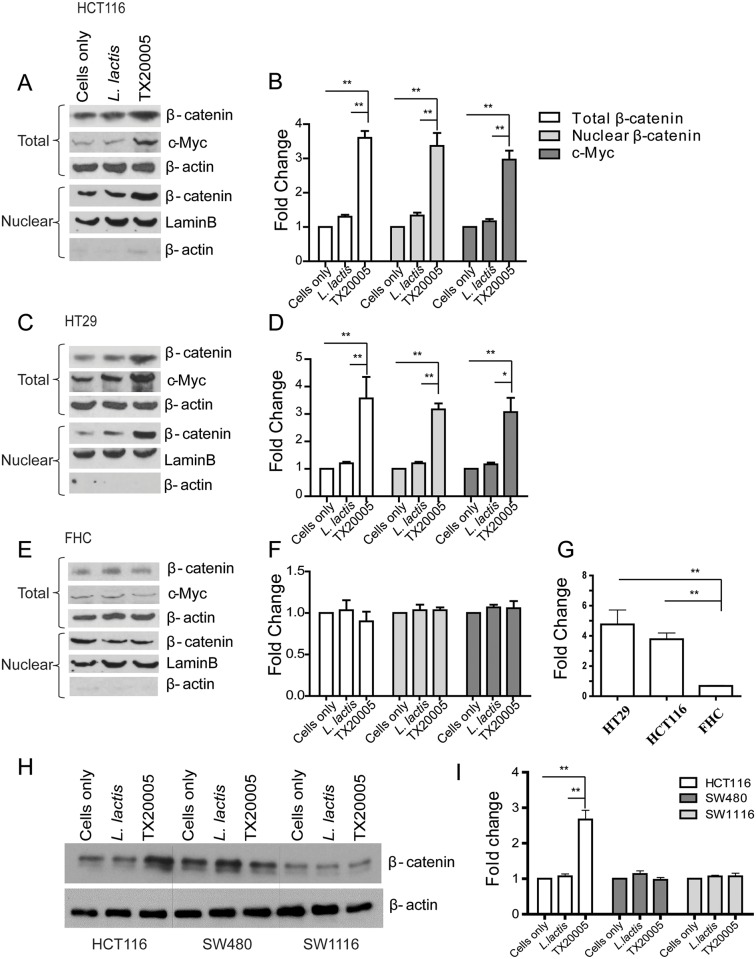
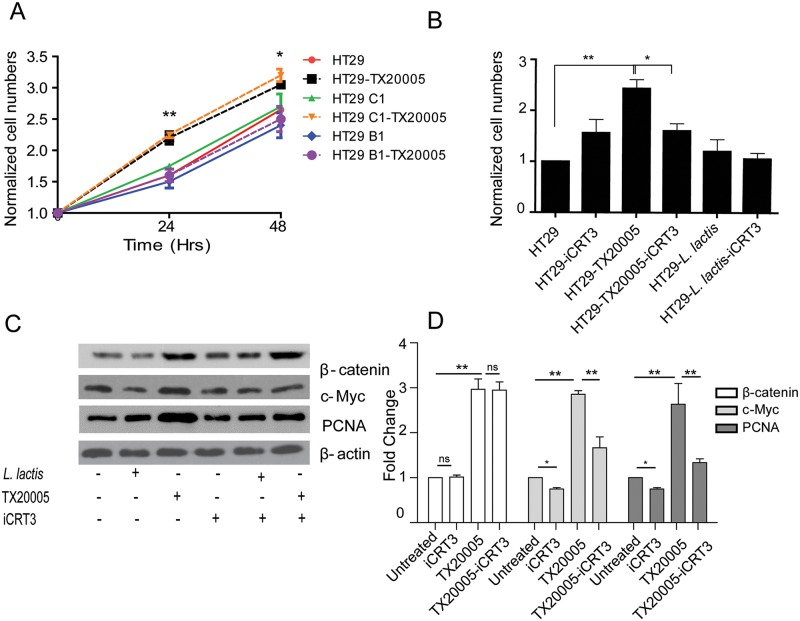
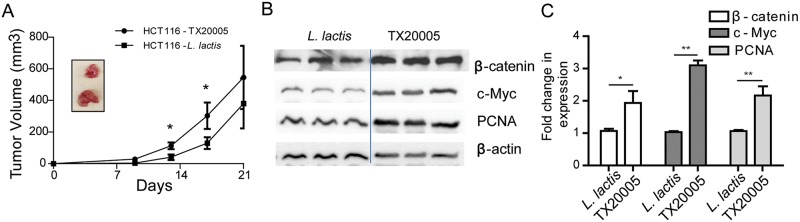
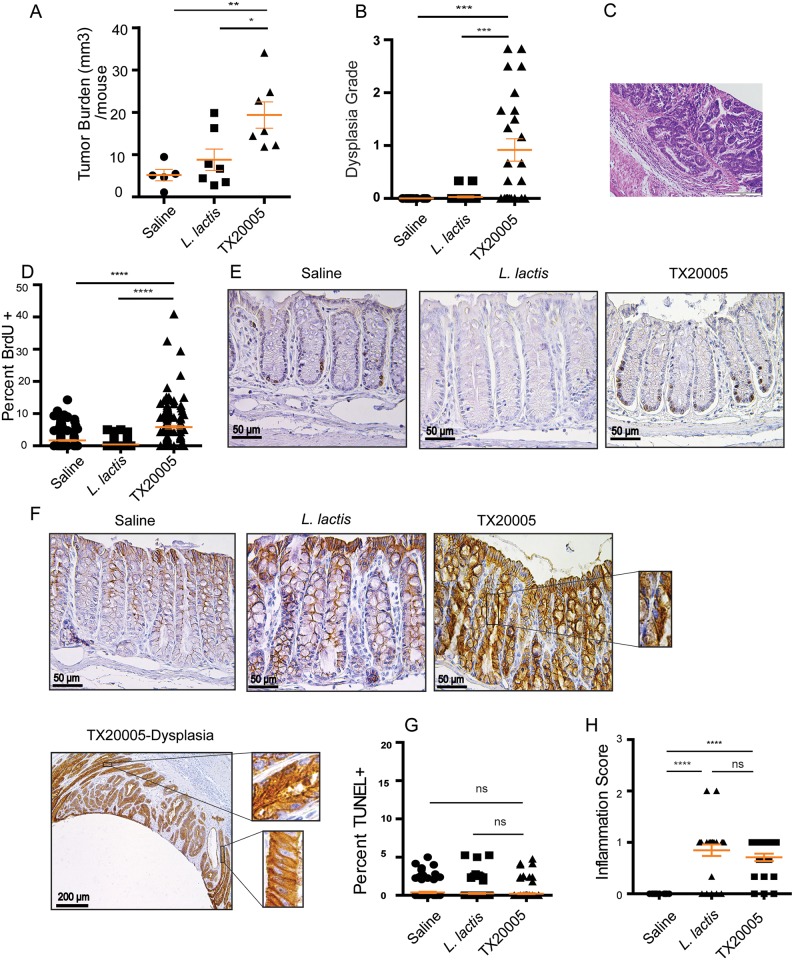
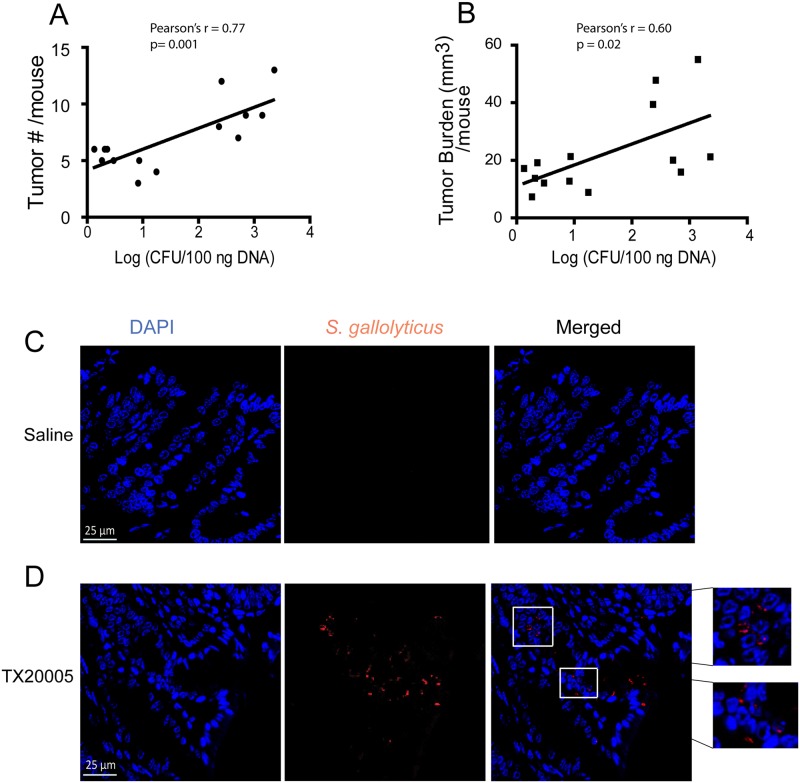
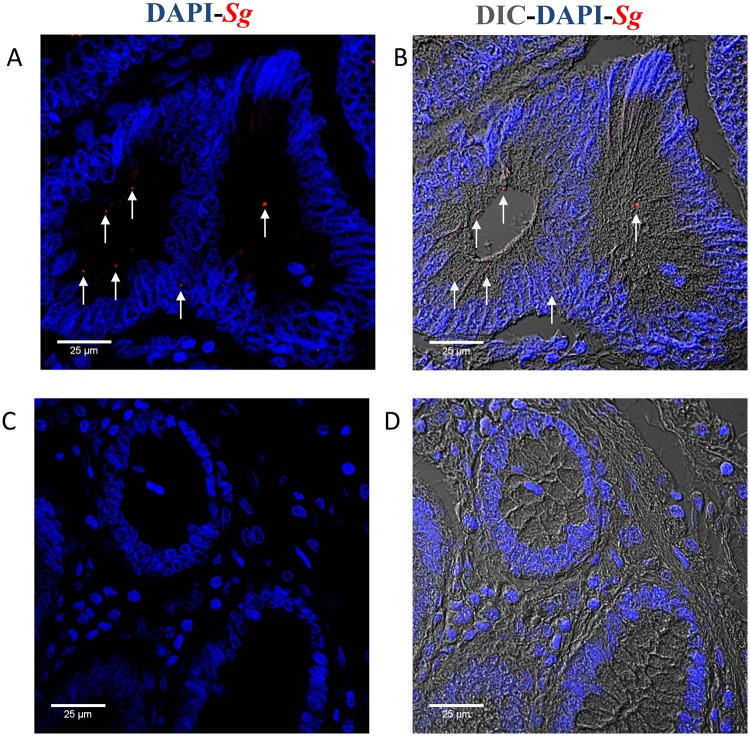
Streptococcus gallolyticus subsp. gallolyticus (Sg) has long been known to have a strong association with colorectal cancer (CRC). This knowledge has important clinical implications, and yet little is known about the role of Sg in the development of CRC. Here we demonstrate that Sg promotes human colon cancer cell proliferation in a manner that depends on cell context, bacterial growth phase and direct contact between bacteria and colon cancer cells. In addition, we observed increased level of β-catenin, c-Myc and PCNA in colon cancer cells following incubation with Sg. Knockdown or inhibition of β-catenin abolished the effect of Sg. Furthermore, mice administered with Sg had significantly more tumors, higher tumor burden and dysplasia grade, and increased cell proliferation and β-catenin staining in colonic crypts compared to mice receiving control bacteria. Finally, we showed that Sg is present in the majority of CRC patients and is preferentially associated with tumor compared to normal tissues obtained from CRC patients. These results taken together establish for the first time a tumor-promoting role of Sg that involves specific bacterial and host factors and have important clinical implications.


Conflict of interest statement

The authors have declared that no competing interests exist.

Figures

Fig 1
Fig 1. Sg stimulates cell proliferation in responsive colon cancer cell lines.
Human colon cancer cell lines HCT116 (A), HT29 (B), LoVo (C), SW480 (D), and SW1116 (E), human lung cancer cell line A549 (F), human kidney epithelial cell line HEK293 (G), and normal human colon epithelial cell lines CCD841CoN (H) and FHC (I) were tested. Cells were seeded into the wells of 6-well plates at 1x10⁴ cells per well and incubated for 12 hours. Stationary phase bacteria were washed with sterile phosphate buffered saline, pH 7.4 (PBS) and resuspended in the appropriate cell culture media. Bacterial suspension or media only were then added to the wells at 1x10² cfu/well, and incubated for 24 or 48 hours. Cells were stained with trypan blue and counted in an automated cell counter. Each experiment was done with duplicate wells and repeated at least three times. Data are presented as the mean ± standard error of the mean (SEM). Two-way, two-tailed analysis of variance (ANOVA) followed by Student-Newman-Keuls (SNK) test was used to analyze the data. Significance shown in panels A-C is for comparison between cells co-cultured with TX20005 and those with L. lactis. *, p < 0.05; **, p < 0.01.
Fig 2
Fig 2. Sg promotes cell proliferation but does not affect apoptosis.
HCT116, HT29, or FHC cells (~1x10⁵/well) were incubated with L. lactis or TX20005 (~1x10⁵/well) or media only for 12 hours. Cells were pulsed with 10 μM BrdU for 30 mins, incubated with anti-BrdU antibodies and secondary antibodies, and analyzed by flow cytometry (AC). The level of PCNA was determined by western blot assays using total cell lysates from cells co-cultured with TX20005, L. lactis or media only (DF). Representative images are shown. Band intensity was quantified using Image J, normalized to β-actin, and combined from at least three independent experiments (GI). Apoptotic cells were detected by staining cells with PI and anti-Annexin V antibodies and secondary antibodies, followed by flow cytometry (JL). Each experiment was done with duplicate wells and was repeated at least three times. Data are presented as mean ± SEM. One-way, two tailed ANOVA followed by SNK test was used for statistical analysis. *, p < 0.05; **, p < 0.01.
Fig 3
Fig 3. Promotion of cell proliferation requires Sg-specific factors and depends on bacterial growth phase and direct contact with CRC cells.
A and D. Species closely related to Sg do not promote cell proliferation. Stationary phase bacteria were added to HT29 (A) and HCT116 (D) cells, co-cultured for 24 hours and viable cell numbers enumerated. Sg, S. gallolyticus subsp. gallolyticus; Si, Streptococcus infantarius; Sm, S. gallolyticus subsp. macedonicus; Sp, S. gallolyticus subsp. pasteurianus. B and E. Promotion of cell proliferation requires stationary but not exponential phase Sg. TX20005 bacteria harvested at exponential or stationary phase of growth were added to HT29 (B) and HCT116 (E) cells and co-cultured for 24 hours. Viable cell numbers were enumerated. C and F. Promotion of cell proliferation requires direct contact between Sg and responsive cells. Stationary phase TX20005 bacteria were added to transwell inserts (0.4 μm pore) (TX20005-TW) or directly to cells and co-cultured with HT29 (C) and HCT116 (F) cells for 24 and 48 hours. Viable cell numbers were enumerated. Data are presented as the mean ± SEM. Each experiment was done with duplicate wells and was repeated at least three times. Data in panels A and D were analyzed using one-way, two-tailed ANOVA, followed by SNK test. Data in panels B and E were analyzed by unpaired, two-tailed t test, stationary phase vs. exponential phase. Data in panels C and F were analyzed using two-way, two-tailed ANOVA followed by SNK test. Significance shown in C and F is for comparison between cells co-cultured with TX2005 directly and cells cultured with TX20005-TW. *, p < 0.05; **, p < 0.01.
Fig 4
Fig 4. Sg increases the level of β-catenin, c-Myc and cyclin D1 in HCT116 and HT29 cells.
Approximately 1x10⁵ cells/well were incubated with bacteria (~105 cfu/well) or media only for 12 hours in a 6 well plate. Whole cell or nuclear lysates as well as RNA were extracted and analyzed by western blot assays using specific antibodies (A-F, H, and I) or RT-qPCR (G). Representative images are shown (A, C, E and H). A and B, HCT116; C and D, HT29; E and F, FHC. Band intensity was quantified using Image J, normalized to β-actin or lamin B first and then normalized to the cells only control. G. Sg increased the expression of cyclin D1 in HCT116 and HT29 cells. ΔΔCT was first normalized to GAPDH then to cells cultured in media only. Results in panels B, D, F, G and I were combined from at least 3 experiments. Data are presented as mean ± SEM. Data were analyzed using one-way, two-tailed ANOVA followed by SNK test. *, p < 0.05; **, p < 0.01.
Fig 5
Fig 5. Sg promotes cell proliferation in a β-catenin dependent manner.
A. Knockdown of β-catenin abolished the effect of Sg. Cell proliferation assays were performed as described in the legend for Fig 1. Untransfected HT29 cells, β-catenin stable knockdown HT29 cells (HT29-B1) or HT29 cells transfected with a control shRNA (HT29-C1) were used. Data was analyzed using two-way two-tailed ANOVA followed by SNK test. Significance shown panel A is for comparison between HT29 cells co-cultured with TX20005 and HT29-B1 with TX20005. BD. Inhibition of β-catenin transcriptional activity by iCRT3 rendered cells unresponsive to Sg. B. Stationary phase TX20005 or L. lactis bacteria were added to the wells (~1x10² cfu/well) in the presence or absence of iCRT3 (25 μM), incubated for 24 hours and viable cells enumerated. C and D. Stationary phase TX20005 or L. lactis were added to cells (~105 cfu/well) as described in the legend for Fig 4 and incubated for 12 hours in the presence or absence of iCRT3. Total cell lysates were prepared and subject to western blot assays to compare β-catenin, c-Myc and PCNA protein levels. Representative images are shown (C). Band intensity was quantified using Image J, normalized to β-actin first and then to the cells only control (D). Data are presented as the mean ± SEM. Each experiment was done with duplicate wells and was repeated at least three times. Data in panels B and D were analyzed by using unpaired, two-tailed t test. *, p < 0.05; **, p < 0.01.
Fig 6
Fig 6. Sg treatment promotes tumor growth in a xenograft model.
A. Sg-treated cells developed larger tumors in nude mice. ~ 1x 10⁶ HCT116 cells were treated with TX20005 or L. lactis, mixed with Matrigel and injected into the dorsal flap of nude mice (n = 5/group) as described in the Methods and Materials section. Tumor size was measured at the indicated time point with a digital caliper. B-C. Sg-treated xenografts had higher levels of β-catenin, c-Myc and PCNA compared to L. lactis-treated ones. Tumors were collected on day 21. Three tumors were randomly selected from each group. Protein extracts were analyzed by western blot assays (B). Protein level was normalized to β-actin first and then to L. lactis-treated controls (C). Data is presented as the mean ± SEM. Statistical analysis was done using unpaired, two-tailed t test. *, p < 0.05; **, p < 0.01. Significance shown in panel A is of comparison between TX20005-treated and L. lactis-treated HCT116 cells at day 13 and 19, respectively.
Fig 7
Fig 7. Sg promotes colon tumor development in an AOM-induced mouse model of CRC.
A-H. This was performed as described in the Methods and Materials section. Briefly, A/J mice were administered 2 weekly i.p. injections of AOM, followed by treatment with Amp for 1 week and then oral gavage of bacteria or saline for 24 weeks. Colons were visually examined for macroscopic tumors. Tumor burden (A) was calculated. H&E stained colon sections were evaluated for dysplasia (B). An image from the TX20005-treated group with a dysplasia grade of 3.5 is shown (C). Proliferating cells were determined by staining colon sections for BrdU incorporation (D and E). Colon sections were also stained for β-catenin (F). Apoptosis was assessed by performing TUNEL assays (G). H&E stained colon sections were also evaluated for inflammation and average inflammation score for each treatment group is shown (H). n = 5 for saline, n = 7 for L. lactis and TX20005, respectively. All colon evaluation was done by blinded observers. Data is presented as mean ± SEM. Statistical analysis was performed using one-way, two-tailed ANOVA followed by SNK test. *, p < 0.05; **, p < 0.01; ***, p < 0.001; ****, p < 0.0001.
Fig 8
Fig 8. Correlation of bacterial burden with tumor number and burden.
A and B. Fecal pellets were collected from mice at the end of the 12-week oral gavage of TX20005 (n = 14). DNA was extracted and analyzed by qPCR to determine the relative abundance of TX20005 as described in the Methods and Materials section. Pearson correlation analysis was performed between bacterial counts and tumor number (A) and burden (B), respectively. For tumor number, Pearson’s r = 0.77, p = 0.001, and for tumor burden, Pearson’s r = 0.60, p = 0.02. C and D. Immunofluorescence detection of Sg in mouse colon tumor tissues. Methcarn-fixed paraffin embedded colon sections (5 μm) from mice treated twice with AOM and 24 weeks of oral gavage with saline (C) or TX20005 (D) were incubated with anti-TX20005 antiserum and secondary antibodies as described in the Methods and Materials section. Nuclei were stained with DAPI. Scale bar represents 25μm.
Fig 9
Fig 9. Immunofluorescence detection of Sg in tumor tissues from CRC patients.
Formalin-fixed and paraffin embedded human tumor (stage II) (A and B) and normal tissues (C and D) were deparaffinized, rehydrated, and stained with anti-Sg antibodies as described in the Methods and Materials section. Nuclei were stained with DAPI. Arrows point towards Sg-positive staining. The scale bar represents 25μm.

References

    1. Cancer Facts & Figures 2013. American Cancer Society.
    1. Siegel R, Desantis C, Jemal A (2014) Colorectal cancer statistics, 2014. CA Cancer J Clin 64: 104–117. doi: 10.3322/caac.21220 - DOI - PubMed
    1. Boleij A, Tjalsma H (2012) Gut bacteria in health and disease: a survey on the interface between intestinal microbiology and colorectal cancer. Biol Rev Camb Philos Soc 87: 701–730. doi: 10.1111/j.1469-185X.2012.00218.x - DOI - PubMed
    1. Kostic AD, Chun E, Robertson L, Glickman JN, Gallini CA, et al. (2013) Fusobacterium nucleatum potentiates intestinal tumorigenesis and modulates the tumor-immune microenvironment. Cell Host Microbe 14: 207–215. doi: 10.1016/j.chom.2013.07.007 - DOI - PMC - PubMed
    1. Rubinstein MR, Wang X, Liu W, Hao Y, Cai G, et al. (2013) Fusobacterium nucleatum promotes colorectal carcinogenesis by modulating E-cadherin/beta-catenin signaling via its FadA adhesin. Cell Host Microbe 14: 195–206. doi: 10.1016/j.chom.2013.07.012 - DOI - PMC - PubMed

MeSH terms