

Amide proton transfer-weighted magnetic resonance image-guided stereotactic biopsy in patients with newly diagnosed gliomas
- PMID: 28704644
- PMCID: PMC5572540
- DOI: 10.1016/j.ejca.2017.06.009
Amide proton transfer-weighted magnetic resonance image-guided stereotactic biopsy in patients with newly diagnosed gliomas
Abstract
Purpose: Pathological assessment using World Health Organization (WHO) criteria is the gold standard for diagnosis of gliomas. However, the accuracy of diagnosis is limited by tissue sampling, particularly for infiltrating, heterogeneous tumours. We assessed the accuracy of amide proton transfer-weighted (APTw) magnetic resonance imaging (MRI)-guided tissue sampling to identify regions of high-grade glioma via radiographic-histopathologic correlation in patients with newly suspected glioma.
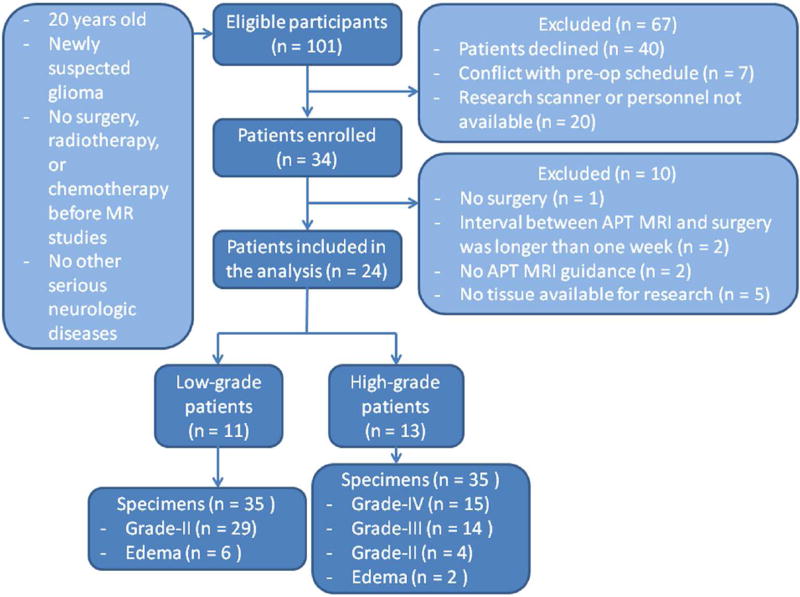
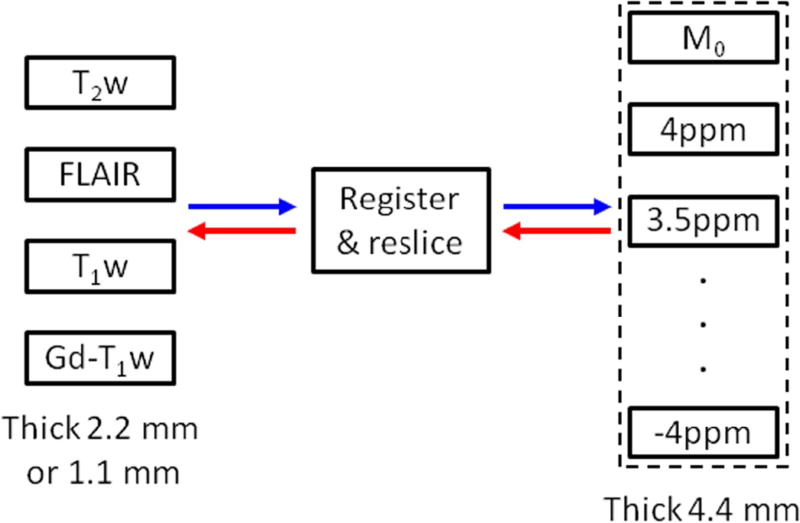
Patients and methods: Twenty-four patients with previously undiagnosed gliomas underwent a volumetric APTw MRI prior to their first neurosurgical procedure. A total of 70 specimens were collected via APTw image-directed stereotactic biopsy. Cellularity, necrosis, proliferation and glioma WHO grade were analysed for all specimens and correlated with corresponding APTw signal intensities.
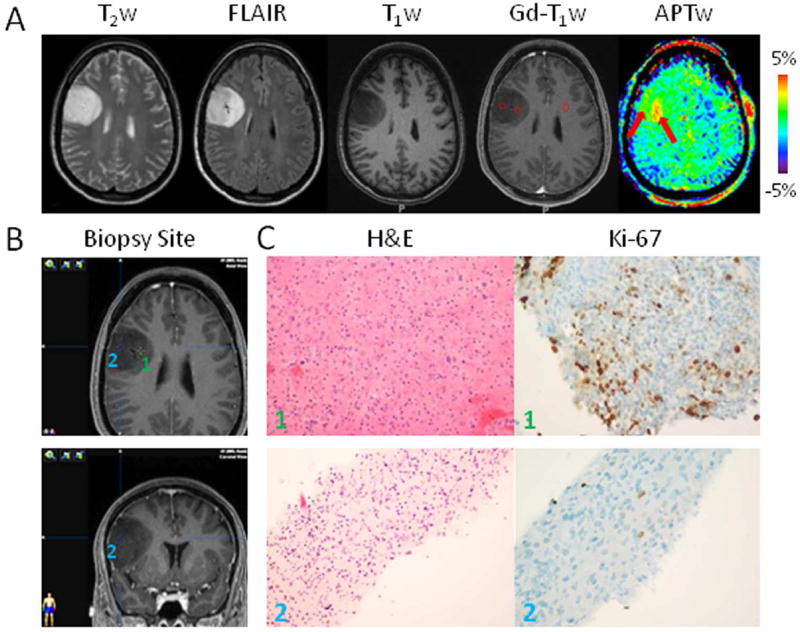
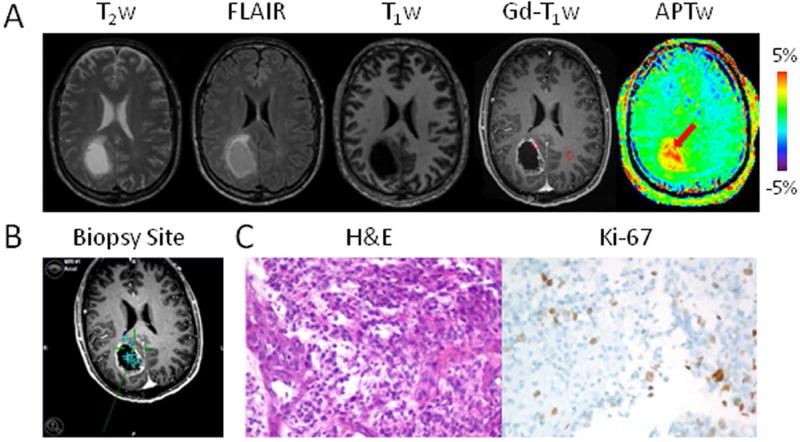
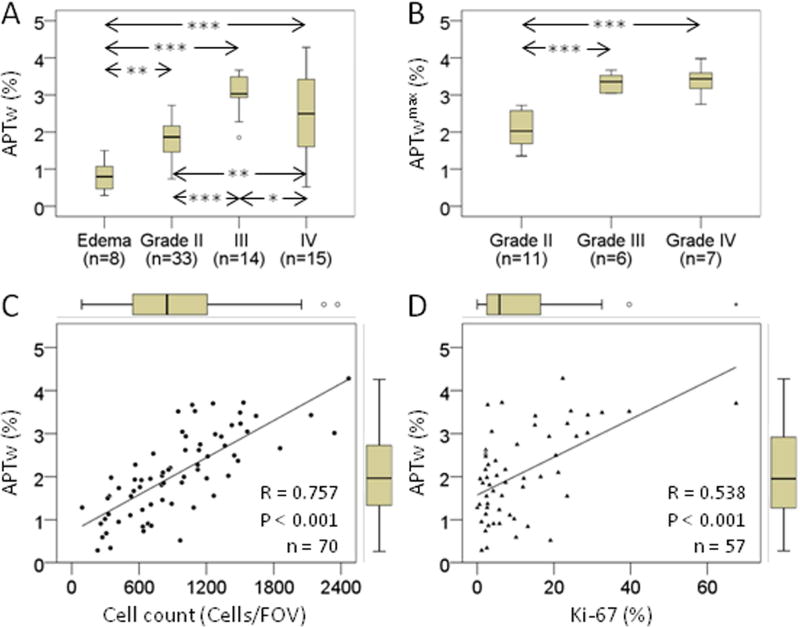
Results: Thirty-three specimens displayed grade-II pathology, 14 grade-III, 15 grade-IV, and eight specimens revealed only peritumoural oedema. Multiple glioma grades were found within a single lesion in six patients. APTw signal intensities of the biopsied sites and the maximum APTw values across all biopsied sites in each patient were significantly higher for high-grade versus low-grade specimens. APTw signal intensities were significantly positively correlated with cellularity (R = 0.757) and proliferation (R = 0.538). Multiple linear regression analysis showed that tumour cellularity and proliferation index were the best predictors of APTw signal intensities.
Conclusion: APTw imaging identified tumour areas of higher cellularity and proliferation, allowing identification of high-grade regions within heterogeneous gliomas. APTw imaging can be readily translated for more widespread use and can assist diagnostic neurosurgical procedures by increasing the accuracy of tumour sampling in patients with infiltrating gliomas.
Keywords: Amide proton transfer-weighted imaging; Glioma; Histopathologic validation; Image-guided biopsy; Imaging biomarker.
Copyright © 2017 Elsevier Ltd. All rights reserved.
Conflict of interest statement
J.Z. and P.v.Z. are co-inventors on a patent for the APT MRI technology. This patent is owned and managed by Johns Hopkins University. All other authors declared no potential conflicts of interest with respect to the research, authorship, and/or publication of this article.
Figures
Similar articles
-
Identifying Recurrent Malignant Glioma after Treatment Using Amide Proton Transfer-Weighted MR Imaging: A Validation Study with Image-Guided Stereotactic Biopsy.Clin Cancer Res. 2019 Jan 15;25(2):552-561. doi: 10.1158/1078-0432.CCR-18-1233. Epub 2018 Oct 26. Clin Cancer Res. 2019. PMID: 30366937 Free PMC article.
-
Predicting IDH mutation status in grade II gliomas using amide proton transfer-weighted (APTw) MRI.Magn Reson Med. 2017 Sep;78(3):1100-1109. doi: 10.1002/mrm.26820. Epub 2017 Jul 16. Magn Reson Med. 2017. PMID: 28714279 Free PMC article.
-
Differentiating the histologic grades of gliomas preoperatively using amide proton transfer-weighted (APTW) and intravoxel incoherent motion MRI.NMR Biomed. 2018 Jan;31(1):10.1002/nbm.3850. doi: 10.1002/nbm.3850. Epub 2017 Nov 3. NMR Biomed. 2018. PMID: 29098732 Free PMC article.
-
Amide proton transfer-weighted MRI in distinguishing high- and low-grade gliomas: a systematic review and meta-analysis.Neuroradiology. 2019 May;61(5):525-534. doi: 10.1007/s00234-018-02152-2. Epub 2019 Jan 21. Neuroradiology. 2019. PMID: 30666352
-
Performance of amide proton transfer imaging to differentiate true progression from therapy-related changes in gliomas and metastases.Eur Radiol. 2025 Feb;35(2):580-591. doi: 10.1007/s00330-024-11004-y. Epub 2024 Aug 12. Eur Radiol. 2025. PMID: 39134744 Free PMC article.
Cited by
-
Amide Proton Transfer (APT) imaging in tumor with a machine learning approach using partially synthetic data.ArXiv [Preprint]. 2023 Dec 13:arXiv:2311.01683v2. ArXiv. 2023. Update in: Magn Reson Med. 2024 May;91(5):1908-1922. doi: 10.1002/mrm.29970. PMID: 37961738 Free PMC article. Updated. Preprint.
-
NOE-weighted imaging in tumors using low-duty-cycle 2π-CEST.Magn Reson Med. 2023 Feb;89(2):636-651. doi: 10.1002/mrm.29475. Epub 2022 Oct 5. Magn Reson Med. 2023. PMID: 36198015 Free PMC article.
-
Molecular Imaging of Brain Tumors and Drug Delivery Using CEST MRI: Promises and Challenges.Pharmaceutics. 2022 Feb 20;14(2):451. doi: 10.3390/pharmaceutics14020451. Pharmaceutics. 2022. PMID: 35214183 Free PMC article. Review.
-
Review and consensus recommendations on clinical APT-weighted imaging approaches at 3T: Application to brain tumors.Magn Reson Med. 2022 Aug;88(2):546-574. doi: 10.1002/mrm.29241. Epub 2022 Apr 22. Magn Reson Med. 2022. PMID: 35452155 Free PMC article. Review.
-
Influences of experimental parameters on chemical exchange saturation transfer (CEST) metrics of brain tumors using animal models at 4.7T.Magn Reson Med. 2019 Jan;81(1):316-330. doi: 10.1002/mrm.27389. Epub 2018 Aug 19. Magn Reson Med. 2019. PMID: 30125383 Free PMC article.
References
-
- Stupp R, Mason WP, van den Bent MJ, Weller M, Fisher B, Taphoorn MJB, et al. Radiotherapy plus concomitant and adjuvant temozolomide for glioblastoma. N Engl J Med. 2005;352:987–996. - PubMed
-
- Scott JN, Brasher PM, Sevick RJ, Rewcastle NB, Forsyth PA. How often are nonenhancing supratentorial gliomas malignant? A population study. Neurology. 2002;59:947–949. - PubMed
-
- Weller M, van den Bent M, Hopkins K, Tonn JC, Stupp R, Falini A, et al. EANO guideline for the diagnosis and treatment of anaplastic gliomas and glioblastoma. Lancet Oncology. 2014;15:E395–E403. - PubMed
-
- Knopp EA, Cha S, Johnson G, Mazumdar A, Golfinos JG, Zagzag D, et al. Glial neoplasms: dynamic contrast-enhanced T2*-weighted MR imaging. Radiology. 1999;211:791–798. - PubMed
Publication types
MeSH terms
Substances
Grants and funding
LinkOut - more resources
Full Text Sources
Other Literature Sources
Medical
