. 2017 Jul 12;22(1):25-37.e6.
doi: 10.1016/j.chom.2017.06.007.

Indoleacrylic Acid Produced by Commensal Peptostreptococcus Species Suppresses Inflammation

Affiliations

Indoleacrylic Acid Produced by Commensal Peptostreptococcus Species Suppresses Inflammation

Marta Wlodarska et al. Cell Host Microbe. .

Abstract

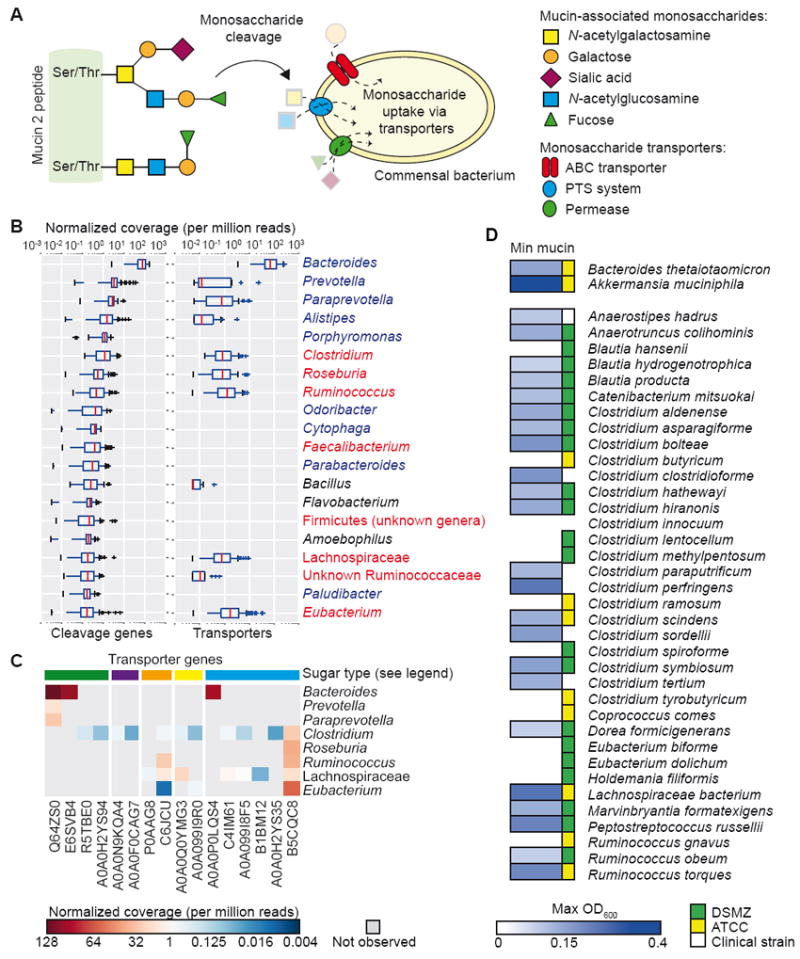
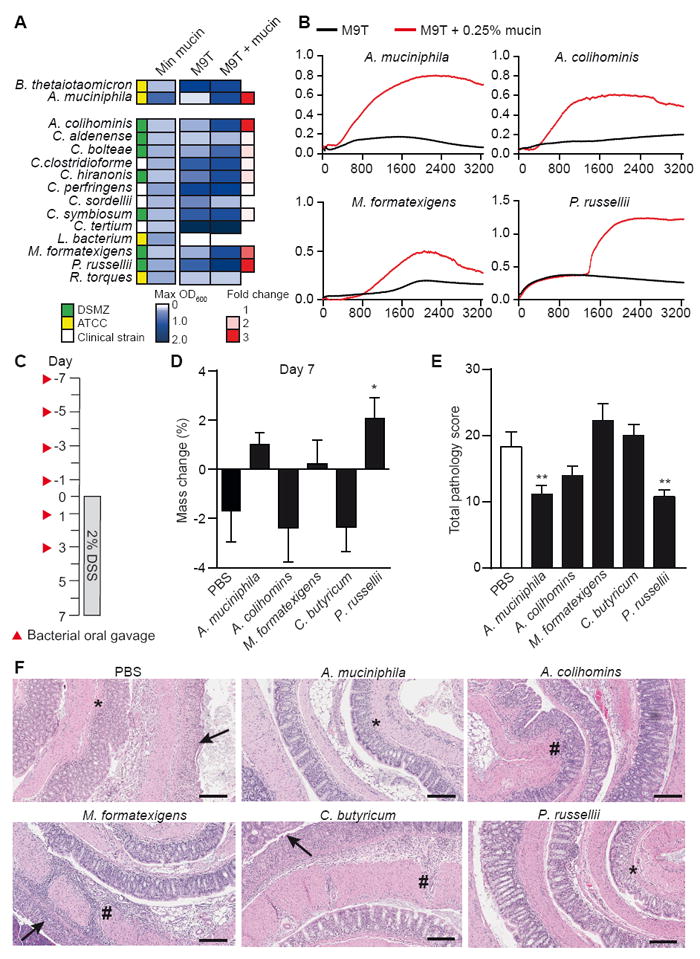
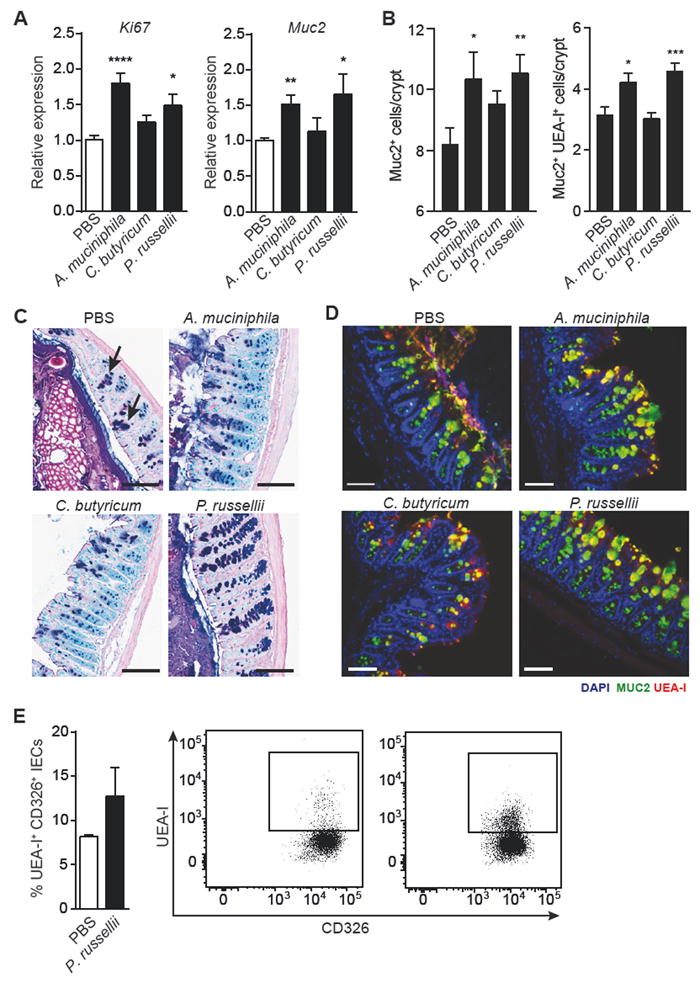
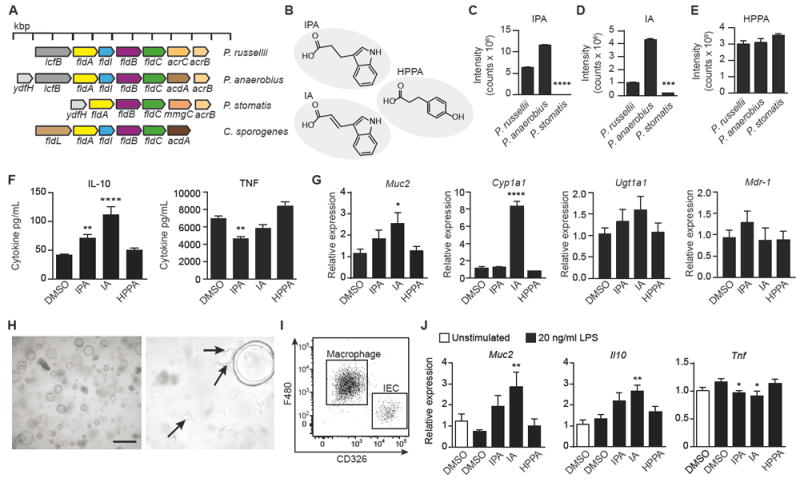
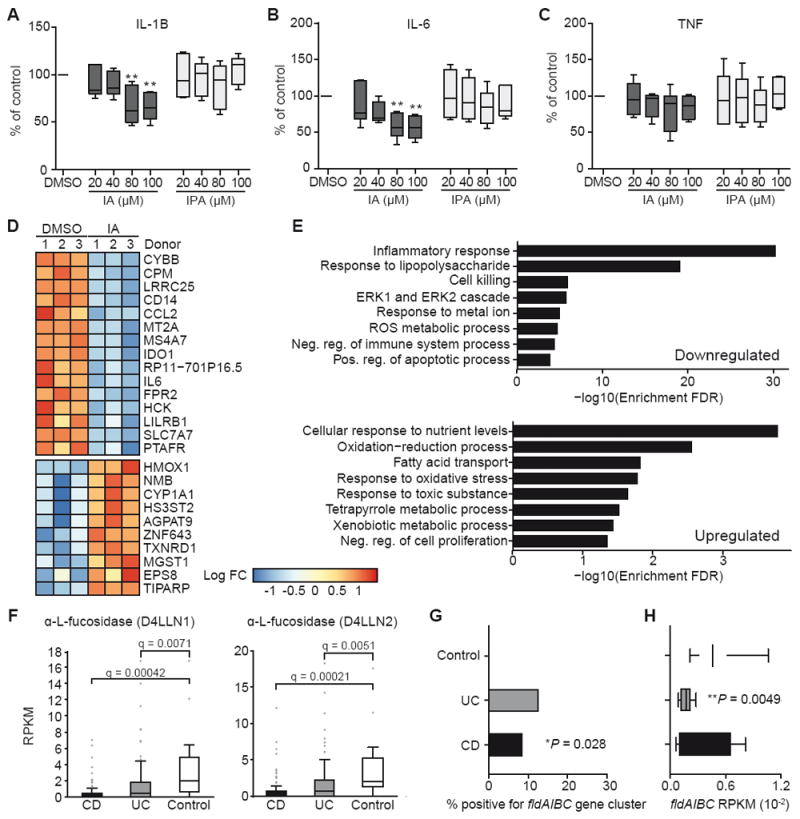
Host factors in the intestine help select for bacteria that promote health. Certain commensals can utilize mucins as an energy source, thus promoting their colonization. However, health conditions such as inflammatory bowel disease (IBD) are associated with a reduced mucus layer, potentially leading to dysbiosis associated with this disease. We characterize the capability of commensal species to cleave and transport mucin-associated monosaccharides and identify several Clostridiales members that utilize intestinal mucins. One such mucin utilizer, Peptostreptococcus russellii, reduces susceptibility to epithelial injury in mice. Several Peptostreptococcus species contain a gene cluster enabling production of the tryptophan metabolite indoleacrylic acid (IA), which promotes intestinal epithelial barrier function and mitigates inflammatory responses. Furthermore, metagenomic analysis of human stool samples reveals that the genetic capability of microbes to utilize mucins and metabolize tryptophan is diminished in IBD patients. Our data suggest that stimulating IA production could promote anti-inflammatory responses and have therapeutic benefits.

Keywords: Muc2; Peptostreptococcus; indoleacrylic acid; indolepropionic acid; mucus; organoid.


Figures

Figure 1
Figure 1. Computational approach to predict microbial mucin utilization
(A) Microbial scavenging of monosaccharides derived from mucin-associated oligosaccharides. Mucin 2 peptide is heavily glycosylated at Ser/Thr residues with oligosaccharides composed of N-acetylgalactosamine, galactose, sialic acid, N-acetylglucosamine, and fucose. Bacterial genes relevant for mucin oligosaccharide utilization by commensal bacteria are listed in Table S1. (B) Genus-level contribution to normalized read coverage from 90 HMP subjects for cleavage genes (left) and transporters (right). Blue font, order Bacteroidales; red font, order Clostridiales. (C) Distribution of transporter gene abundance in each genus. Colors at top indicate sugar transported by indicated gene: green, fucose; purple, sialic acid; orange, galactose; blue, N-acetylglucosamine. (D) Screen for in vitro growth in minimal medium containing mucin as the sole carbon source. Max OD600 values are shown for each strain as averaged across 3 independent experiments. See also Figure S1 and Table S1.
Figure 2
Figure 2. In vitro mucin utilization screen identifies Peptostreptococcus species that protects against DSS-induced colitis
(A) Bacterial strains were grown in minimal media containing glucose and 0.5% tryptone (M9T medium) or M9T supplemented with 0.25% mucin. Max OD600 values were compared to determine the fold change in growth. (B) Growth curves of bacterial strains with greater than 2-fold increase in growth from panel A in M9T (black) compared to M9T + mucin (red). Data are representative of 2 independent experiments. (C) Schematic for oral gavage of mice and 2% DSS time course. (D) Percent mass change at day 7 of DSS exposure relative to weight at day 0. *P = 0.0128. (E) Total histopathology score of the colon on day 7 of DSS exposure. A. muciniphila (**P = 0.0060); P. russellii (**P = 0.0036). (F) Representative images of H&E-stained colon sections from mice orally gavaged with PBS or indicated bacterial strains. Arrows, ulceration; #, transmural inflammation; *, mucosal immune infiltrate. Scale bar, 100 μm. Data represent one experiment, n = 10 per group. Significance determined using one-way ANOVA with Fisher’s LSD test and expressed as mean + SEM (D, E).
Figure 3
Figure 3. P. russellii promotes goblet cell differentiation and function in vivo
Mice were orally gavaged with PBS, A. muciniphila, C. butyricum, or P. russellii every other day for 2 weeks and the distal large intestine was harvested for analysis. (A) Quantitative RT-PCR showing expression of proliferation marker Ki67 (****P < 0.0001; *P = 0.0105) and goblet cell-derived mucin 2 (Muc2; **P = 0.0020; *P = 0.0275), relative to Gapdh. n = 10 per group. Data pooled from 2 independent experiments. (B) Quantification of Muc2+ (**P = 0.0088; *P = 0.0418) and Muc2+UEA-I+ (***P = 0.0009; *P = 0.0184) goblet cell number per crypt in the distal colon, n = 5 per group. (C) Representative alcian blue and periodic acid-Schiff (AB/PAS)-stained distal colon sections showing goblet cell staining within the mucosa. Goblet cells are indicated by black arrows. Scale bar, 100 μm. (D) Representative epifluorescence staining for goblet cells in the distal colon using an antibody against Muc2 (green) and the lectin UEA-I (red) with DAPI (blue) as the counter stain. Scale bar, 100 μm. (E) Intracellular flow cytometry analysis of isolated colonic epithelial cells (CD326+) shows increased presence of UEA-1+CD326+ double-positive cells in P. russellii-treated animals. The lectin UEA-1 binds α-1,2 fucose. Significance determined using Student’s t-test and expressed as mean + SEM. See also Figure S2.
Figure 4
Figure 4. IPA and IA are produced by some Peptostreptococcus species and IA exhibits anti-inflammatory effects
(A) Bacterial genomic comparison showing phenyllactate operon in Peptostreptococcus species compared to a previously identified operon in C. sporogenes. (B) MS QTOF analysis of culture supernatant from Peptostreptococcus species identified tryptophan metabolites (IPA, indole-3-propionic acid; IA, indoleacrylic acid) and a phenylalanine metabolite (HPPA, 3-hydroxyphenyl propionic acid). (C-E) Ion chromatograms extracted at m/z and retention times of IPA (C), IA (D), and HPPA (E) were used to determine the relative abundance of each metabolite produced by 3 indicated strains. See also Figure S3A-S3C. ****P < 0.0001, ***P = 0.0003. Data representative of 3 experiments and expressed as mean + SEM. (F) Isolated and cultured BMDMs were treated with 100 μM of each metabolite or 0.1% DMSO control for 6 h, followed by 24 h of IL-4 conditioning, and then stimulated with 20 ng/mL LPS for 18 h. Supernatants were analyzed for IL-10 (IPA, **P = 0.0032; IA, ****P = 0.0001) and TNF (**P = 0.004) production. Data pooled from 4 independent experiments. (G) Quantitative RT-PCR showing expression of Muc2 (*P = 0.0263), the AhR target gene Cyp1a1 (****P = 0.0001), and the PXR target genes, Ugt1a1 and MDR-1, relative to Actb and compared to 0.1% DMSO control. Data pooled from 2 independent experiments using 4-5 independent colonic spheroid lines. (H) Representative light phase image of large intestinal spheroids co-cultured with macrophages in Matrigel at 5X (left) and 40X (right) magnification. Arrows indicate macrophages with extended pseudopods. (I) Representative flow cytometry dot plot of F480+ macrophages and CD326+ epithelial cells in the co-culture system indicating the percentage of macrophages (80.0 ± 4.3%) and epithelial cells (16.0 ± 4.5%) after 3 days of co-culture, expressed as mean ± SD. (J) Quantitative RT-PCR showing expression of Muc2 (**P = 0.0077), Il10 (**P = 0.0072), and Tnf (*P = 0.0477 for IPA; *P = 0.0148 for IA) in co-culture of large intestinal spheroids and BMDMs after 48 h of treatment with 100 μM IPA, IA, HPPA, or 0.1% DMSO control followed by 20 ng/mL LPS stimulation for 24 h. Data are pooled from 2 independent experiments using 4-5 independent colonic spheroid lines. Significance determined using one-way ANOVA with Fisher’s LSD test and expressed as mean + SEM. See also Figures S3-S4.
Figure 5
Figure 5. IA suppresses cytokine secretion by human PBMCs in response to LPS
(A-C) Human PBMCs were pre-incubated with IA or IPA for 45 min followed by LPS stimulation for 20 h. Collected supernatants were assessed by CBA for secretion of IL-1β (A), IL-6 (B), and TNF (C). Data are normalized to 0.1% DMSO control samples and pooled from 6 human healthy donors. **P < 0.01 by one-way ANOVA with Fisher’s LSD test; data shown as box and whisker plots with mean and min max values. (D) Heatmap showing differentially expressed genes as identified by RNA-Seq (FDR < 0.05) for human PBMCs treated with (IA) or without (DMSO). Donor effects have been removed and values from replicate measurements from the same treatment and donors are averaged. (E) Gene set enrichment analysis from RNA-Seq results on ranked lists of upregulated and downregulated genes. (F) Abundance of mucin utilization genes in metagenomic data from controls and individuals with CD or UC. Significance determined using student’s t-test and FDR adjusted using Hochberg-Benjamini procedure. (G) Incidence of phenyllactate gene cluster in controls and individuals with CD or UC; *P = 0.028, CD vs. control comparison by Chi2 contingency table test. (H) Abundance of phenyllactate gene cluster in controls and individuals with CD or UC; **P = 0.0049, UC vs. control comparison by student’s t-test. See also Figure S5.

References

    1. Abreu AG, Abe CM, Nunes KO, Moraes CT, Chavez-Duenas L, Navarro-Garcia F, Barbosa AS, Piazza RM, Elias WP. The serine protease Pic as a virulence factor of atypical enteropathogenic Escherichia coli. Gut Microbes. 2016;7:115–125. - PMC - PubMed
    1. Alam A, Leoni G, Quiros M, Wu H, Desai C, Nishio H, Jones RM, Nusrat A, Neish AS. The microenvironment of injured murine gut elicits a local pro-restitutive microbiota. Nat Microbiol. 2016;1:15021. - PMC - PubMed
    1. Altschul SF, Gish W, Miller W, Myers EW, Lipman DJ. Basic local alignment search tool. J Mol Biol. 1990;215:403–410. - PubMed
    1. Ananthakrishnan AN, Huang H, Nguyen DD, Sauk J, Yajnik V, Xavier RJ. Differential effect of genetic burden on disease phenotypes in Crohn’s disease and ulcerative colitis: analysis of a North American cohort. Am J Gastroenterol. 2014;109:395–400. - PMC - PubMed
    1. Anders S, Pyl PT, Huber W. HTSeq--a Python framework to work with high-throughput sequencing data. Bioinformatics. 2015;31:166–169. - PMC - PubMed

MeSH terms

LinkOut - more resources